Methods: In this work three methods to detect radioactivity are briefly compared focusing on the most recent, which converts a smartphone into a radiation counter.
Results: The results of a simple sensitivity test are presented showing the measure of the activity of reference sources put at different distances from each sensor.
Discussion: The three methods are discussed in terms of availability, technology, sensitivity, resolution and usefulness. The reported results can be usefully transferred into a radiological emergency scenario and they also offer some interesting implication for our current everyday life, but show that the hardware of the tested smart-phone can detect only high levels of radioactivity. However the technology could be interesting to build a working detection and measurement chain which could start from a diffused and networked first screening before the final high resolution analysis.
]]>Introduction
The number of nuclear plants in the world, either in or out of service, is growing and many of them are built with obsolete technology and are becoming older and older 1. Therefore some release of radionuclides into the environment can be expected in the future.
For this reason, the average (informed) citizen and big organizations could both be interested in innovative and simple methods to check the radiological safety of the local environment and of commodities, starting from foods. Traditional methods require special expertise with expensive and heavy devices and for this reason they are not very popular and only specialized organizations can afford them. On the other hand, if detecting radioactivity were as simple and cheap as measuring atmospheric pressure or body temperature, it could raise a great interest especially in our networked society and particularly during a radiological emergency.
In recent years, an astounding availability of portable and wearable 2 sensors has flooded the consumer market, as an effect of the explosion of the smartphone market.
Almost anyone can currently monitor georeferenced environmental parameters and can find out and share their measurements in real time 3.
The parameters that can be more easily measured by a smartphone and the appropriate apps installed and running are: local magnetic field (Intensity and direction), visible light (intensity and composition in terms of three-component colorimetric measurement), sound (level and spectrum), atmospheric pressure, atmospheric humidity, latitude, longitude, speed, acceleration, local gravity. In the same way it is well known that almost everyone can take and share in real time georeferenced photos, videos and sound recordings.
It is less widely known that with the same hardware (a smartphone with a built-in camera) and the appropriate software, anyone can monitor radioactivity and measure its intensity, although with sensitivity limitations 4,5,6,14.
In this work, three methods for radioactivity detection and measurement in commodities and in the environment are briefly compared and discussed. They are different in technology, sensitivity, resolution, and cost.
A method that is very recent relies on the current smartphone technology, with no need for additional hardware, which makes it cheap and widely available. It could be valuable for a wide screening activity and for the production, spreading and sharing of information 7. The aim of this work is to verify its putative usefulness in the field.
The two other methods are well known in the specialized laboratory and depend on specialized instruments. They were adopted here as a reference to evaluate the usefulness of the method based on the smartphone technology.
Methods
The Reference Sources
To test and calibrate the detectors adopted in this work, a reference standard, characterized by a weak and safe (NRC/IAEA/EU exempt quantity) but clearly detectable gamma ray emission, was needed. A set of eight factory-calibrated point sources was chosen: the RSS8UN set by Spectrum Techniques, LLC., including Ba-133 (t1⁄2 = 10 year), Cd-109 (t1⁄2 = 462.6 day), Co-57 (t1⁄2 = 271 day), Co-60 (t1⁄2 = 5.27 year), Mn-54 (t1⁄2 = 312 day), Na-22 (t1⁄2 = 2.6 year) and Zn-65 (t1⁄2 = 244 day) at 3.7×10⁴ Bq on May 2015, Cd-109 (t1⁄2 = 463 day) and Na-22 (t1⁄2 = 2.6 year) at 3.7×10⁴ Bq on Apr 2015 and Cs-137 (t1⁄2 = 30 year) at 3.7×10³ Bq on Apr 2015.
The Instruments
The first kind of detector adopted was based on smartphone technology.
Three common models were tested. They were equipped with a specialized app: “RadioactivityCounter” 4,8 (https://www.hotray-info.de/). The app is available for Android and iOS systems.
The adopted models were Samsung S4, Samsung S7 and Samsung A3.
The S4 is equipped with a 4.4×3.4=15 mm2 sensor (resolution 4128 x 3096 = 12780288 pixel), the S7 is equipped with a 4.2×3.1=13 mm2 sensor (resolution 4032 x 3024=12192768 pixel), the A3 is equipped with a 3.6×2.7=9.7 mm2 sensor (resolution 3264 x 2448 = 7990272 pixels).
CCD or CMOS chips, used as digital image sensors in surveillance or in smartphone cameras, are sensitive not only to visible light but also to higher energy photons. The software analyzes the signals produced by the front or by the rear camera of the smartphone, which has been previously shielded from visible light by an alluminium foil, subtracts the thermal noise and estimates the gamma-ray exposure of the sensor. Furthermore the background emission (measured before) can be subtracted.
The second kind of detector was the Geiger counter PRD 100 (https://www.prd100.com/), made by ITS srl. This device is equipped with a Geiger-Müller tube of 111 mm length x 11 mm diameter (max. section 1221 mm2), which is small enough to allow full portability but whose section is much larger (82 times) than the section of the largest smartphone sensor (15 mm2).
This detector shows additional interesting features: it is cheap (around 100 €), it is small and easily portable (190 g, 123 mm x 91 mm x 35 mm) it works with rechargeable standard batteries (3 AA), it can work in stand-alone mode and/or connected with a smartphone via a Bluetooth radio interface.
A dedicated app (Marie pro PRD-100) running on the smartphone provides some essential real time radiation counting and data displaying, saving, sharing and geo-referencing.
The third kind of instrument chosen in this work was a 1024 channel NaI(Tl) gamma spectrometer made by Ortec, priced around 18000 €.
The system hardware consists of a thallium-doped sodium iodide detector enclosed in a low-background lead shield (30 mm thick), an analog-to-digital converter (ORTEC DigiBase) integrated in an all-in-one spectrometer, and a laptop PC. The digiBASE supplies the multi-channel analyzer function, the high voltage for the NaI(Tl) detector, and all the signal processing electronics. The internal stabilization electronics and the internal check source (K-40 4500 Bq/kg) allow the system to be used over a wide range of environmental conditions. However it can be hardly defined portable, if the 80 kg lead shield is taken into consideration. The NaI(Tl) crystal is a 76.2 mm height x 76.2 mm diameter (3” x 3”) standard. The digiBase is connected to the control computer via a USB interface, which powers the whole system.
Several proprietary software components control the instrument, from the first setting to the final analysis. Ortec MCB Connections-32 acts as a first-level connection driver for the DigiBase. Maestro-32 MCA Emulation Software provides the second-level control of the DigiBase, the live spectral display and the automatic control of acquisition and analysis. This is achieved via a graphical user-programmable interface or via pre-programmed job streams. The software provides also data and results printing and storage. NuclideNavigator is an interactive gamma-ray reference and library program to view, query, and extract gamma-ray energies and yields, half-lives and parent/daughter relations from databases. It can be used to build application libraries or working libraries. ScintiVision-32 is an integrated multi-channel analyzer (MCA) emulator and gamma-spectrum analysis program. It integrates Maestro-32 functions and manages the collection and analysis of gamma-ray spectra. It includes commands that allow you to edit nuclide libraries and automated command sequences or “job streams.”
The set of technologies described regarding gamma-spectroscopy with sodium iodide scintillator allows the identification and quantitative determination of gamma ray emitting radioisotopes, either natural ones such as K-40, U-238, Th-232 or anthropic ones such as Cs-137 and I-131 9, single or in simple mixture 10.
A fourth method must be cited, though it was not experienced in this work, because it represents the state-of-the art in gamma-ray spectroscopy. It is based on High Purity Germanium (HPGe) detectors and can give excellent gamma signal resolution in the whole spectral window, even for energies as low as 3 keV, where NaI(Tl) detectors cannot usefully work and gives a resolution 16 times better than NaI(Tl). The major drawback of germanium detectors is that they must be cooled to liquid nitrogen temperature to produce spectroscopic data. An HPGe system is more complex to manage and on average is priced five to ten times as much as a NaI(Tl) system.
The radon issue
The Radon is a ubiquitous gas, mainly derived from the natural U-238 decay chain.
Radon isotopes emit alpha particles but some radionuclides from Radon’s progeny (Pb-214, Bi-214) emit gamma rays and can add their signals to the spectrum of a sample. To address this problem an independent Radon sensor was adopted to estimate the radon concentration during the analyses by the NaI(Tl) system.
The sensor adopted is the Rstone by Rsens. It can be connected to a computer by a proprietary USB pen. A proprietary program can read and analyze the data stored in the sensor’s memory. The sensor itself runs on a battery whose charge can guarantee up to two weeks of continuous autonomy and monitoring, and has a display to check the current Radon concentration measured during the last 30′.
The Background management
With the “RadioactivityCounter” app running on a smartphone, the sensor noise and the background emission can be measured and stored in the memory, and can be subtracted from each sample measure. Measures are expressed in CPM and saved as total and by-minute counts, together with the sensor temperature (that can affect the measure).
No background compensation is provided by the PRD-100 Geiger counter and by the corresponding Marie PRO PRD-100 app running on a smartphone connected to the instrument. The counting is only instantaneous.
The NaI(Tl) gamma spectroscopy systems allow full control of the background.
The instrument is protected by a lead shield that effectively prevents the variable environmental background radiation from hitting the sensor. The shield itself is a source of radiation mainly from U-238, and Th-232 decay series; anyway this radiation is constant (except for the environmental radon contribution) and can be measured and subtracted with high reliability and precision, acquiring “blank” spectra periodically. The K-40 internal standard can also be included in the background. Therefore a spectrum of the background and of the internal standard was acquired for 963933 s, checking for its stability (on the Energy axis) and saving the result every 1800 s. The stability was assessed by continuously keeping the laboratory temperature as close as possible to 295K and monitoring the stabilizer of the instrument, locked to the K-40 peak: if some adjustment occurred, then the corresponding 1800 s set of data were discarded. This way, the centroid of the photopeak of the K-40 at 1461 keV was always kept corresponding to the channel 552.20+/- 0.20.
The Calibration of the NaI(Tl) system
The spectrum described above, was used either for the background subtraction or for the first calibration step 11 and all the following spectra were acquired with the constraint of the K-40 centroid corresponding to channel 552.20 +/-0.20.
The energy calibration of the NaI(Tl) system was done in several steps. For a first energy calibration the K-40 peak (4518 Bq) was considered with some clearly recognizable peak of the background: the Tl-208 peak at 2614 keV, near the high energy end of the spectral window , from the Th-232 decay chain, which is widely used as a gamma tracer of natural thorium 12,13 and the Bi-214 peak at 1765 keV which is widely used as a gamma tracer of natural uranium 12,13.
During the second step the energy calibration was refined by considering, from the same background spectrum, the Ac-228 peak at 969 keV, the Tl-208 peak at 511 keV and the Pb-212 at 239 keV from the Th-232 decay chain.
For the final energy calibration steps, three reference sources were chosen and their corresponding spectra were acquired: Ba-133 (53 and 81 keV peaks), Cd-109 (88 keV peak) and Cs-137 (662 keV peak). The spectrum of each source was acquired separately, for 66691 s (Ba-133 and K-40), for 14189 s (Cd-109 and K-40) and for 81453 s (Cs-137 and K-40). The three point sources were acquired without any correction for the geometry, at 75mm from the detector surface, to lower the intensity of their signals and make it possible for the stabilizer to work properly.
The final calibration is reported below, where “Channel” is the integer index of the channel ranging from 0 to 1023:
Energy = -7.7883 +2.568091*Channel +0.000165948*Channel2
The full width at half maximum (FWHM) was calibrated as a linear function of energy:
FWHM = 4.8213 +0.038887*Channel
The Efficiency was factory-calibrated.
The test of smartphone sensitivity
The rear (main) camera of each smartphone was shielded from light using a piece of aluminium foil. The “Radiation Counter” app was loaded and launched and the shielding effectiveness was verified by assessing that the background remained unchanged also putting the shielded lens near a strong light lamp. The activity of the Na-22, Zn-65 and Cs-137 sources were measured putting them at 75, 30, 15, 5, 0 mm from the lens’ surface of the rear camera of each smartphone for more than 1200 s.
The Background was checked by putting the radioactive sources at a distance greater than 4m.
The same protocol was followed with the Geiger counter, referring the distances listed above to the instrument surface that directly covered the Geiger-Müller tube.
Results
In the laboratory where the NaI(Tl) spectrometer works and where the radiation counters were tested, the radon concentration varied between 20 and 60 Bq/m3 during the testing periods and at this level did not require any special attention. The main environmental problem was to keep the temperature stable to have the NaI(Tl) spectrometer stable as well.
Only the strongest radioactive reference source (Na-22) could induce a response that was clearly different from the background in all the counters, smartphones included, as reported in Fig. 1 and in Tab. 1. Figure 1 and Table 1 show graphically (Fig 1) and in tabular format (Tab. 1) the measures obtained from each counter, at different distances from the Na-22 reference source.
The Graph shows the Counts Per Minute (CPM) of the four tested radiation counters and of the NaI(Tl) spectrometer, put at different distances from Na-22 reference source of gamma rays. The numerical values are reported in Tab. 1.
Fig. 1: Graph showing the relationship between counts and distance, for each counter, from the Na-22 reference source.
Table 1: The Table shows the output, expressed in CPM (Counts Per Minute) of the tested radiation counters and of the tested NaI(Tl) spectrometer, put at different distances from three different reference sources of gamma rays. For the NaI(Tl) spectrometer, the counts from the whole spectral windows were considered and the output adjusted for the half-life of the nuclides and for the different acquisition date.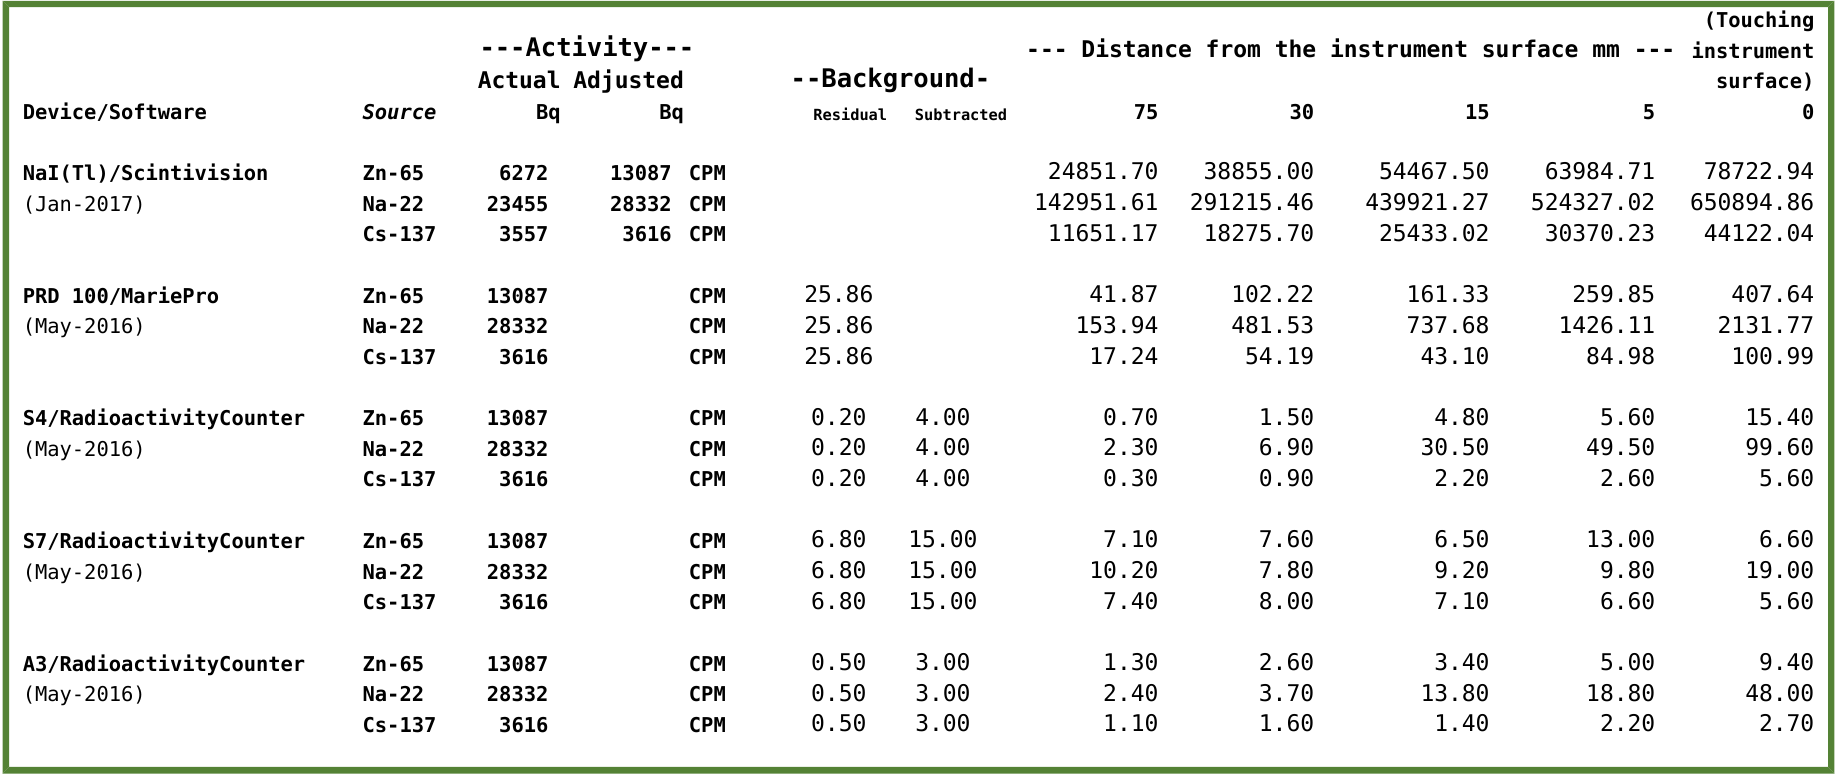
The NaI(Tl) sensor showed a very different sensitivity.
For the sake of comparison, the photo-peak of the reference source of Cs-137 (3700 Bq), put on the surface of the NaI(Tl) sensor (18200 mm2) gave a count of 1.31*104 CPM and was “viewed” by the spectrometer as a 1L sample containing 7262 Bq/kg of Cs-137 (Fig. 2). This kind of instrument easily recognizes contents as low as the Tl-208 of the background, “viewed” as a concentration of 19.4 Bq/kg and whose photo-peak area corresponds to 6.60*10-2 CPM (Fig. 2).
Output of the NaI(Tl) Gamma-ray spectrometer. The point source of Cs-137 (t1⁄2 = 30 year, 3.7×10³ Bq on Apr 2015, photo-peak 662 keV) was placed on the sensor surface. Also the photo-peaks at 2614 keV (Tl-208 from the Lead shield) and at 1461 keV (K-40 internal standard) can be clearly observed.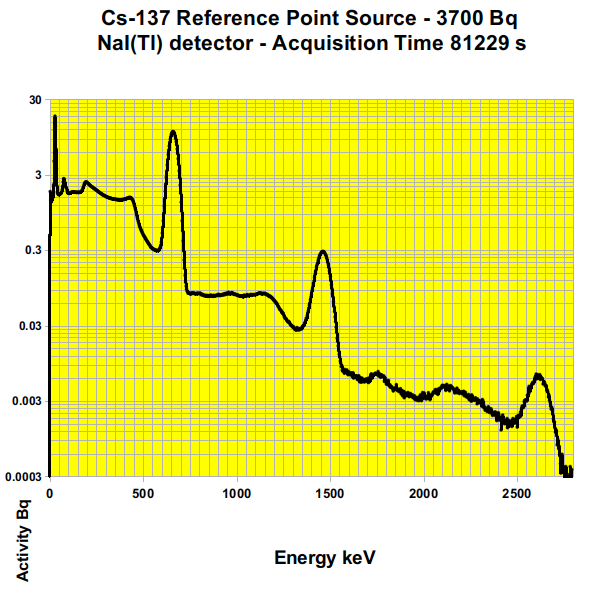
Fig. 2: Gamma-ray spectrum of the Cs-137 reference source
The same reference source of Cs-137 (Fig 3 and Tab. 1) was not sensed by the S7 and was hardly sensed by the A3 and only within a distance equal or less than 5 mm. Only the S4 performed reliably.
The Graph shows the Counts Per Minute (CPM) of the four tested radiation counters and of the NaI(Tl) spectrometer, placed at different distances from Cs-137 reference source of gamma rays. The numerical values are reported in Tab. 1.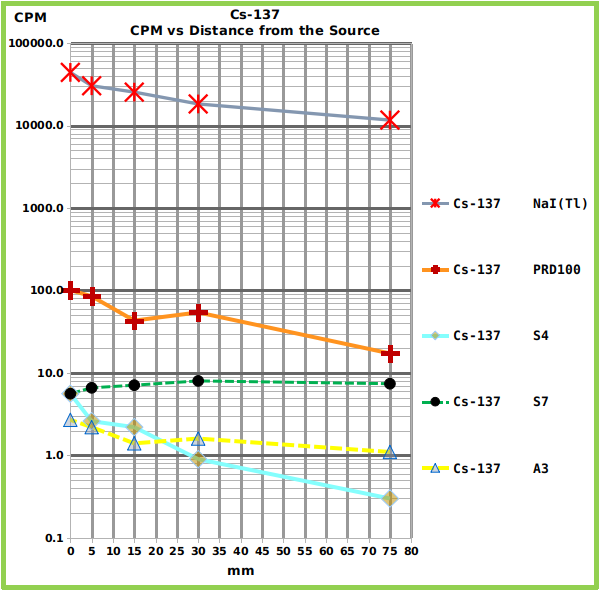
Fig. 3: Graph showing the relationship between counts and distance, for each counter, from the Cs-137 reference source.
The Zn-65 reference source (Fig. 4 and Tab. 1) showed intermediate counts between the strongest (Na-22) and the weakest source (Cs-137).
The Graph shows the Counts Per Minute (CPM) of the four tested radiation counters and of the NaI(Tl) spectrometer, placed at different distances from Zn-65 reference source of gamma rays. The numerical values are reported in Tab. 1.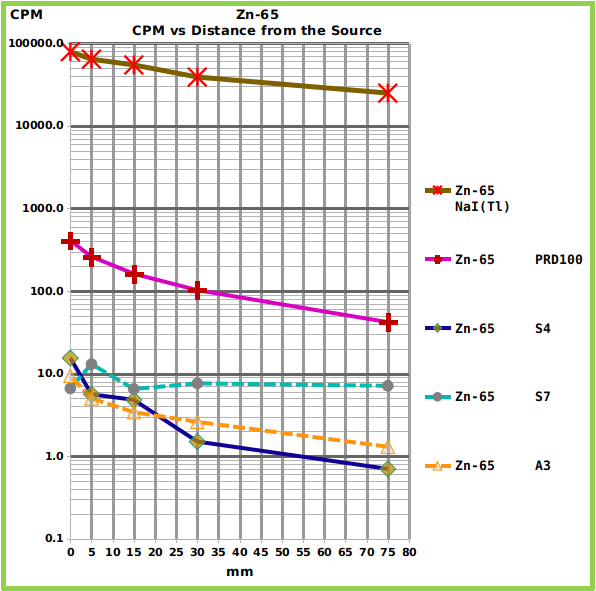
Fig. 4: Graph showing the relationship between counts and distance, for each counter, from the Zn-65 reference source.
The three smartphones performed very differently. The most recent one (Samsung S7), which is equipped with the most advanced (and small) sensor showed too much background thermal noise and was not able to sense the reference sources (Fig. 5 and Tab. 1) , except for the strongest (Na-22) at the minimum distance. On the other hand, only the S7, running under Android 6 (the A3 and the S4 runs under Android 5) showed no problem with file saving.
The Graph shows the Counts Per Minute (CPM) of the three tested radiation sources placed at different distances from the S7 surface. The numerical values are reported in Tab. 1. The residual background level is also reported.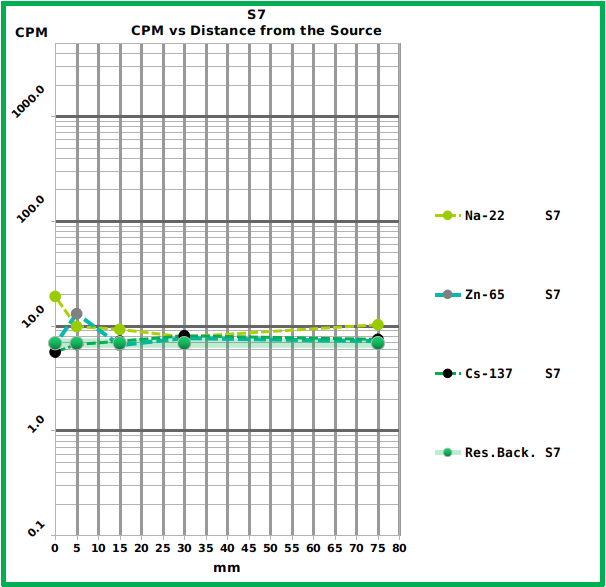
Fig. 5: Graph showing the response of the S7 smartphone to the different reference sources at the different distances.
Among the tested smartphones the most reliable was the S4 which showed a good sensitivity and whose counts followed the expected trend (Fig. 6 and Tab. 1). The A3 showed less sensitivity and performed worse (Fig. 7 and Tab. 1).
The Graph shows the Counts Per Minute (CPM) of the three tested radiation sources placed at different distances from the S4 surface. The numerical values are reported in Tab. 1. The residual background level is also reported.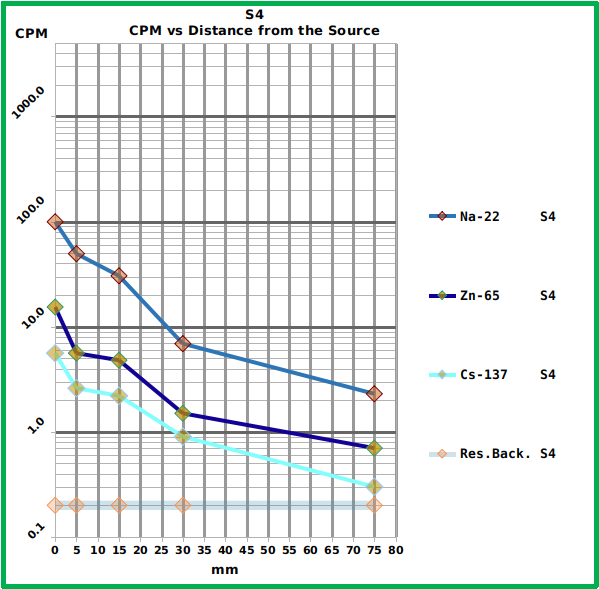
Fig. 6: Graph showing the response of the S4 smartphone to the different reference sources at the different distances.
The Graph shows the Counts Per Minute (CPM) of the three tested radiation sources placed at different distances from the A3 surface. The numerical values are reported in Tab. 1. The residual background level is also reported.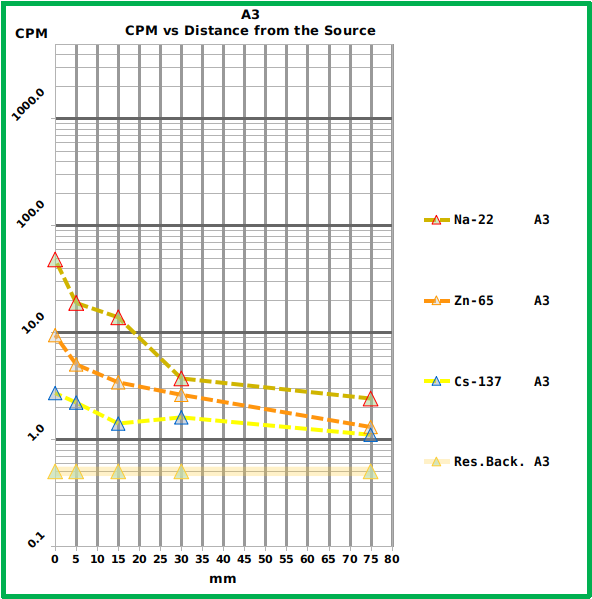
Fig. 7: Graph showing the response of the A3 smartphone to the different reference sources at the different distances.
The Geiger counter PRD100 (Fig. 8 and Tab. 1) showed a much higher (one order of magnitude) sensitivity of the best performing smartphone (S4) but the software running on the connected smartphone lacks some useful feature which is present in the “RadiationCounter” app. (that is to say data-saving in CSV standard format, a count every 60 s, temperature and battery status and, for each measuring session, total duration, background, noise related to the border of the sensor). Furthermore the app allows real-time background subtraction, 60 s to 1800 s means and general mean calculation.
The Graph shows the Counts Per Minute (CPM) of the three tested radiation sources placed at different distances from the PRD100 surface. The numerical values are reported in Tab. 1. The residual background level is also reported.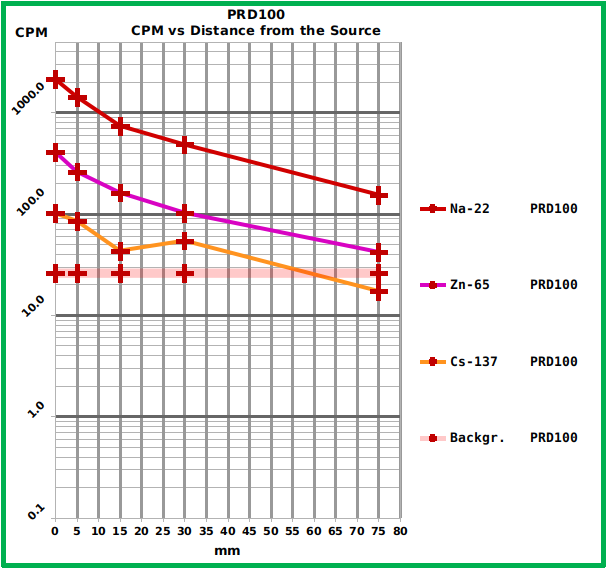
Fig. 8: Graph showing the response of the PRD100 Geiger counter to the different reference sources at the different distances.
The NaI(Tl) spectrometer showed (as expected) the best sensitivity (Fig. 9 and Tab. 1) and the highest reliability with the best background management.
The Graph shows the Counts Per Minute (CPM) of the three tested radiation sources put at different distances from the surface of the sensor of the NaI(Tl) gamma spectrometer. The total counts from the whole spectral window are considered to allow a proper comparison with the other devices. The numerical values are reported in Tab. 1. The background is not reported here because it depends on the K-40 internal standard and on the lead shield, not on the external environment and it can be evaluated observing the spectrum reported in Fig. 2.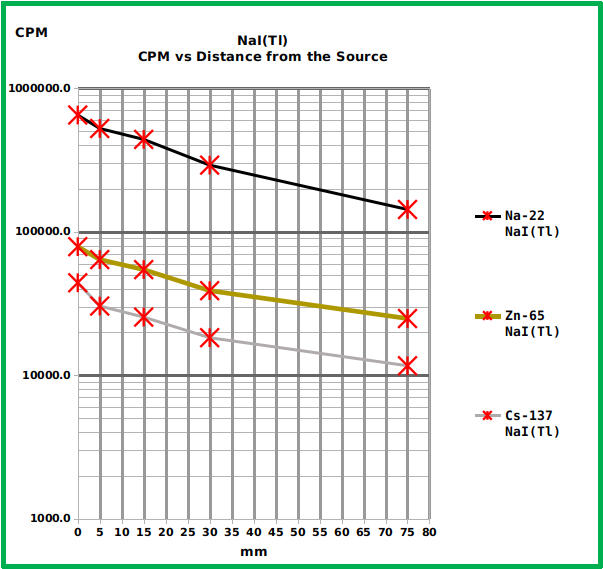
Fig. 9: Graph showing the response of the NaI(Tl) spectrometer to the different reference sources at the different distances.
Discussion
The current smartphone technology could open up to a massive radiation monitoring, with some limitations due to low sensitivity, where the number of data could compensate for the possible lack of precision and puts in the hands of the average citizen a direct knowledge that previously only specialized entities could access.
Furthermore, the fact that anyone can check for the safety of the nearby environment leads to a new kind of bottom-up control of the information released by interested stake-holders and by the public authorities, allowing more transparent decision making.
According to the United Nations Scientific Committee on the Effects of Atomic Radiation (UNSCEAR) the worldwide average natural dose to humans is about 2.4 mSv/y (millisievert per year) 15.
On the other hand, the International Commission on Radiological Protection (ICRP) recommends effective dose limits to reduce the risk of stochastic effects to tolerable levels 16 for members of the general public in planned exposure situations and proposes as first reference level 1 mSv/y. The Commission considers also existing exposure situations that are defined as “those that already exist when a decision on control has to be taken” and explains that “there are many types of existing exposure situations that may cause exposures high enough to warrant radiological protective actions, or at least their consideration”. The Commission proposes the reference interval between 1 and 20 mSv/y for these conditions that can be due to NORM (Naturally Occurring Radioactive Material), natural background radiation and radioactive residues within the human habitat. The Commission defines also the levels between 20 mSv/y to 100 mSv/y as “reference levels for the highest planned residual doses in emergency situations”. Therefore according to UNSCEAR and ICRP, an annual dose ten times the “worldwide average natural dose to humans” is already an emergency.
According to our data, at least one of the tested smartphone (S4) is able to reliably distinguish between a residual background of 0.2 CPM and a tenfold greater gamma emission (Tab. 1 and Fig. 6). The cited background can be assumed to be near the average value, according to UNSCEAR’s definition and according to the information available on the geographic area where the tests were done: the alluvial plain of Florence-Prato-Pistoia 17,18. Therefore, in such conditions, the device could be used to detect an environmental radiation level that could signal a radiological emergency, according to ICRP’s definition 16. On the other hand, no real-time detection can be expected in low exposure conditions because to achieve the reported results, several minutes were needed for each measure and all the measured counts, except the S4 measure of the Na-22 put directly on the smartphone surface (99.6 CPM) are less than one count per second. If we consider that one count per second is equal to 60 CPM that in turn, in this case, corresponds to 300 times the residual background, then it can be concluded that only high levels of gamma activity can be detected in real-time by this kind of device and that the low sensitivity of the small sensor of a smartphone can be a serious drawback, that could be compensated only by the adoption of an external sensor. The low sensitivity would not be a problem in a severe radiological emergency, where the usefulness of many working detectors should be unquestionable and where almost everybody could become an active node in an environmental sensory network. In this scenario the value of the information collected can only be imagined.
Of course the huge amount of environmental data that could be produced and shared needs some public revision and lab validation, and here a sensitive, traditional and inexpensive technology like the NaI(Tl) spectrometry can have a new role, before the definite Hi-Res confirmation that only the HPGe technology can give.
Corresponding Author
Stefano Alessandri, Department of Statistics, Computer Science, Applications “Giuseppe Parenti”, University of Florence, Florence, Italy. Email: [email protected]
Data Availability
The data are freely available in figshare repository and can be accessed via the following links:
– Summary of smartphones, geiger counter and NaI(Tl) spectrometer dataset: https://doi.org/10.6084/m9.figshare.4555507.v1
– NaI(Tl) raw dataset: https://doi.org/10.6084/m9.figshare.4644997.v1
Competing Interests
The author has declared that no competing interests exist.
Objectives: This study was done to explain the life process of children who survived the earthquake of Manjil in northern side of Iran.
Methods: This qualitative study is based on the grounded theory approach. The sampling involved purposive interviews with 12 children who survived the Manjil earthquake and were under 12 years of age at the time of the earthquake. The initial interviews were followed by continuous comparative analysis, and thus the sampling process adopted a theoretical trend. In the end, by the formation of categories and the central variable of the study, interviews were conducted with 16 subjects and sufficient data was provided. Data was collected through face-to-face, in-depth interviews using an interview guide. In order to enrich the categories formed in data analysis, we had also 6 telephone interviews with the same participants in order to complete missed needed information. Data collection began in 2015 and continued up until 2016. Data was analysed using the Strauss-Corbin approach.
Results: The life process of children earthquake survivors consists of ‘unexpected encounter’, ‘transient relief activities’ and ‘long-lasting consequences’. The central variable of this study is ‘the dark shadow of pain and the light shadow of life expectancy’. The life experience of this group of children is immersed in painful memories and varies under different conditions.
Discussion and Conclusion: According to the results of this study, one of the factors affecting the lives of children earthquake survivors which could threaten their health is providing non-specific and transient services. Training relief staff to consider the specific needs of these children at the time of the rescue operation could contribute to improving their health level in various aspects. Considering the effective and comprehensive rehabilitation program in Disaster Management by policymakers can prevent permanent complications caused by earthquakes. Planning and taking action to identify misbehaviours in this group of children as well as raising public awareness, particularly for parents, on how to manage the outcomes of natural disasters are some of the most significant public health priorities. Providing public mental health services for parents and children who survive an earthquake helps to address potential psychological problems in this group of survivors.
]]>Background
The Manjil earthquake1 occurred on June 21, 1990 at 21 GMT near the town of Rudbar, in villages of Gilan Province and the northwest region of Zanjan Province, Tarom Olya located in the north-west of Iran. The Manjil earthquake caused great human and financial losses within a 100-kilometer radius of the epicentre. The earthquake occurred in Rudbar and Manjil was one of the largest and most destructive earthquakes in Iran in recent decades. The earthquake caused nearly 35,000 deaths and 60,000 injuries, and left more than 500,000 people homeless. In addition, 200,000 residential units were demolished, 60,000 of which were completely destroyed. Due to the landslides that occurred during the Manjil earthquake, villages were deeply buried. The initial damage caused by the Manjil earthquake was estimated to amount to more than 800 billion rials, and the disaster caused economic losses equal to 2.5 percent of the gross national product2.
Introduction
Published statistics of disasters around the world show that in the past two decades, more than 4.3 million people have died, millions of people have been injured and tens of billions of dollars have been spent on financial and life compensations due to natural disasters3. Due to the climatic and geographical situation of Iran, it is one the high-risk countries in terms of natural disasters4. Advances in emergency and injury care systems have caused survivors of natural disasters need wide physical, psychological and social recoveries5.
Among the survivors of the earthquakes, children are more vulnerable than other age groups due to the fact that they are exposed to distressing scenes of devastation. In addition, children survivors are especially vulnerable as their living situations immensely shift following an earthquake disaster. If the special needs of these victims do not receive urgent attention, the evolutionary process of their growth will undoubtedly be interrupted, and they will face serious physical and psychological effects in the near or distant future. Most planning programs emphasise the most immediate needs of disaster victims, including rescue and relief activities and primary care6.
However, it should be noted that in addition to the significant effects and damages associated with natural disasters, the impact of such disasters on victims’ quality of life is much deeper and severe. Therefore, it is crucial to improve the health of victims for prolonged periods after the disaster. Nevertheless, many of the studies conducted in this field have not taken a comprehensive look at this process, and have usually focused on only one aspect such as psychological interventions after disasters, post-disaster stress disorders7,8, physical injuries9, and the role of community participation in physical reconstruction10. Since few studies have specifically explained the lives of children who have survived natural disasters, this study seeks to investigate this particular group. Further, studying children survivors in this context is necessary due to the particular context and culture of Iranian society as it differs from other countries which is based on Islamic beliefs and traditional-local customs. Understanding the life process of these children may lead to effective outcomes and interventions, and explaining the life process of these children according to their experiences could lead to a better understanding of their needs, challenges, issues and problems following their experiences of natural disasters. Furthermore, such a study may reveal the challenges resulting from earthquakes, and may also provide results that are applicable to similar circumstances. Therefore, to address this gap in research, this study aims to explain the life process of children who have survived earthquakes.
Methods
This study was conducted using the grounded theory approach, a qualitative research method based on symbolic interactionism. This study examines the social processes in the context of human interactions11.
The sampling involved purposive interviews with 12 children who survived the Manjil earthquake and were under 12 years old at the time of the earthquake. The initial interviews were followed by continuous comparative analysis, and the sampling process therefore took a theoretical trend. Based on the formation of categories and the central variable of the study, interviews were conducted with 16 subjects, and sufficient data for ensuring about the data saturation was provided as a result. Data was collected through face-to-face, in-depth interviews using an interview guide In order to enrich the categories formed in data analysis, we had also 6 telephone interviews with the same participants in order to complete missed needed information. The interviews began with general questions and progressively involved more detailed questions regarding participants’ responsiveness. Questions included, ‘Can you tell me about your experiences after the earthquake?’ and ‘How was your life?’ Interviews were performed in a quiet atmosphere according to participants’ preferences, in locations such as their homes or in a park. According to the tolerance, willingness and environmental factors of participants, 22 interviews were conducted for this study. The duration of face-to-face interviews was 25 to 45 minutes, and telephone interviews lasted 15 to 20 minutes. Data collection started in 2015 and continued up to 2016.
Data Analysis
Data was analysed using the Strauss-Corbin approach11. According to this method, the current study respectively employed concept analysis (immediately after the first interview), context analysis, process analysis, and then combined and integrated the categories and proposed the basic theory (writing analytical stories and reviewing the reminders). The audio-recorded interviews were transcribed, and the typed texts were reviewed several times. Then, the texts were studied line-by-line and word-by-word, and a code was assigned to each key word or sentence. Similar codes were then put together in a category, and the primary classification of 598 codes was obtained. Constant comparison was used to determine the relationship between categories and search the underlying process of data. Then, the researcher integrated the categories using various diagrams to identify the central variable.
Trustworthiness
The authenticity of the data was examined using the four criteria of Guba and Lincoln12. The data collection took nine months using a combination of face-to-face interviews and telephone interviews. Results were confirmed through peer check and member check. Researchers contributed to the transferability of the data through in-depth descriptions and analysis. The sampling technique with maximum variation (the age at the time of the disaster, gender, losing parents in the disaster, occupation, education level and marital status) was also used, and this improved the suitability or transferability of findings. The researcher precisely recorded and reported on the research process to allow others to investigate the article.
Ethical Consideration
Permission for the study was obtained from the ethics committee of the University Of Medical Sciences Of Babol. Related departments were informed of the study objectives, and their written consent to participate in the study was obtained. The time and place of the interview was determined with the agreement of participants, who were assured of the confidentiality of all personal information and interviews as well as the anonymity of all documents related to the research. The results of the study were made available to the participants upon request. All moral standards relating to the use and publication of texts was observed. Permission to record participants’ voices was obtained. Only one of the researchers listened to the recordings. The recorded interviews did not include any personal identification information. Participants were informed that they could withdraw their information or remove themselves from the study altogether at any time.
Results
In this study, 16 individuals (adults at the time of the study) who were child survivors of the Manjil earthquake were interviewed (Table 1).
Table 1. Participants’ personal information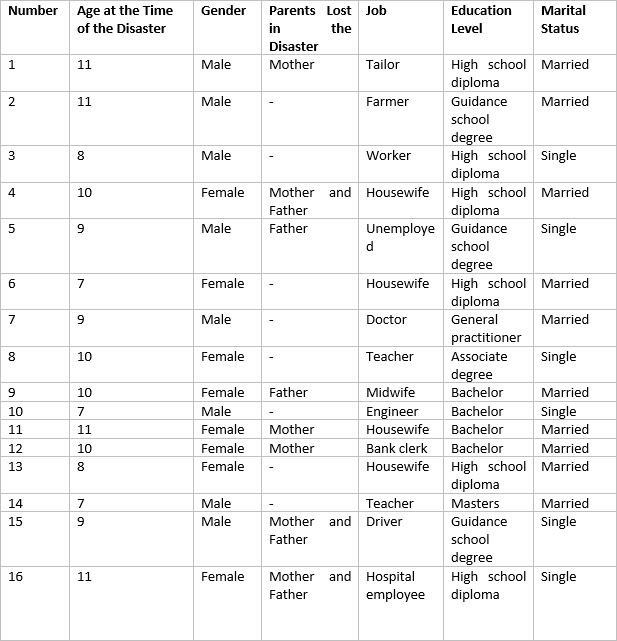
Analysis of the data resulted in the obtainment of 598 primary codes. During the process of data analysis, six main categories were extracted.
The life process of children survived earthquakes consists of ‘unexpected encounter’, ‘transient relief activities’ and ‘long-lasting consequences’. The central variable of this study is ‘the dark shadow of pain and the light shadow of life expectancy’. This process is influenced by ‘internal factors’ and ‘modifying factors’ (Table 2).
Table 2. Categories extracted from the data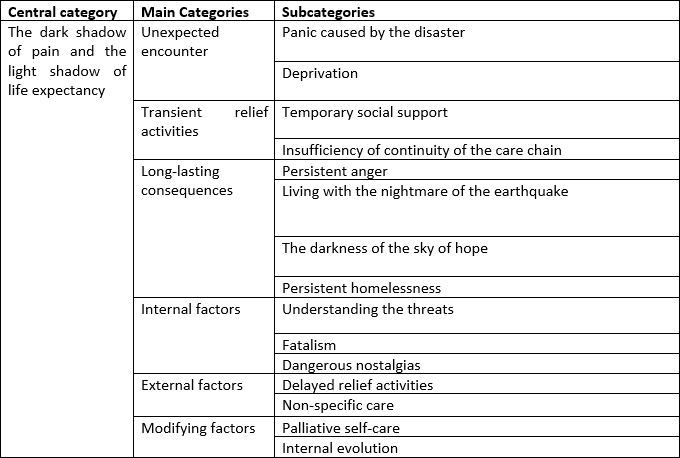
Unexpected Encounter
Most of these children were sleeping at the time of the earthquake. Therefore, the fact that they did not anticipate the earthquake or its consequences is associated with reactions of panic and feelings of deprivation.
Panic Caused by the Disaster
The first hours after the earthquake were associated with a great deal of fear, apprehension and horror for the majority of these children. These feelings multiplied when they were exposed to the resulting devastation, such as the destruction of shelters and scenes of family members being buried under the rubble, as well as being exposed to wounded and dead victims.
“The ongoing conditions were like the Resurrection. Destroyed and burnt houses, cracked roads, blood, broken bones, dead bodies along the road etc. Everything was a proof of the Resurrection. I was terrified when my uncle was burying his sister, nieces, nephews and other relatives.” (Code 16)
Deprivation
The deep influences of the disaster appeared a few days after the shock and horror of the earthquake. Most children either lost their parents, or their parents were mourning for the loss of their children or other family members. What were previously conceived of as the neighbourhood, kindergarten, school, family and relatives were no longer present. There was no sign of love or loving atmosphere in the family. Most family members were looking for a piece of bread to eat and shelter to live in, and were struggling with many mental pressures. Sometimes the needs of these children were forgotten due to the disastrous situation. Most of these children had no place to sleep and were looking for a clue of memories of good old days in the ruins. Those who had lost their parents and family members wandered around the ruins and cried, and were in search of a safe haven in a world of fear and helplessness. These children were tired, hungry and looking for a way out.
“The earthquake is nothing but the death of love. All my relatives were buried in front of my eyes, the sky of hope was dark and the pain of this separation grew bigger, and as I grew up, it grew up, too.” (Code 14)
Loneliness and the lack of social security in the initial chaos after the earthquake exposed children survivors to mistreatment. This group of survivors trusted people who were available in the tense and cluttered atmosphere, and exposed themselves to mistreatment. On the other hand, these children were neglected or mistreated due to the preoccupation of police, aid workers and family members who were involved in removing corpses and victims from under the rubble. In addition, some children faced threats such as robbery or getting lost in the process of being delivered to the authorities.
“I was crying in a street among the ruins in that confusion, and I saw a man coming towards me. He told me that he came to take me to my mother. As soon as he saw nobody was noticing, he took my bangle by force in such a way that my hand was wounded, he put his hand on my mouth so that I wouldn’t be able to shout and he threatened me.” (Code 13)
Transient Relief Activities
After some time and immediate support efforts, relief activities were provided to enable reconstruction and rehabilitation. However, these steps involved rebuilding houses and buildings, while the important principle of reviving the lives of these children faded out. This category contains the two subcategories of ‘temporary social support’ and ‘ insufficiency of continuity of the care chain’.
Temporary Social Support
What appears in the early hours following a disaster is the influx of government and relief aids to disaster-stricken areas. However, after a short period of time, emotions subside and the amount of aid decreases. This especially diminishes significantly as time goes on. In fact, disaster activities are only vaguely recalled.
“There were lots of people and aids during the first days. But very soon, after one month everything was over. It was [as though] as if the earthquake had involved people only for those days.” (Code 15)
The concept of ‘forgotten’ refers to temporary social support. Although these children require compassionate care, most of them receive humanitarian support for just a few months following a disaster and are gradually deprived of loving attention.
“Children who have survived earthquakes are highly vulnerable and can be emotionally injured by the smallest issues. They need love and a safe shelter more than anything else.” (Code 12)
Insufficiency of Continuity of the Care Chain
A few months after a disaster occurs, continuous care is halted and survivors face serious physical and mental consequences related to the event. The majority of physical and mental health care is limited to emergency and acute care, and rehabilitation services are omitted. The majority of children deal with several complications due to a lack of long-term care services management and planning. ‘Discontinuous follow-ups’ have caused most survivors to suffer from multiple chronic physical and mental problems.
“I was wounded when the earthquake occurred. My leg was stuck under the ruins of the house and was injured. They took me to the hospital and I was taken care of there, but after that they took me home. My parents couldn’t afford to spend money for me. Unfortunately, I limp. If somebody cared about us then and thought [about] what would happen next, I wouldn’t be like this.” (Code 18)
Long-lasting Consequences
Consequences of earthquakes are often delayed and persistent. This category consists of subcategories including ‘persistent anger’, ‘living in the nightmare of the earthquake’, ‘darkness of the sky of hope’ and ‘persistent homelessness’. The consequences of the earthquake proved to be of lower intensity for children who did not lose their parents in the earthquake and could benefit from their physical and mental protection.
Persistent anger
After the earthquake, the games and carelessness of childhood shift toward adult behaviours. ‘The repetitive scenario of the earthquake’ replaces game-playing and living a happy life. Teenagers also experience a shift in perception as they too experience undesirable physical, economic and social conditions. The majority of children survivors cannot enjoy their childhood years as their welfare, physical condition and psychological capacity are lacking in the wake of a disaster. Therefore, this group of survivors refers to their adolescence as ‘unloaded clusters’ The continuous use of wording such as ‘sorrowful dialogues’ or ‘tragedies’ describe the significance of sad memories of the past experienced in their minds and souls. Their spirit is obscured by these dialogues, and these survivors live with the daily repetition of parts of their painful past and memories of the earthquake. Further, these survivors attempt to pay homage to their family members, classmates and friends by keeping their memorabilia. In other words, they consider forgetting the event as a source of guilt and disloyalty.
“At the time I should have been supported by my family, I was taken to an orphanage. As I grew up, I had to leave my friends and move to another place. These changes made me suffer. I didn’t understand how my teenage years passed.” (Code 4)
Living in the Nightmare of the Earthquake
One of the long-lasting and negative consequences for this group is living in the nightmare of the earthquake. The fear of the earthquake’s recurrence along with continuous insecurity and anxiety are always present. Most of these survivors are deprived of a normal life. Participants expressed that they live in fear not just of the earthquake’s recurrence, but also of other disasters occurring. This fear leads them to experience anxiety. Living with prolonged and continuous anxiety leads to conditions such as depression, psychiatric disorders such as drug abuse, and behavioural problems such as delinquency. Living in the nightmare of the earthquake causes ‘excessive sensitivity’ to others, especially family members. Such behaviours of risk aversion cause these people to draw on their memories of the earthquake and, as a result, deter family members from what they perceive to be possible hazards. This problem is associated with fear, and limits the social lives of victims and their family members. In turn, this brings about dysfunction in the relationships between victims and their family members.
“I’ve grown up and aged, but you know, I start shaking even when it’s windy. I go and sit in a corner of the room, hug my baby and get terrified. That fear is still with me.” (Code 11)
The Feeling of Hopelessness
Some of these survivors believe that the feelings of safety and health have disappeared in their lives and have been substituted by fear, uncertainty and loneliness. They reported that after the earthquake, they feel they have lost their direction in life and have lost all hope. They experience a life without financial and emotional support. Their lives have undergone many major changes, and the grief of losing family members and experience of permanent fear have replaced their normal routine of life. Those who have medical problems and severe physical complications caused by the earthquake are exposed to constant medical procedures and treatment recommendations.
“I was young at that time. Our financial situation wasn’t so bad. But suddenly, we lost everything. My father died hopelessly after a few years. I had to work in a factory. It was very hard. I had to work instead of study.” (Code 13)
The ‘guilt’ the respondents feel as the sole survivor, as well as the guilt associated with burying their loved ones, is a significant factor contributing to their feelings of despair. Most of them saw their family members stuck under the rubble and reported that they feel guilty because they could not rescue them.
“I suffered for a long time. I wished it wasn’t me but my parents who were alive. I was little and injured then. I was confused and frightened, and I couldn’t do anything for my family. It hurts me a lot.” (Code 4)
For this group of survivors, disappointment leads to a lack of desire and effort in social activities. Thus, they always feel that they are a ‘social burden’. Lack of adequate physical and academic qualifications for acquiring a job affects this process. Most of these individuals are not married and live with their relatives because they have lost their families. This problem enables the formation of the feeling of being a social burden.
“I went my uncle’s house in another city. That poor man had some children and didn’t have a good financial situation. He was a farmer. I was a burden to their family. I sometimes realised that they couldn’t help doing favours for me, but I also understood that they couldn’t afford to provide for their own children.” (Code 16)
Disappointment causes this group of survivors to refer to their current life situation as ‘bubbles on the water’ (they always think that everything is temporary and is not going to last long like a bubble), and keeps them from envisioning a future for themselves. They feel abandoned because their identity has been buried under the rubble of grief and misery. The missing future is represented in impairment, inability to support family expenses, lack of financial resources for marriage, losing parents and their emotional and financial support. In fact, these individuals believe that they feel they are not in control of their destiny or have failed to fulfill their destinies. The fear of a life without financial resources and family support is always with them.
“A long time ago, I realised that I lost everything in the earthquake. I have neither a good job nor money. I try more and more, but I am always on the first step.” (Code 2)
Persistent Homelessness
A few days after the earthquake, some children who lost their parents and did not have anybody to claim them were taken to children care centres. In their opinion, wandering in these centres and waiting to find a safe haven was the worst experience of their lives. They described the separation from family members, relatives, friends and their hometown in a very bitter manner. Some survivors were given to new families and thus faced many new problems. Orphans who were sent to welfare centres or new families grew up in educational systems that differed from their native culture. Sometimes, this way of life proved contrary to these survivors’ previous beliefs and life experiences, and thus led to behavioural and mood disorders. According to survivors, sympathy was the major factor in their acceptance to these new families or centres. However, over time, many children survivors once again experienced homelessness due to behavioural disorders and adversities.
On the other hand, the lack of necessary physical and mental conditions for adoption led some of these children to stay in care centres for a long time. Further, such conditions at times caused them to wander between different centres as they grew older or their physical or mental complications increased. Children without guardians were taken to welfare centres. There was also a significant difference between genders in child adoption such that most boys were adopted in a short time while girls spent a long time on the waiting list.
“I stayed in the nursery for a long time. Those who were with me were adopted by their relatives or new families. I was sick, I think that’s the reason.” (Code 15)
An important point revealed through data analysis was that some of the parents of children survivors were noted as ‘risky parents’. These parents pose risk factors in the physical, mental, moral and social development of their children due to the loss of their own parents or other children, or due to multiple physical injuries caused by the earthquake. These people cannot provide a safe haven for their children to live. Escape, isolation, and anxiety are just some of the outcomes and emotional experiences of children living with risky parents.
“At first, my father was too nervous because he had lost all his money and two of his brothers in the earthquake. He was usually bad-tempered to me. I remember that he hit me and my mother for small excuses. I grew up in that difficult situation and its result was that I couldn’t study at school. I always started fights at school. Now I am unemployed.” (Code 5)
Internal Factors
The internal factors affecting the life process of children who survived the earthquake are ‘understanding threats’, ‘fatalism’ and ‘dangerous nostalgias’.
Understanding Threats
For children earthquake survivors, facing stressful events, experiencing failures in family and social life, and emotional and educational breakdowns over the course of their lives cause them to feel threatened. The intensity of the feeling of threat shifts according to the context of each individual’s condition. Thus, the intensity and type of stressors influence the intensity of the feeling of being threatened. Feeling threatened affects these survivors’ performance in rebuilding their lives after the earthquake.
“I feel so impatient. Once I was supposed to marry a girl but she left me, I experienced a feeling exactly like which I experienced at the time of earthquake. I reviewed all of my miseries. I felt lonely and threatened very much. I was depressed and devastated for some days.” (Code 15)
Fatalism
Believing in fate and luck are personal factors affecting the life process of these children. According to participants, feeling unlucky suppresses the opportunity to build personal, family and social dimensions of life. It can also cause depression, isolation and social isolation.
“If I was lucky, why should I have been so miserable from childhood? Whatever I do, my bad luck and a part which has been already written in my destiny is with me.” (Code 5)
Dangerous Nostalgias
Internal factors which affect the life process of these survivors include breaks in time and retrieving memories of the earthquake when facing similar scenes or events.
“One day, a motorbike had an accident with a car in the street. The motorbike rider’s leg was stuck under the car’s tire. As I saw this scene, I remembered my mum, her leg was stuck under the rubble of our house. The motorbike rider’s shouts reminded me of stressful scenes and my mum’s shouts. I felt so bad. I cried for many days.” (Code 13)
External Factors
‘Delayed relief activities’ and ‘non-specific care’ are external factors which affect the life process of children who survived the Manjil earthquake.
Delayed Relief Activities
A remarkable finding in the data is that often, treatment measures are delayed due to children’s inability in expressing their immediate needs. This problem is worse in children with injured parents or for those who have lost their parents. Parents help aid groups in considering their children’s needs with the knowledge they have about their psychological characteristics or physical problems. Delayed diagnosis or treatment of different problems of these survivors could have serious and persistent consequences for them.
“I was there when they took a 7-year-old child to the hospital. The child cried and couldn’t answer them when they asked questions. Nurses didn’t even know what medicine the child was allergic to. I remember the doctor gave the child a medicine. The poor child was shocked immediately and died, and it was too painful for me. If they hadn’t given the drug, the child wouldn’t have been dead.” (Code 10)
Non-Specific Care
Health care is not often provided to alleviate the physical and mental needs of children who have survived an earthquake. This reduces the quantity and quality of services. Most attention is focused on mere physical needs, and the mental and emotional needs of these children are neglected. In the area of physical health care, aid workers forget some children, or at times offer them defective or delayed care due to their lack of knowledge of specific care for children.
“They took me to the hospital. I heard two doctors saying that if the aid workers had paid more attention or been trained, they wouldn’t have cut a woman’s leg who was on a bed next to me.” (Code 5)
Modifying Factors
‘Palliative self-care’ and ‘Internal evolution’ are modifying factors in the life process of children who survived the earthquake.
Palliative Self-Care
The lack of long-term social and family services leads to self-action to have a safe and normal social and family life. Children seek different strategies to rebuild various aspects of their lives during different life stages. This category consists of three subcategories including ‘rescue efforts’, ‘religious strategies’ and ‘resilience’.
Rescue Effort
The development of social communications, starting a family, having children and maintaining emotional ties are some of the strategies used by children in rebuilding their lives after earthquake. On the other hand, being optimistic in life, strengthening the ability of forgiveness, being involved in charity works, and public participation have calmed these people. According to participants, empathy is formed in peer groups because of their common pain. By developing social relationships, these people look for those who can be understood easily by them due to the common experience they share. Sharing memories of childhood and using coping strategies proposed in these groups improves their mental relaxation.
“At the moment, I am a stepmother of three orphans. I don’t have money, but this makes me feel good. My sister was six when she died, and I was 7 [at the time of earthquake]. I do it to make her happy.” (Code 6)
Some of the earthquake survivors who are capable of continuing their education attempt to help others by studying. Some even try to make their bereaved or dead parents happy.
“I tried to be a doctor. Any patient who is visited by me to me and doesn’t have money, I don’t charge him. I cooperate with the Red Cross voluntarily. If my family had gotten treatments in time, they would have been alive right now. I became a doctor to help my people if necessary.” (Code 7)
Religious Strategies
One of the strategies for dealing with the persistent crisis of an earthquake is resorting to religious beliefs. Strengthening religious beliefs by reading prayer books and such religious texts as the Quran, participation in religious ceremonies and saying prayers are some of the religious strategies reportedly used by those who survived the earthquake in order to cope with multiple physical, mental and social problems. On the other hand, fatalism and ‘submission to the will of God’ help these children deal with problems after the earthquake.
“As I grew up, I realised that God is the only refuge. Whenever I have problem I say prayers instead of crying and sadness. These beliefs help me out of all pains.” (Code 1)
Resilience
Resilience is one of the other strategies that children who survived the earthquake use in the process of rebuilding their lives. Resiliency is the result of a shift from being risk-oriented to coping with and modifying stress factors, which leads to the preservation and promotion of health in many aspects. Patience and perseverance, improving self-confidence, seeking familial and social support, and optional forgetfulness are some aspects of resiliency. These earthquake survivors often try to forget what happened in the past through emotional suppression.
“Whenever I give up, I go to my friends and family. My mother understands me very well. She knows how much I was hurt then because I was a kid. I unburden myself [in] this way, and I have withstood many times [through] the help of her.” (Code 8)
Internal Evolution
Internal evolution refers to self-monitoring and positive psychological changes related to the earthquake. Self-monitoring and knowing oneself, others and God are some of the reported positive consequences of the earthquake. These respondents believe that knowing themselves and God gives them the power to deal with the chaos and emotional gaps caused by the earthquake.
“The earthquake was a very bitter memory. But it built me. It made me resistant. It made me appreciate people. It made me more patient. It made me experience things which were productive. When I wonder, I think that it taught me that such moments won’t happen again. I knew my abilities and myself. These made me successful.” (Code 7)
Discussion
According to the findings of this study, the first step in the lives of children who have survived the Manjil earthquake involves the unexpected encounter with the disaster. King (2006) believed immediately after the incident, the children experienced different reactions of shock and horror. These emotional reactions include a range of physiological, psychological, social and behavioural reactions13. More than other age groups, children are more prone to distress when faced with an earthquake disaster14. The results this study showed that in the early ravages caused by the earthquake, the loss of parents and shelter may have put the children at risk of harm and mistreatment. Therefore proper planning in crisis management, paying attention to the characteristics and needs of vulnerable groups including children, and comprehensive support can reduce the risk of mistreatment15. Based on the results of this study, there is a need for plans to provide long-term services.
It is important to note that threatening factors are persistent due to the long-term and sometimes permanent effects of earthquake disasters, and children are in great need of care at all stages of their lives. Unfortunately, rehabilitation and long-term services are marginal in disaster management planning16. Under these circumstances, there is a significant increase in mortality and a notable decrease in the physical, psychological and social function of these children17. Even if these services exist in society, they do not cover all survivors due to their unavailability and young age. Therefore, providing and sustaining long-term rehabilitation services must be considered as priorities when it comes to children survivors of natural disasters18.
The results this study also indicated that temporary social support and the subsided emotions of people and charities over time cause survivors to be deprived of support services, especially long-term emotional support. According to this group of survivors, after almost 24 years, the disaster has been forgotten and has disappeared from people’s minds. Bolton et al ( 2000) believed this is associated with the lack of understanding by people, especially non-peers19. Concealing the feelings of others and social isolation are some of the strategies that this group of survivors may use to face such reactions20.
Further, this study’s results showed that children whose other relatives are given custody and children who are adopted have the most problems. Since relatives are given priority in adopting a child, in most cases the economic status, emotional situation and social health of these families are not considered before the adoption. The new family members cannot provide a safe haven for these children because they are in crisis and are suffering from many financial, physical and mental problems. These children may experience violence, misbehaviour and secondary displacement in new families21. In such circumstances, these children feel that they are a burden, and experience a lack of opportunity in education, marriage, or suitable occupations22.
Regarding the fact that many of the participants of the present study have lost one or both of their parents in the earthquake, and given that some live with family members in an environment which is not physically, mentally and emotionally stable, most of these survivors face severe emotional issues as their future relationships are threatened. The results of McDermott’s (2005) study showed that distrust of friendly and effective communication with others on one hand and emotional gaps on the other can all cause behavioural and emotional conflicts, and can bring about short-term emotional and social communication issues23.
Failures in communication and constructive attachments cause these child survivors to experience failure in marriage and family life24. Therefore, comprehensive services such as counselling, health care and welfare services are necessary25. This study’s findings also showed that sometimes, parents do not succeed in their parental roles in supporting their children due to the distress they experience as a result of the earthquake. In such cases, these parents in turn can pose a risk to their own children. The results of Gertrud’s (2004) study showed that parents who were themselves severely impacted by disaster reported a reduced ability to assess their children’s reactions, and thereby were unable to provide optimal care2. Interestingly, these parents’ support strategies mirrored the early intervention recommendations put forward in the psychological first-aid guidelines which is a well-accepted and promising practice for helping children after disasters2. In the present study, mental nostalgia is one of the internal factors affecting the lives of those who survived the earthquake as children. These people retrieve memories when they face scenes that they consider as similar to events at the time of the earthquake. Hafstad et al (2004) believed nostalgia of past memories threatens their mental and emotional health during different stages of their lives2.
Believing in bad luck is another internal factor affecting the lives of those who were children earthquake survivors. Similar studies have shown that these beliefs can suppress a person’s effort in coping with stressful atmospheres, and can keep individuals from trying to improve their family and social lives22. Believing in bad luck can also deter this group of people from pursuing their previous dreams and wishes, as well as from social communication26. As the data in this study showed, one of the factors causing threats to the health of these children survivors is non-specific care. It should be noted that ignoring the needs of these survivors, considering the services superficially and providing those services temporarily may threaten their health in various aspects27.
In order to prevent more permanent damages to child survivors, we have to train individuals, aid workers and volunteers to bring up people from under the rubble correctly, identify specific needs of children survivors, and further care provisions28. Participants in this study have tried to resort to strategies such as the development of social communication, spirituality, and psychological strengthening to maintain stability and balance in their individual, family and social lives. In fact, other studies have emphasised religious beliefs as a facilitator of these survivors’ life processes29. Developing social relationships and friendships help improve the quality of survivors’ lives30.
Conclusion
According to the results of the present study, providing non-specific and temporary services is one of the factors affecting the life processes of children who have survived the Manjil earthquake. Training aid workers to consider the specific needs of children at the time of rescue operations could contribute to improving the health of this group in different aspects. Considering effective and comprehensive rehabilitation programs in Disaster Management policymaking can prevent persistent complications caused by earthquakes and other natural disasters. The results of this study also showed that some of the factors threatening the health of children earthquake survivors include homelessness, living in care centres, and living with risky parents. Planning and taking action to identify misbehaviour in this group of children, as well as raising public awareness (particularly for parents) on how to manage a disaster, are public health priorities. Providing public counselling services to children survivors as well as their parents will help to solve the potential psychological problems that threaten the well-being of children survivors.
Further, this study showed that children have tried to use different strategies in the process of their lives to maintain and promote their personal and social life. Strengthening religious beliefs and encouraging children survivors to participate in social groups (especially peer groups) will help them to feel understood, safe and alleviated of many negative feelings resulting from their experience of a natural disaster.
Appendix A: Interview Guide Questions
1- Can you tell me about your experiences after the earthquake?
2- What happened to you at the moment the earthquake happened?
3- Please talk about the harms happened to you.
4- How do you describe the life after the earthquake?
5- What has helped you to deal with the earthquake?
6- What does earthquake mean to you?
7- How was your life?
8- Would you please review a day of your life?
9- Which factors have helped you at the moment of the earthquake or after that?
Limitation
Among the limitations of this study, restrictions in generalization of the results can be mentioned. As interview method was used for data collection, the veracity of the interviewees might have affected the results. Therefore, conducting more studies focusing on triangulation methods is suggested.
Corresponding Author
Dr Fatemeh Ghaffari. Email: [email protected]
Data Availability
All relevant data are within the paper.
Competing Interests
The authors have declared that no competing interests exist.
METHODS: Here, we quantified the carbon sequestration capabilities of two ornamental succulent plant species, Sedum dendroideum and Sedum rubrotinctum, which require low maintenance, and little or no irrigation. To obtain a detailed picture of these plants’ carbon sequestration capabilities, we measured carbon uptake on the Sedum plants by quantifying carbon dioxide exchange and fixation as organic acids, during the day and across the year, on a green roof located in Southern Mexico City.
RESULTS: The species displayed their typical CAM photosynthetic metabolism. Moreover, our quantification allowed us to conservatively estimate that a newly planted green roof of Sedum sequesters approximately 180,000,000 ppm of carbon dioxide per year in a green roof of 100 square meters in the short term.
DISCUSSION: The patterns of CAM and carbon dioxide sequestration were highly robust to the fluctuations of temperature and precipitation between seasons, and therefore we speculate that carbon sequestration would be comparable in any given year of a newly planted green roof. Older green roof would require regular trimming to mantain their carbon sink properties, but their carbon sequestration capabilities remain to be quantified. Nevertheless, we propose that Sedum green roofs can be part of the long-term solutions to mitigate the air pollution crisis in the Mexico City Metropolitan area, and other “megacities” with marked seasonal drought.
]]>Resumen
INTRODUCCIÓN: En los primeros meses del 2016, la Ciudad de México y su zona metropolitana conurbada ha experimentado una de las peores crisis de contaminación del aire de la última década, urgiendo a las autoridades a tomar medidas drásticas a corto plazo. A fin de proporcionar elementos para investigaciones de sostenibilidad a largo plazo quisimos dar a conocer nuestros resultados de monitoreo de captura de carbono por plantas de azoteas verdes. Estas azoteas son una forma de naturación a gran escala, que constituyen una alternativa para mitigar parcialmente el incremento de dióxido de carbono en las áreas urbanas.
MÉTODOS: Nosotros cuantificamos la capacidad de captura de carbono por dos especies de suculentas ornamentales, Sedum dendroideum y Sedum rubrotinctum, que requieren bajo mantenimiento y nula o poca irrigación. Para tener una idea detallada de la capacidad de captura, medimos el carbono tomado por las plantas durante el día por un año en plantas de Sedum localizadas en una azotea verde en el sur de la Ciudad de México.
RESULTADOS: Estas especies presentan el metabolismo fotosintético CAM. La cuantificación obtenida nos permite estimar que una azotea verde de Sedum de 100 m2 captura aproximadamente 1.8 x 10⁸ ppm de CO2 por año.
DISCUSIÓN: Los patrones de CAM y de captura de CO2 fueron bastante robustos a las fluctuaciones de temperature y precipitación estacionales, por lo cual especulamos que la captura de carbono sería similar en cualquier otro año de una azotea verde de reciente plantación. Azoteas de mayor edad requerirían podas regulares para mantener sus propiedades de captura de carbono, sin embargo, no se sabe qué capacidad pueden tener para capturar carbono. No obstante, proponemos que las azoteas verdes plantadas con Sedum son una parte de la solución a largo plazo para mitigar las crisis de contaminación del aire en la zona metropolitana de la Ciudad de México, y de las megaurbes con una marcada estación de sequía.
Author Contributions
MCO & JRS designed the project; MCO performed experiments; MCO and UR analyzed results; MCO & JRS provided materials and reagents to perform experiments; MCO & UR wrote the manuscript. MCO: orcid.org/0000-0001-6618-4920; UR: orcid.org/0000-0001-5088-2679
Corresponding Authors
MCO ([email protected]) and UR ([email protected])
Keywords
Plant physiology, Crassulacean Acid Metabolism, urban biology, megapolis, environmental crisis, plant urban physiology, Sedum dendroideum, Sedum rubrotinctum, air pollution, bioremediation
Competing Interests statement
The authors have declared that no competing interests exist.
Data Availability statement
Raw data available on doi:10.6084/m9.figshare.3395887
Introduction
Deforestation, urbanization and the intensive use of fossil fuels are some of the main causes of the increase of carbon dioxide (CO2) since the Industrial Revolution in the nineteenth century, contributing to the current changes in climate 1. These CO2 levels have gone from 280 ppm to 380 ppm, and it is estimated that levels could reach 770 ppm by the end of the twenty-first century 2. This dramatic increase in CO2 levels, particularly in urban regions, has caused a change in the global carbon cycles 2,3. Thus, vegetation plays a crucial role in urban ecosystems, by sequestering carbon excess, storing carbon as biomass, and releasing oxygen and water vapor through evapotranspiration. In recent decades urban ecosystems have drastically expanded and increased in complexity due to mass changes in economic activities, the migration of people from rural environments to cities 4, and widespread use of motorized vehicles. Unplanned growth of urban areas sometimes produces “megacities” where space becomes a luxury, and vegetation is often sacrificed to give way to urban infrastructure.
This is the case of Mexico City and its Metropolitan Area, otherwise known as Zona Metropolitana del Valle de México (ZMVM). This is the fourth most populated metropolis of the world and the largest in Latin America 5,6, with more than 20 million inhabitants according to a 2010 census (INEGI, https://www.inegi.org.mx). According to the Mexican Fifth National Communication to the United Nations on Climate Change, CO2 emissions increased 23.6 % from 1990 to 2010, coming mainly from fossil fuels, land use changes, and lack of silviculture. In the first third of 2016, the ZMVM is experiencing the worst environmental crisis of air quality of the last decade, demonstrating that short-term solutions implemented since the 1980s when the air quality became extremely critical, have been insufficient. In 2009, the Dirección de Reforestación Urbana, Parques y Ciclovías de la Secretaría de Medio Ambiente del Distrito Federal (today Mexico City), pointed out that poor metropolitan growth planning, deficient management of green areas, lack of legislation on urban vegetation, and poor conservation efforts, have all contributed to the deterioration of the green urban landscape, and their associated environmental and social benefits. In addition to better management of public green spaces, it is necessary to urgently reassess the strategies towards sequestering carbon and other air pollutants. To archive this, the mega-polis inhabitants must play an active role in tackling the challenge.
Besides reducing gas emissions from fossil-fuel combustion, in other cities the promotion of urban vegetation has been adopted as a method to eliminate pollutants and purify the air 7,8. Because of the scarcity of space in large cities, a strategy to increase the vegetation cover is through the implementation of what are known as green roofs, eco-roofs, living roofs, or roof gardens . Green roofs are defined as any rooftop covered by layers of roof coating, plant substrate, and vegetation 9. Green roofs have been associated with multiple environmental, ecological, health, and aesthetic benefits 3,9,10,11,12,13,14,15. Despite the relevance of green roofs as a potential solution to improve air quality in “megacities,” there is scarce experimental data in planta on the capabilities of green roofs to uptake CO2. Therefore, quantifying the green roofs’ capacity to sequester and retain CO2, pollutants, and other greenhouse gases is imperative under the current environmental crisis scenario, particularly in the ZMVM.
Currently there is robust evidence supporting the use of plants to capture air pollutants. However, we still need in planta qualifications on the role of green roofs to capture pollutants 16. NOx, SO2, PM10 and O3 are among the pollutants that have been quantified as sequestered by green roof vegetation 7,17,18,19. Experimentally, CO2 green roof-uptake quantification seems to be rather challenging, and mostly estimated using proxies, such as biomass accumulation 13,20, models of carbon-oxygen balance 21,22, macro-estimations of vegetation cover in large cities 7,13,23 or methods more appropriate for urban forests, rather than herbaceous plants 17.
In their studies measuring carbon uptake on green roofs, Li et al (2010) measured the CO2 uptake in a green roof, placing the IRGA within grass-shrubs and comparing it to a location outside the shrub, obtaining an average of 12.9 mg C m-3 per day 8. Ondoño et al (2016) estimated carbon and nitrogen uptake by quantifying the element composition on a green roof of weedy and grassy plants, obtaining 36.52 g C m-2 at the end of 9 months 24. Regarding Sedum green roofs, Getter et al (2009) quantified carbon storage in green roofs of several Sedum species, by measuring accumulated dry matter in the shoot, root, and soil, obtaining 160 g C m-2 during a two year period 13. More recently, Whittinghill et al (2014) measured carbon content and dry weight, and found that Sedum green roofs captured 1940 g C m-2 in a 14-month period and 3910 g C m-2 in a 12-month period 20. Overall, previous studies support the use of green roofs, and particularly, of highly resilient Sedum species to improve air quality conditions, in particular in overcrowded urban areas. However, we still lack data on the carbon uptake by Sedum plants, measuring CO2 exchange.
During the first months of 2016, the ZMVM has experienced one of the worst air quality crises since the 1980s. This has forced the local governments of Mexico City and surrounding States to implement extreme measures, such as emergency “No Driving Today Program”. However, these are often short-term and unsustainable solutions, because they promote for instance, the acquisition of a second car by the inhabitants of the ZMVM. In light of the current air pollution environmental crisis, we felt compelled to release our monitoring of carbon uptake in a green roof in Southern Mexico City, populated with low-maintenance, low irrigation-requirement, crassulacean species of Sedum. Our results show the potential of the Sedum green roofs as a self-sustainable solution. We hope these results help policy makers of the ZMVM and other urban areas with similar environmental conditions to implement informed long-term solutions towards tackling air quality crises.
Methods
Green roof location. The green roof was located on the Southwestern area of Mexico City. This green roof was installed in 2009, comprising a total area of 42 square meters, at the Jardín Botánico, Instituto de Biología, Universidad Nacional Autónoma de México, Delegación Coyoacán, within the Reserva Ecológica del Pedregal de San Ángel (REPSA; https://www.repsa.unam.mx) (19° 13′ 45” N and 99° 19′ 37” W), 2330 m.a.s.l. (Figure 1A-C), and subtropical highland climate. The highest temperatures are from March to May (16-19° C), and the lowest are from December to February (12-14° C), with a mean annual temperature of 15.6°C. Precipitation follows a seasonal pattern: the rainy season occurs from June to October, while the dry season is from November to May, with an annual mean precipitation of 833 mm 25.
Figure 1. Green roof location within the Jardín Botánico of the Universidad Nacional Autónoma de México; A. Map of Mexico; B. Zona Metropolitana del Valle de México (ZMVM), according to Instituto Nacional de Estadística y Geografía (INEGI, México), x denotes the location of the Jardín Botánico; C. Google maps view of the Jardín Botánico, arrow (<) denotes the location of the green roof; D. Sedum green roof at the start of the experiment (1-month old plant-cuts); E. Sedum green roof towards the end of the experiment (11-month old plants). *Sedum dendroideum, +Sedum rubrotinctum.
Green roof construction. A completely flat roof was leveled up with concrete and bordered with 10 cm-tall edges (cost $7.5 USD per m-2). The roof was then insulated with a waterproof layer ($0.40 USD per m-2), an insulated asphalt layer ($15 USD per m-2), and a root-proof mesh ($16 USD per m-2). On top of these insulating and protecting materials, a 10 cm deep layer of substrate was uniformly placed, composed of tepojal (to facilitate drainage) and compost (for organic nutrients) in a ratio 1:1 ($11 USD per m-2). It is also estimated that initial plant cuttings cost $12.5 per m-2. All costs are expressed in US dollars as of November 2016. Green roofs require trimming of the excess of plants two years after the initial planting, and every 6 months thereafter. Every trimming removes approximately 30% of the old foliage.
Regarding the soil, we measured the soil apparent and actual densities, pH, electrical conductivity, percentage of moisture and texture 26,27. The bulk density was 1.045g cm-3, organic type, 13.12% humidity, pH 6.05, category moderately acidic, conductance 0.127 S m-1, 27.1 % clay, 12.4% lime, and 72.4% sand, which corresponds to a loam soil.
Biological subjects: We used the crassulacean species Sedum dendroideum Moc. Sessé ex DC. and S. rubrotinctum R.T. Clausen. S. dendroideum is a bushy plant of 50-100 cm in height, and up to 100 cm in diameter. In Mexico, its populations are distributed along the Trans-Mexican Volcanic Belt, and surrounding areas on the states of Hidalgo, Puebla, Estado de México, Oaxaca, and Querétaro 28. S. rubrotinctum has a herbaceous lifestyle, of 15-20 cm in height, heavily branched at the base, originally from the East, South, and Center of Mexico, but thought to be a cultivated hybrid of S. stahlii and S. pachyphylum28. The cuts were obtained from 10 year-old parental plants at another green roof, at the Jardín Botánico de la Universidad Nacional Autónoma de México. S. rubrotinctum’s cuts were 10-15 cm tall, and S. dendroideum‘s were 20-30 cm tall. Cuts were disinfected with Terramycin 1 g L-1 for 24h, and TRICON fungicide. Before planting, all cuts were treated at the base with Radix 10000 ppm to promote root formation. 72 cuts of each Sedum species were planted, every 30 cm in S. dendroideum and 10 cm in S. rubrotinctum, giving a density of 3.4 and 10 plants per square meter, respectively. Planting was done in November 2009, and measurements were recorded from November 2009 to November 2010. At end of the experiment the vegetative growth of both Sedum species gave a 100% cover of the studied green roof area.
CO2 uptake. Quantification of CO2 uptake was performed using an Infrared Gas Analyzer (IRGA) (Qubyt Systems, Canada), which is a device designed to study gas exchange on flat leaves. Thus to quantify the CO2 uptake in succulent plant specimens, we evaluated gas exchange using glass jars. We initially used a glass jar of 418 mL connected with plastic tubes to the IRGA, so we could introduce the entire plant into the jar and seal any openings. As plant size increased, we used a larger glass jar of 1200 mL during the months of April to November 2010. After the month of June, we were only able to measure the part of the plant that fitted into the 1200 mL jar. Measurements were taken monthly on three plants per species randomly chosen at 0:00, 0:40, 1:20; 6:00; 6:40; 7:20; 12:00; 12:40; 13:20; 18:00; 18:40 y 19:20h. The IRGA was calibrated 10 mins prior every measurement, and the quantification of CO2 uptake took 15 mins in each case. The baseline of CO2 in the air was subtracted to the readings, and the differential was considered as the net CO2 uptake by any given plant. In addition we quantified the concentration of organic acids, on the same plants quantified for CO2 uptake, by dissecting the tissues and keeping them chilled until they arrived to the lab. The quantification of organic acids was done according to the titration protocol 29,30, which was done as follow: 1) 2g of tissue were dissected from leaves in each sample, tissues were grinded with 20mL of 50% methanol; 2) the ground tissue was filtered, and 10mL more of distilled water were added; 3) titration was done using a potentiometer, by adding sodium hydroxide 0.01N under constant agitation until a pH of 9 was reached. The added base was used to calculate the acidity per gram of fresh tissue. Raw data available on doi:10.6084/m9.figshare.3395887
Statistical analysis. We used a two-way Analysis of Covariance Variance (ANCOVA) to identify significant differences in CO2 uptake (ppm) due to month and species, and time of the day (time) as a covariate, according to the following model: yppm = Ɓmonth + Ɓspecies + Ɓtime + ɛ. The analysis was done in JMP v12 (JMP, SAS, USA).
Results
Succulent plants, particularly Sedum species, have been extensively used in green roofs because of their resistance to prolonged droughts, high temperatures, and strong winds 10,13,31. Here, we studied the Sedum species Sedum dendroideum Mociño & Sessé ex De Candolle, and S. rubrotinctum R. T. Clausen (Family Crassulaceae). These species have xerophytic morphology and physiology that allows them to cope with extremely dry environments. To assess the carbon capture of Sedum species in a green roof located in Southern Mexico City, we evaluated a plantation of 42 square meters, measuring CO2 exchange using an IRGA system, during the day, over a period of 12 months in 2009-2010. The highest carbon capture in both species was recorded during the night, with a peak at 6:00 (Figure 2). Over the periods of time that were measured, the total CO2 uptake was 2472 ppm (±40.35) from 0:00 to 7:20h, and 152 ppm (± 6.82) from 18:40 to 19:20h in S. dendroideum. Over the same intervals, S. rubrotinctum CO2 uptake was 1823 ppm (±40.70) from 0:00 to 7:20h, and 71 (±4.58) from 18:40 to 19:20h. In both species from 12:00 to 18:00 no CO2 uptake was recorded in most months, but the period of highest CO2 uptake was at 6:00h, with 1602 ppm (±11.05) and 1315 ppm (±14.49) on S. dendroideum and S. rubrotinctum correspondingly. The patterns of CO2 uptake on these Sedum species resemble the Crassulacean Acid Metabolism (CAM) carbon fixation patterns.
Figure 2. CO2 uptake in (A) Sedum dendroideum and (B) Sedum rubrotinctum, during the year, and across the day. Error bars: standard error, n = 3. Raw data available on doi:10.6084/m9.figshare.3395887
In order to validate our observations of CO2 uptake, during the experiment we simultaneously collected tissue from the measured plants to quantify the organic acid concentration using the titration method in the lab. The quantification of organic acids (Figure 3) confirmed our CO2 uptake observation regarding the CAM pattern, also indicating that S. dendroideum and S. rubrotinctum are strict CAM because they uptake most of the CO2, and accumulate organic acid during the night, but not during the day 32.
Figure 3. Quantification of organic acids in (A) Sedum dendroideum and (B) Sedum rubrotinctum, during the year, and across the day. Error bars: standard error, n = 3. Raw data available on doi:10.6084/m9.figshare.3395887
To further investigate the sources of variation on CO2 uptake during our experiment, we performed a 2-way ANCOVA, of carbon uptake (ppm) as a response of months, and species, and time of the day (time) as a covariate, according to the model yppm = Ɓmonth + Ɓspecies + Ɓtime + ɛ. We found no statistical differences between months (F(df 11) = 1.60, p=0.09), or species (F(df 1)= 1.74, p=0.18), but time of the day explained most of the variation in CO2 uptake (F(df 1) = 104.37, p<0.0001). The subtle but not significant differences between Sedum species might be due to their distinctive life forms. S. dendroideum grows erect and bushy, whereas S. rubrontinctum grows herbaceous crawling the floor (Figure 1D-E).
Although it was not statistically significant, February and March were the months with the highest CO2 uptake, coincidentally some of the months with the most chance of high air pollution in the ZMVM. This observation illustrates the physiological plasticity of Sedum species, in which carbon sequestration might be influenced by environmental factors, such as temperature and precipitation (Table 1).
Table 1. Measured net carbon capture of Sedum species in a green roof of Mexico City in a given day per month. Calculated from adding all the 15 mins measured intervals, and averaged from three plants, ± standard error. Tmax: maximum monthly temperature, Tmin: minimum monthly temperature; Tmean: mean monthly temperature; ppt: monthly precipitation. Raw data available on doi:10.6084/m9.figshare.3395887
Month
S. dendroideum
S. rubrotinctum
Tmax
Tmin
Tmean
ppt
November 2009
193 ± 35.76
141 ± 13.89
21.9
8.9
15.4
3.4
December 2009
150 ± 19.67
118 ± 13.71
20.0
7.0
13.0
26.1
January 2010
100 ± 14.89
71 ± 16.29
21.4
7.2
14.0
69.0
February 2010
275 ± 23.05
233 ± 18.09
24.6
9.1
17.2
5.1
March 2010
284 ± 21.13
240 ± 15.12
26.4
10.8
18.5
21.9
April 2010
108 ± 15.33
75 ± 7.03
28.7
13.3
20.7
27.8
May 2010
114 ± 15.24
87 ± 8.69
27.1
14.5
19.7
95.0
June 2010
115 ± 14.58
84 ± 7.05
23.5
14.0
17.9
255.7
August 2010
144 ± 16.09
105 ± 1.06
23.8
14.0
18.8
133.9
September 2010
145 ± 15.90
102 ± 9.69
23.3
13.6
17.7
99.7
October 2010
150 ± 19.05
120 ± 12.21
23.7
9.6
16.2
3.5
November 2010
192 ± 18.39
138 ± 14.43
24.7
7.3
15.2
3.0
The carbon sequestered by Sedum plants can be partitioned into the shoot or root parts of the plant. In order to estimate the biomass partition in the studied species, in a parallel experiment with three plants each, we measured the dry biomass of plants 325 days after planting on a green roof. The largest fraction of the dry biomass was recorded in the shoot (Figure 4). The root:shoot ratio was 0.41 in S. dendroideum, and 0.15 in S. rubrotinctum, which are similar ratios reported for other succulent plants from arid environments 34. This shows that most of the biomass is allocated towards the succulent shoot. However, it is known that roots can produce CO2 because of root respiration and decomposition. The dynamics of carbon sequestration and decomposition in the root and the soil remains to be quantified, however, it is argued that in the short term this ecosystem could be an important sink of carbon 13. Therefore, to mantain a green roof as a carbon sink, we trim about 30% of the old foliage two years after the initial planting, and every six months thereafter. We especulate that trimming practice maintains the plant community as a carbon sink, and reduces carbon emission by decomposition. Nevertheless, carbon sequestration dynamics of older green roofs remain to be quantified.
Figure 4. Dry biomass partition in S. dendroideum and S. rubrotinctum of plants (n=3) measured 325 days after planting on a green roof. The dry biomass of S. dendroideum was 70.3% in the shoot and 29.6% in the root (standard error ±3.1), whereas S. rubrotinctum was 86.8% in the shoot and 13.1% in the root (standard error ±1.1).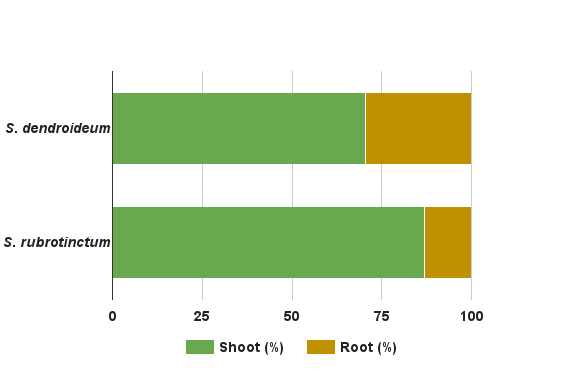
It is possible that carbon sequestered by Sedum species is allocated by the plant to the shoot or the root. The shoot adopts a perennial life-style, in which the leaves are succulent, permanently green, and only after several years, they senesce. This is why we believe that shoot senescence would have a small contribution to the re-emission of carbon to the environment. The biomass accumulated in the root, however, has the potential to contribute to the emission of carbon to the atmosphere by decomposition and degradation of the organic matter. Among desert perennial plants, succulents have the lowest root to shoot ratio, ranging from 0.04 to 0.15, which are dramatically smaller than desert shrubs that range from 3.2 to 7.3 33,34. In other words, the root biomass is disproportionately smaller. Moreover, an adaptation of succulent plant roots is to maintain roots, dehydrate them during the drought season and resurrect them during the new rainy season.
Our aim was to estimate the carbon sequestration capacity that green roofs can have. Therefore we used the data that we obtained from measuring individual plants during the day, and across the year to estimate the overall CO2 capture by Sedum plants. To do this we considered the average CO2 uptake from the three measured plants at each time, and month. Assuming that from 3 am to 6 am, Sedum plants have a steady carbon uptake similar to the 6am rate (see Figure 2), averaged the two species and multiplied our estimate of carbon uptake in 15 mins (period of IRGA quantification), by the total number of minutes in 3 hours, and obtained the carbon uptake in a given day per each month. This number was then multiplied by the number of days in any given month. Then we summed the months to estimate the total carbon uptake per plant during a year (July was assumed to have a mean value between June and August, and we averaged the two measurements of November months), giving 524,040 ppm of CO2 per plant per year, or 371.27 g C m-2. Furthermore, assuming that all the plants in the green roof have similar metabolic rates, we can estimate the amount of carbon that was sequestered in the studied green roof, by multiplying the carbon estimate per plant per year, by the total number of plants in our green roof. This gave a total of 75,461,760 ppm of CO2 in the 2009-2010 period of study in a green roof of 42 square meters, with 144 Sedum plants. In other words, a green roof of Sedum in Mexico City of 100 square meters, has the capacity to sequester 179,670,857 ppm of CO2. This estimate is highly conservative given that the number of plants per unit of area increases dramatically over the year as a result of vegetative growth (see Figure 1D-E). Remarkably, our estimation of a Sedum green roof of 100 square meters is equivalent to approximately 46% of the annual CO2 emission of a standard car (up to 7.5 km L-1) 35, driving every day 10km during 365 days, and estimated to produce 388,360,000 ppm CO2.
Discussion
In this work we evaluated the capacity of two crassulacean Sedum species for capturing CO2, when grown in a green roof, during the day, and across the year. The months of February and March showed the maximum CO2 capture, 75% more than the summer month of June, a response that was possibly influenced by the temperature and precipitation patterns of the ZMVM. Consistent with the CAM, the highest CO2 uptake and accumulation of organic acids occurred early in the morning. We estimated that a green roof of Sedum of 100 square meters is able to sequester approximately 1.8 x 10⁸ ppm of CO2 per year (or 180,000 g C m-2) in the ZMVM. Our quantifications are within the range of previous studies in Sedum species, which range from 160 g m-2 over two years 13, and 1940-3910 g C m-2 over a 12-14 month period 20. It is important to remark that Sedum plants were not irrigated, making these species an ideal candidate, with low irrigation and maintenance requirements, towards promoting naturation efforts in “megacities”.
In our current scenario, carbon concentration in the air is increasing because of the intensive use of fossil fuels. This phenomenon is tightly linked to the growth of human populations and the loss of vegetation in cities, making the design of sustainable urban areas a challenging task. An example of a metropolitan area with poor air quality, linked to decades of deficient urban planning, and short-term solutions to address the air quality issue, is the ZMVM. Particularly, in the early months of 2016, the ZMVM is facing the worst air pollution crisis since the 1980s, which is evidence of the lack of long-term and sustainable environmental policies. Therefore, there is an urgent need to increase the capabilities to fix carbon and other pollutants, in order to improve the air quality in metropolitan areas such as the ZMVM. The widespread installations of green roofs, together with citizen involvement are part of the potential solutions to increase the CO2 sequestration in cities. The green roof system was first developed in Germany in the 1960s 3, and later adopted in several countries such as USA, Canada, and European countries 13,36. Despite their widespread implementation in developed countries and their relevance to tackle air pollution, the understanding of carbon and pollutant dynamics in green roofs is still scarce.
Green roofs are subject to extreme environmental conditions because of the lack of rainfall during certain periods of time, high temperatures, and intense wind. It is because of this that only few species have been used on green roofs, Sedum being the main species worldwide 10,31. As a CAM species, Sedum has fewer capabilities to capture CO2 than C3 or C4 plants; yet, Sedum species are often preferred because of the xerophytic lifeform, and their resilience to extreme conditions.
Carbon sequestration measured in our study is only representative of the environmental conditions of the period 2009-2010. Although we did not measure carbon sequestration in multiple years, we speculate that the pattern should be similar in any given year provided that the variation in temperature and precipitation during 2009-2010 studied period is larger than the corresponding parameters over several years 2005-2015 (CONAGUA, Mexico, 2016; https://www.gob.mx/conagua) (Figure 5). It is remarkable that, despite the extent of variation in temperature and precipitation, the patterns of CAM and carbon sequestration are highly robust during the period of study (Figure 2-3). Therefore, we believe that the estimated parameter of carbon sequestration can be extrapolated to multiple years with similar environmental conditions in the ZMVM. Moreover, our results further support the use of Sedum in green roofs of the ZMVM, as a highly resilient species to temperature and drought.
Figure 5. Historical climate in the Zona Metropolitana del Valle de México (ZMVM) from 2005 to 2015. Data obtained from Servicio Meteorológico Nacional, Comisión Nacional del Agua, México (CONAGUA, 2016).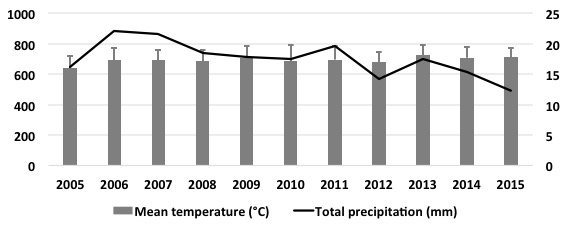
In our study we estimated the carbon uptake of Sedum species at interval periods during the day and at chosen days of each month, giving a total CO2 uptake quantification time of 122.4 hours. We acknowledge that our study did not monitor the entire 24h, or every single day in any given month; however, we believe that our sampling strategy and the clear recapitulation of the CAM physiology during the day and across the year, makes our data robust enough to make projections of carbon uptake during the 24h, of the 365 days of the year. We consider that such quantification and projection of the CO2 uptake can be highly valuable information for policy makers, especially those who might be currently planning how to address the air pollution crisis of the ZMVM.
As expected, both S. dendroideum and S. rubrotinctum displayed a strict CAM photosynthesis, because they captured CO2 during the night, and early hours of the morning, including the dry (November to May) and wet (June to October) seasons. Remarkably, the plants only received an initial irrigation, and were later only watered by natural rainfall, which emphasizes their sustainability in “megacities” such as the ZMVM with seasonal droughts (Table 1). Moreover, Sedum is a perennial species, reducing the requirement for replanting year after year. Other perennials have been used on green roofs, for instance trees of up to 3m, which can have higher rates of carbon capture. However, trees often require costly maintenance and frequent irrigation. Trees can sequester more carbon at the global level, but as Getter et al (2009) pointed, “due to building weight restrictions and cost, shallow substrate extensive green roofs are more common than deeper intensive roofs” 13. Therefore we strongly support the use of Sedum species, together with other C3 or C4 plants, towards the widespread implementation of green roofs.
In summary, the high survival, fast growth, low or null-maintenance, low or null irrigation requirement, and capacity to capture CO2 make Sedum an ideal species for green roofs, as an alternative strategy for promoting vegetation in megacities with marked seasonal drought. Particularly, Sedum species would be an ideal solution for the ZMVM, which is in urgent need of long-term solutions towards tackling the air quality crisis of the last decades.
Objectives: In order to improve predictability of severe weather conditions on Lake Victoria, there is need to deliver timely and effective Severe Weather Early Warning Systems (SWEWS) to those at risk. On Lake Victoria, previous SWEW service trials ceased with the end of the funding grants. This study therefore assessed the possibility of sustaining the SWEW service by assessing willingness to pay.
Methods: An assessment was conducted between March and May 2015 to determine the SWEW service improvements desired by the population. A convenience sample of respondents was gathered and interviewed during impromptu visits to landing sites on Lake Victoria. The respondents were also among community members that had earlier participated in a pilot assessing the feasibility of mobile phones is delivering SWEW alerts. Semi-structured questionnaires were administered to fishermen and fisher folks at the landing site to gather suggestions/strategies for (i) better design and implementation of SWEW service, (ii) use of smart phones, and (iii) their ability and willingness to pay for a SWEW service. Results were presented as frequencies.
Results: Two hundred fifteen respondents from fourteen landing sites (communities) were interviewed. Over 50% of the respondents (113/215) were aware about at least one community member who had been injured due to lightening on the lake in the past year. Ninety two percent (198/215) of the respondents reported using mobile phones as their main tool of communication but only 4% had smart phones that could receive early warning weather alerts through internet connectivity. Seventy five percent of respondents said they would welcome a system that could deliver commercial weather alerts and 65% were willing to pay for such a service.
Conclusions: A SWEW service is feasible in this community but must be accompanied with public education on risk, a design that can fit the basic phone functionality and a system that the community majority will be willing to pay for on a continuing basis as a sustainability plan/strategy for an early warning system. This will enable timely dissemination of severe weather alerts and reduce risk of drowning on lakes among fishing communities.
]]>INTRODUCTION
According to the recent study, an estimated 5,000 people per year die from severe weather on Lake Victoria.1 The northern part of Lake Victoria experiences the maximum number of thunderstorms which average to 242 days per year compared to any other country in the world. Fishermen are at special risk of drowning, not only from high winds, waves and lightning but from poorly maintained boats, lack of life saving equipment and navigational aids. In addition, gale size winds can move inland to destroy vegetation, property and human settlements including schools and health centers.2
The loss of life impacts more than fishermen by affecting their families and communities both economically and socially. Persons who feel they have little control over their lives may become resigned to their fate. They may be less likely to listen to warnings of other risks such as HIV and more likely to choose life’s pleasures rather than pursue education for their children and other self-improvement activities that require time, energy, money, and sufficient hope that delays gratification becomes a viable behavior. The communities surrounding Lake Victoria are among those with the highest levels of HIV infection, poverty, disease, gender-based marginalization, lack of education, and violence.3
By providing weather information and warnings to fishermen, they are able to make informed decisions about when and where to fish, whether to go out onto the lake or seek shelter in safe areas. This not only helps save many lives, but also enhances the livelihoods of the communities around the lake, as many fishermen are the sole providers for large families.
In order to decrease the loss of lives, we propose to design a Severe Weather Early Warning System (SWEWS) utilizing lightning detection and other weather data in cooperation with the Uganda National Meteorological Administration, Earth Networks, and other agencies to deliver SWEWS by smart phone technology to fishermen and others who work around the Lake.
Previous SWEWS have been piloted in the communities living on Lake Victoria by the World Meteorological Organization (WMO) and Grameen Foundation in 2011-2012 but tended to fail when grant funds and personnel left. Most of these projects are no longer operating for a number of reasons, including problems with delivery to the end users, timeliness of information, and lack of sustainability given that the community was not paying a fee for this service. Other projects utilizing different segments of this idea have been implemented in the region including one for farmers to search for advice on managing crops and livestock, for weather data and market prices4 for fishermen
In summary, we propose a SWEWS with accurate and timely weather reports delivered to mobile phones in languages appropriate to the user. Many components are involved:1)Accurate weather data collection; 2) Skilled interpretation to provide reliable forecasts and timely warning; 3) Delivery of warnings in a timely and effective manner to the end-user; 4) Education on how to interpret the information delivered; 5) Implementation of alternative livelihood 6) Assurance that the SWEWS is economically sustainable
Before any of these can be effective, it is essential to determine what the end-users, particularly the fishermen and those living around the Lake, identify as important to its effectiveness as well as their willingness to support the system with subscriptions once it is implemented as part of the community sustainability strategy.
METHODOLOGY
This study focused on the fishing community of Lake Victoria in Kalangala District, a major group at risk from severe weather effects. Kalangala District is located on the northern shore of Bugala Island, the largest of the Ssese Islands in Lake Victoria. Kalangala is made up of 84 widely scattered islands. It is approximately 60 kilometers across water, southwest of Entebbe, the largest and nearest mainland town. In 2011, the Uganda Bureau of Statistics (UBOS) estimated the mid-year population of Kalangala district at 5,200. People settle mostly in villages made of temporary structures with each village having approximately 200 households. The principal economic activity on the Island is fishing. Nile Perch is the species primarily fished with most of the catch processed on the mainland for export. Other economic activities include agriculture, crop and animal husbandry, logging and tourism.
Twenty four villages spread across five islands of Bubeke, Bukasa, Kachanga, Misozi and Bulagain in Kalangala District provided a convenience sample gathered during impromptu visits to interview those found on site. A total of 215respondents were sampled from the 1000 participants who had participated in the earlier pilot of Mobile Weather Alerts supported by World Meteorological Organization that ended in early 2011. They were specifically solicited, when possible, because their experiences were deemed valuable in planning an improved approach and in enhancing use by the target population.
The information collected was aimed at determining the elements of a people-centered EWS, i.e.
1) risk knowledge , 2) monitoring and warning service , 3) dissemination and communication and 4) response capability.
Written informed consent was sought from each individual before the questionnaire was administered. The study approval was sought from the Uganda National Meteorological Authority because this assessment was part of a follow up of the work done by the World Meteorological Organization to inform adjustments in the intervention. We did not obtain approval from an Institutional Review Board but rather approval from the Uganda national Meteorological Authority. The assessment was conducted under supervision of Makerere University School of Public Health
Respondents were assessed for; socio-demographic characteristics, experience with the Mobile Weather Alert pilot, extent of use of the mobile phone as an information source, knowledge and perceptions about lightning and severe weather including the features they desired to be part of a mobile weather alert system. Quantitative data was collected using a pretested semi-structured questionnaire which was developed based on the information gathered from previous pilots and included questions on; personal history, exposure to the Lake, perceptions about SWEWS, as well as, willingness and ability to pay for such a system or service.
The questionnaire was administered to the adults with the aid of a local language (Luganda) translator by trained research assistants utilizing iPads/tablet computers for data entry. Data was summarized using Microsoft Excel spreadsheets to obtain frequencies in each category of questions and data was presented by appropriate tables, figures and text.
RESULTS
A total of 215 respondents from twenty four landing site communities/ villages were interviewed as summarized in Table 1. The table also highlights their socio- demographic characteristics. Most of the respondents were men (84%) and from Bulaga village. Over a half (52%) had attained primary education and 48% reported that their main occupation was fishing in the lake.
Table 1 – Demographics of Study Population
Community exposure to the Lake
In the study population, 27.9% (60/ 215) of the respondents reported that they owned their own boats. Boats were nearly equally split between those with motors versus those without (48.1 vs 51.9%). Over half of the respondents reported that they traveled by boat on Lake Victoria on a daily basis. (Fig 1),
Fig. 1 – Frequency of travel by boat on the Lake
When asked about the community’s perception of severe weather effects, the majority of respondents (91.7%) cited a combination of different hazards, mainly high winds and thunderstorms. The same group noted that high winds come with high waves, while thunderstorms come with lightning, making it difficult to quantify each of these hazards separately (Table 2). Lightning injury alone was cited by only 6.5% as a major hazard. However, up to 54% of respondents could recall lightning strikes on a regular basis (24% everyday; 17% every week; and 13% every month).
Table 2 – Perceptions of the community in relation to severe weather
Over 50% of the respondents (113/215) were aware about at least one community member who had been injured due to lightning on the lake in the past year. It was also noted that 32.6% (70/215) of the respondents knew at least one community member who had died on the lake due to lightning (Table 3). When asked specifically what they believed was responsible for these deaths, multiple responses were given including high winds (88%; 62/70) and 30% (21/70) cited poorly maintained boats.
Table 3 – Knowledge about Injuries and Fatalities from Lightning on the Lake in the past year
Level and extent of mobile phone use in the fishing community
All respondents reported using mobile phones. Ninety-two percent (198/215) mentioned the mobile phone as their most useful tool for obtaining information, while 8 % mentioned the radio. The majority of the respondents 85.1% (183/215) paid for their own mobile usage fees. On average, the respondents reported that they spend USD 8 per month for mobile phone services. In the study population, 96% of the respondents (206/215) had mobile phones with basic functionality and only 4% (9/215) had advanced features.
Use of mobile alert systems
It was reported that 30.7% (66/215) of the respondents were currently receiving mobile phone weather alerts. When these respondents were asked how the mobile phone alerts were helping them, 80.3% (53/66) said that the alerts were helping them in planning while 2.8% (6/66) said that the alerts informed them about the weather conditions. However 70.2% (151/215) of the respondents were not receiving any mobile phone weather alerts. Seventy-five percent of respondents said they would welcome a system that could deliver commercial weather alerts, while 65% were willing to pay for such a service. Table 4 also illustrates how respondents thought that alerts on mobile phones could be made more effective.
Table 4 – Preferred Characteristics of Severe Early Weather Warnings
DISCUSSION
The populations that depend on fishing for their livelihoods is of high economic importance in Uganda’s economy since the fishing industry contributes 2.48% to the Uganda’s GDP.5 The fact that so many respondents could recall more than two incidences with three or more deaths within the past year speaks to the loss of life and to the many productive years. Such loss to the economy and family support due to premature death alludes to the need for risk reduction through early warning.6 In addition, the fact that over half of those studied travel on boats every day points out the risk are exposed to.
The aim of this study was to gather information that would be used to improve the delivery of potentially life-saving weather warnings. These warnings would enable fishermen and others in the community to make informed decisions about their work and exposure to severe weather. For that reason, it was good news to note that most of the respondents in the sampled villages were natives, making it easier to build a trusted and sustainable business model for the early warning delivery. It is much more difficult to build a sustainable enterprise with migrant workers and their dependent populations.7 In order to assure sustainability in building EWS where community members pay for the system or service through subscriptions, it is important to choose a warning communication technology that is acceptable to the recipients. Among other considerations is the; recipient location, their activity, the systems they rely on to receive local news and information, any special needs they may have and how they understand and respond to warnings.8
In this study, all respondents owned mobile phones, relied on them as their most common source of information, and spent 8 USD per month on average for airtime credit. This presents the opportunity to harness the mobile phone alerts to their willingness and ability to pay for severe weather alerts in order to support a sustainable EWS. However, for this particular project to succeed, it will be necessary to consider the functionality of the phone and to either fit the EWS to basic phones or to make smart phones available at a low cost.
The study revealed some parts of the population at risk during all hours of the day and night as they routinely traveled and worked on the Lake. This support the need for an effective EWS that incorporates; risk knowledge, appropriate monitoring of the warning service, timely dissemination to the populations at risk and enhanced response capacity of the community.8,9 As far as risk knowledge, the majority of respondents were aware of severe weather related hazards on the lake and believed a scientific explanation for lightning, rather than a superstitious or supernatural explanation for its source. This implied that they will see scientific methods as reliable for giving them warning and improving their control over lightning risk. The proposed severe weather casting early warning system aims to use lightning as a proxy measure of severe weather, a sound and scientific basis for early warning on the lake that regularly provides hazards like heavy winds, waves and thunderstorms.10
Concerning dissemination and communication, respondents reported that they rely heavily on mobile phones for information. The few people who had experience with mobile phone weather alerts in earlier projects had found the alerts useful especially in planning, showing that warnings reached the intended users, were understood and usable.
Most respondents preferred an alarm as a warning system over color codes or text. This may be due to the low literacy levels among the fisher folk which could impede reading text warnings to ensure timely response. They also agreed that timeliness was the most important factor and thus preferred the use of local language for EWS.
In this study, the community noted their trust in the SWEWS that had been piloted earlier which speaks to the perceived validity of the warning messages. In addition, authorities like the police were perceived as the responsible body that should issue the alerts. This is in agreement with the incident command operations that call for a clear chain of information flow.
The most common response action to a severe weather alert reported in this community was moving to a nearby island for safety and anchoring the boat. Although validation of this response was not tested as part of this study. The use of such indigenous/ local knowledge, if effective, may improve the effectiveness of response to an early warning system. As part of the warning dissemination, such information should be widely available so that there is organized response capacity in the community
There are some limitations to this study worth mentioning. Given that a convenience sample of individuals was taken, the results may be biased in a way that they don’t represent the views of the general population. In addition, some communities had few respondents compared to others. Nevertheless, we believe that the information can aid in the design of an acceptable tool for early warning with the best delivery mechanisms, given that we interviewed the population that is aware of the hazards and risks associated with the Lake and severe weather effects.
The study sample was not chosen randomly and this may have caused reporting bias. In addition, a portion of the population targeted had participated in the pilot study of testing a mobile phone weather alert service. However, since the pilot interventions had ended over a year ago, we believe that the experience of the respondents and their responses may actually enhance the next system and that the results of this assessment are valid enough to guide an improved approach. This will enable timely dissemination of severe weather alerts against hazards like lightning and thunderstorms hence giving lead time to those exposed to take actions to prevent, mitigate or prepare for such risks. The severe weather early warning system will hence reduce risk of drowning on lakes among fishing communities.
CONCLUSION
Exposure to the lake was common with fishing in the lake being a major occupation in the study population. Over half of the respondents were aware of at least one community member who had been injured due to lightning and a significant number of respondents were willing to pay for a smart phone based commercial severe weather early warning system service. This will enable timely dissemination of sever weather alerts against hazards like lightning and thunderstorms hence giving lead time to those exposed to take actions to prevent, mitigate, or prepare for such risks. The sever weather early warning system will therefore reduce risk of drowning on lakes among fishing communities.
Corresponding Author
Doreen Tuhebwe ([email protected]; [email protected]).
Competing Interests
The authors have declared that no competing interests exist.
Data Availability Statement
All relevant data are within the manuscript and the public repository Figshare. Please view data at the following URL: https://figshare.com/s/526fec13e1c8e386809d
Ethics Statement
Approval for the study was received from the Uganda National Meteorological Authority. The assessment was conducted under supervision of Makerere University School of Public Health.
Methods: A qualitative approach using in-depth unstructured interviews was used for this study. A total of 13 participants (two men and 11 women), affected by the quakes, were interviewed applying the purposeful sampling method. A manifest content analysis was performed for analyzing the transcribed interviews
Case presentation: Two categories of women’s capabilities and challenges and four subcategories of women’s participation in community reconstruction, livelihood efforts, aggravated poverty and violence were extracted from the data which were gathered in the destroyed fields of eastern Azerbaijan.
Lessons learnt: Women can play an important role in post-disaster recovery. Consequently, ignoring the challenges and capabilities of women may impede post-disaster development processes, which would adversely affect the whole community.
]]>Introduction
Gender is considered as one of the key aspects of disaster vulnerability and it is the main aspect of social discrimination.1 Iran is known to be a highly disaster-prone country2 with an almost equal gender distribution (49.6% for women).3 During the last three decades, Iranian people have suffered from the destructive effects of natural disasters including earthquakes, floods, and droughts.2 Women and girls have been affected by negative consequences of natural disasters more than men. For example, some women were the victims of rapes and sexual harassment after the Bam earthquake in 2003.4 In addition, a number of studies reported several mental health disorders among the affected women included depression, anxiety and post-traumatic stress disorders (PTSD).5,6 Furthermore, joblessness, indigence, violence, and psychosomatic diseases have been reported as women’s challenges in some disaster-stricken regions in the world.7,8,9,10
The twin earthquakes of eastern Azerbaijan province in 2012 (12 August) caused considerable damage in many villages and cities. Furthermore, the earthquakes killed more than 300 people and injured about 3000 citizens living in the affected regions. About 70% of all killed people were women and their children.11 The present case report was aimed at identifying the capabilities and challenges of women after the twin earthquakes of eastern Azerbaijan. This report was also meant to summarize the lessons learnt from the women’s experiences after the twin earthquakes of eastern Azerbaijan.
Methods
A qualitative approach using content analysis was applied for the study. Affected people living in the destroyed regions of eastern Azerbaijan were approached for interviews. A purposeful sampling method was used for selecting participants in the disaster-affected fields. Native health officials working in the public health centers of the damaged regions helped the researchers by preparing a list of affected people. The list included addresses and contact information of damaged households.
The number of participants was determined based on the saturation principles. Data saturation was reached after 12 interviews, but one additional interview was conducted to make certain that no new concept emerged. A total of 13 participants (two men and 11 women) were interviewed. Data were collected through in-depth unstructured interviews carried out in the destructed houses and conex (or temporary containers). The first author asked each respondent “tell me about your post-disaster experiences.” Probing was performed to encourage the participants to describe their experiences and feelings completely. Each interview was analyzed immediately, and the retrieved data became a guide for further data collection.
Data gathering and data analysis were performed simultaneously. Several steps were conducted for data analysis. First, the interviews were read several times to obtain a sense of the whole. Second, the entire material was brought together into a single text which formed the unit of the analysis. Third, the text was divided into meaningful units. Fourth, the condensed meaningful units were labeled with a code. Finally, the codes were compared according to the differences and similarities and sorted into two categories and four subcategories.
Member and expert checking as well as sampling triangulation (including men and women) were used for achieving trustworthiness. In member checking, the main researcher asked the respondents about possible misunderstandings during interviews and for expert checking, the research team discussed the emerging subjects.
Case Presentation
All participants were in the age range of 17-60 years with educational levels from illiteracy (15%) to diploma education (15%). About 70% of all participants had primary education. The majority were female (77%) and the remaining (23%) were male.
Two categories of women’s challenges and women’s capabilities were extracted from the data: Women’s capabilities and Women’s challenges. These categories consisted of four subcategories, namely, participation in community reconstruction, livelihood efforts, aggravated poverty and violence.
1-Women’s capabilities
1-1-Participation in Community Reconstruction: Reconstruction of the destroyed regions were indirectly initiated by the government’s loans for damaged houses. Households took care of all reconstruction costs through the loan that was given. Since the government’s payment was not enough to take care of the reconstruction costs, women and girls participated in reconstruction of their damaged houses in conjunction with men. Consequently, women helped the men to save money by working as builders. On the other hand, reconstruction was an imperative priority for all the people affected owing to the fact that living in conex and temporary settlements was difficult at the onset of winter.
1-2-Livelihood Efforts: Carpet weaving was the main source of income in the affected regions and was stopped due to the destruction and inappropriate living conditions in conex or temporary settlements. Carpet weaving was done by women and young girls in newly reconstructed houses. Although some instruments used for weaving were destroyed in the earthquakes, carpet weaving was the main source of livelihood for women and girls after the quakes. In addition, after the quakes. Since livestock were killed and their houses (barns) were destroyed during the earthquakes, farming and ranching activities were not possible and carpet weaving was the only source of income in the affected regions.
2-Women’s challenges
2-1-Aggravated Poverty: Pre- and post-disaster poverty as well as economic burden were reported in the affected regions. Consequently, poverty exacerbated in the damaged regions after the earthquakes. Women and girls were compelled to stay at home and weave carpet and engage in farming as a domestic job. However, shrinking of carpet and inadequate space for weaving were the challenges of post-disaster carpet weaving, which exposed them to the risk of further impoverishment. In addition, some young girls stopped going to high school and could not obtain their diploma because their family could not afford the cost of their education after the earthquakes.
2-2-Violence: Early and forced marriages were forms of violence observed against women and girls before and after disasters; however, forcingteenage girls into marriage was common after the earthquakes due to post-disaster poverty. Furthermore, forcing of young girls to work at home and banning them from having access to education were considered as other forms of violence against women in the affected regions. Women and girls had to be allowed by men (father, husband, brother, and uncle) to leave home for work, attend school or even receive relief aids after the earthquakes. For instance, a young woman who had diploma in information technology stated that her husband did not allow her to work with computers, but allowed her to weave carpet and work in the farm.
Lessons Learnt
According to the present case report, women suffered from poverty and violence after the twin earthquakes of eastern Azerbaijan. On the contrary, the affected communities benefit from the women’s capabilities included participation in community reconstruction and livelihood efforts. In consistence with the report, affected women faced joblessness, poverty and domestic violence after the Sri Lanka tsunami.9 Furthermore, the report of disaster-affected regions in India revealed that women suffered from early marriage, poverty, lack of education and violence after the quakes.10 The following lessons can be learnt from the results of this case report:
Ethical Consideration
This study was approved by the ethics committee of Shahid Beheshti University of Medical Sciences (Tehran, Iran). All participants were informed about confidentially of their names and other private information in the related reports.
Corresponding Author
Katayoun Jahangiri ([email protected])
Competing Interests
The authors have declared that no competing interests exist.
Data Availability
The data set contains interview transcripts and will only be shared upon request. For further information regarding data availability please contact Sanaz Sohrabizadeh at [email protected]
Methods: The working sample included 130 family ties reported by 85 respondents recruited from community and shelter residents on Staten Island after it was seriously damaged by the 2012 Hurricane Sandy. Regression with robust standard errors was used to examine how changes in emotional closeness and exchanges of support with adult family members affected respondents' posttraumatic psychological distress and posttraumatic growth.
Results: Results showed psychological distress was significantly increased with higher levels of instrumental support received from family members; whereas posttraumatic growth was significantly increased with greater improved emotional closeness with family members. In addition, having higher levels of education was associated with lower levels of psychological distress and respondents from shelters showed higher levels of posttraumatic growth than those who were from the community.
Discussion: It is suggested that after a significant disaster, although a family may be the best to take care of its members' emotional needs, it should not be expected to satisfy the instrumental needs of its members. In addition, posttraumatic psychological distress and growth are not necessarily opposite to each other; the psychological well- being of residents after a disaster needs to be carefully examined from both perspectives.
]]>Introduction
Natural disasters could result in various kinds of mental health problems 8. The adverse effects of disasters on mental health may include psychological distress and anxiety, a strong sense of loss, out of control, and feeling overwhelmed; some situations including physical injuries, witnessing death, missing family members, loss of property, loss of values and tradition, relocation, and lack of resources may add extra grief to the experience of disasters 2. These emotional reactions may lead to severe Post Traumatic Stress Disorder if not appropriately addressed.
Nonetheless, some survivors of disasters also demonstrated positive psychological gains. It is possible for survivors to experience positive change of perception of the self with a sense of increased personal strength, a changed sense of relationships with others with improved closeness of intimate relationships, and a changed philosophy of life with increased appreciation of life and setting new life priorities, which is conceptualized as post traumatic growth 6.
The stress process model indicates that social support will help to reduce people’s distress in times of high stresses 10. The disaster presents a highly stressful situation, where social support and individuals’ own psychological resources are tapped into to cope with the stresses. People respond to disasters as families, e.g., they usually evacuate together and most of the time continue their after-disaster life together and recover together. Support from families, especially the emotional support, tends to help people coping with stresses after disaster 4. However, few studies have differentiated types of support exchanged between family members. In addition, it is usually challenging to get an overall picture of support exchanged among a family with multiple ties included.
In this investigation, we examined both the positive and negative psychological outcomes after the 2012 Hurricane Sandy, which damaged more than a quarter-million residences and was responsible for around 150 direct deaths and 50 billion dollars losses 7. By considering both aspects of the psychological outcomes, it is possible to compare predictors for them side by side. Additionally, we examined how changes in emotional closeness and exchanges of emotional and instrumental support with all adult family members may affect respondents’ positive and negative psychological responses
Methods
Sample
After the approval of Texas Tech University Human Research Protection Program, a survey was administered with residents of Staten Island in December 2012, approximately one month after the Hurricane Sandy hit the area. More than 50% of all deaths associated with Hurricane Sandy and over 30% of destroyed houses happened in Staten Island 12. In the year 2010, Staten Island had an population of about 468,000 with the median household income of $74,043 in 2014 dollar; the average household had 2.81 family members and 73% were White 13.The whole research process and used materials were approved by the Institutional Review Board of Texas Tech University. Participants were mainly recruited by door-to-door visits in heavily damaged areas, supplemented by residents of shelters hosting those who lost their homes and individuals who applied for assistance from FEMA disaster centers. Only respondents 18 years or older were interviewed. Altogether, 122 respondents were interviewed face-to-face. They also reported the household members that lived with them within one week before Sandy. Altogether, 198 household members were reported and among them 131 were aged 18 or above. We probed into respondents’ interactions with each adult member aged 18 and above after Sandy. Therefore, respondents who reported no adult family members were excluded from the study. After deleting missing values, the working sample includes 130 household members reported by 85 respondents.
Dependent Variables
K-6 measure was used to measure nonspecific psychological distress after Hurricane Sandy 3. Post Traumatic Growth was measured with the 10 item short form Post-Traumatic Growth Inventory scale 1.
Independent variables
To measure changes in emotional closeness after the hurricane, we asked respondents concerning each reported household member: How much did the hurricane bring you closer or less closer to this person? Answers were coded as 0 (a lot less closer) – 6 (a lot closer).
Emotional support received from household members was measured with a question “How much emotional support have you received from this person related to Sandy and its aftermath?”, and the answers were coded as 0 (none) – 4 (all you need). Emotional support provided as well as instrumental support received and provided were coded similarly. We gave examples of instrumental support as help with evacuation, transportation, looking for shelters, filling forms etc.
Controls
Variables controlled included respondents’ age, gender (0=male, 1=female), education (0=high school or less, 1= college or more), race (1=White, 0=others), and recruiting place (0=community, 1=shelters).
Analysis
Regression with robust standard errors was used to account for the non-independence of analytic units resulting from the clustering of reported ties within each respondent. We used STATA 12, “regress” command, and “robust” option for the analysis. With the “robust” option, the standard errors were estimated using the Huber-White sandwich estimators 14 .
Results
Table 1 shows the coding and descriptives for analytic variables. Among the 85 respondents, 39% were female, 82% were white, 47% had college level or more education, and 39% were recruited from residents from shelters. The average age was 45.14 years (Standard Deviation (SD) = 10.66). On average, respondents showed some levels of psychological distress measured with K6 scale (M = 10.88, SD = 6.55) and posttraumatic growth (Mean (M) = 28.37, SD = 11.30). The mean K6 score was 10.88, lower than the severe mental distress cutoff point 13 but higher than the moderate distress cutoff point 5, representing moderate levels of distress after the hurricane 15,16. Concerning respondents’ changes in emotional closeness and support exchanges with the 130 adult family members, on average respondents reported slightly improved relationships with family members (M = 3.82, SD = 1.93). The average emotional support received from family members was 2.42 out of 4 (SD = 1.40), provided to family members was 2.80 out of 4 (SD = 1.35). Instrumental support received was 2.44 (SD = 1.51) and provided was 2.65 (SD = 1.47).
Table 2 shows that exchanges of support did not affect posttraumatic growth, but instrumental support received from family members increased psychological distress and emotional support received from family members reduced psychological distress. Having improved emotional closeness with family members did not affect psychological distress but significantly and considerably increased posttraumatic growth. Among controlling variables, higher education was associated with lower level of psychological distress, and respondents from shelters reported higher levels of posttraumatic growth.
Mean
Standard Deviation
Coding and Range
Respondents’ characteristics (N=85)
Psychological distress
10.88
6.55
0(no distress) – 24(most distress)
Post Traumatic Growth
28.37
11.30
0(no growth) – 50(most growth)
Age
45.14
10.66
23.5 years old – 71 years old
Gender
Male
61.18%
Female
38.82%
Race
White
82.35%
Others
17.65%
Education
High school or less
52.94%
College or more
47.06%
Recruiting Places
Community
61.18%
Shelters (vs. community)
38.82%
Damage levels
Moderate or less damage
33.85%
Severe
40.00%
Destruction
26.15%
Number of family ties reported
1
56.47%
2
30.59%
3
7.06%
4
3.53%
Characteristics of family ties (N=130)
Relationships with the respondent
Spouse or partner
45.38%
Child
22.31%
Others
32.31%
Age
40.19
15.26
18-83
Gender
Male
47.69%
Female
52.31%
Changes in emotional closeness with family members
3.82
1.93a
0(a lot less closer) – 6(a lot closer)d
1.83b
0.76c
Emotional support received
2.42
1.40a
0(none) – 4(all the receiver needed)e
1.24b
0.67c
Emotional support provided
2.80
1.35a
0(none) – 4(all the receiver needed)e
1.16b
0.67c
Instrumental support received
2.44
1.51a
0(none) – 4(all the receiver needed)e
1.25b
0.79c
Instrumental support provided
2.65
1.47a
0(none) – 4(all the receiver needed)e
1.28b
0.66c
a overall SD
b between respondents SD
c within respondents SD
d 0 (a lot less closer), 1 (somewhat less closer), 2 (only a little less closer), 3 (about the same), 4 (only a little closer), 5 (somewhat closer ), and 6 (a lot closer).
e 0 (none), 1 (a little bit), 2 (some), 3 (substantial), 4 (all s/he needs)
Table 2 shows that exchanges of support did not affect post traumatic growth, but instrumental support received from family members actually increased psychological distress. Having improved emotional closeness with family members did not affect psychological distress but significantly and considerably increased post traumatic growth. Among controlling variables, higher education was associated with lower level of psychological distress, and respondents from shelters reported higher levels of post traumatic growth.
| Psychological Distress | Post-Traumatic Growth | |
|---|---|---|
| Age | -0.01 | -0.04 |
| Female (vs. male) | 1.68 | 1.10 |
| White (vs. others) | 0.55 | -3.74+ |
| College or more education (vs. high school or less) | -2.40* | -1.11 |
| Shelter (vs. community) | -1.62 | 6.53** |
| Damage (reference: moderate or less damage) | ||
| Severe | 5.85** | -2.30 |
| Destruction | 3.62* | -3.70 |
| Changes in emotional closeness with family members | 0.23 | 2.36*** |
| Emotional support received | -2.03** | -0.02 |
| Emotional support provided | 0.83 | -1.05 |
| Instrumental support received | 1.88** | 1.01 |
| Instrumental support provided | -0.74 | -0.92 |
| Constant | 7.27 | 25.44 |
| R2 | 0.29 | 0.23 |
| +p<0.1, *p<0.05, **p<0.01, ***p<0.001 | ||
Discussion
This study examines how changes in emotional closeness and exchanges of support with all adult family members affected both the positive and negative dimensions of psychological responses after a significant disaster. It is interesting that instrumental support received from family members increased psychological distress and improved emotional closeness with family members increased post traumatic growth. Although it is generally expected that social support will be beneficial for individuals’ psychological well-being, previous literature has shown possible negative effects of social support. For example, the task specific theory proposes that the best psychological outcomes will occur when there is a good match of providers of support and the tasks of support 5. Based on the findings, we suspect that family members are not good providers of instrumental support such as transportation and evacuation during the highly stressful period after a disaster and when family members are sharing similar needs. Under such circumstances, receiving instrumental help may bring a sense of guilty as it may put an obvious burden on the ones who provided support, which will eventually leads to elevated psychological distress. Consequently, help with transportation and evacuation etc. should be more effective when it comes from formal social services. But our findings did shown the beneficial effects of emotional support from family members.
At the same time, we find that post traumatic growth and post traumatic distress were predicted by different factors. The findings show that higher levels of education were associated with lower levels of psychological distress, but not necessarily post traumatic growth. Similarly, dwelling in shelters enticed a stronger sense of post traumatic growth, but did not reduce psychological distress. Similarly, severe damage to houses increased distress but did not affect posttraumatic growth. Previous literature has shown that post traumatic growth does not mean that individuals could potentially recover to the pre-disaster status, but suggests that this traumatic experience could serve as an opportunity for development; it is different from reduced stress or increased well-being, and it is not the opposite of the psychological distress 11. Individuals could learn from the disaster when they were trying to cope with the events; they will possibly find their own strength that they did not realize in the past and are more prepared and determined to deal with future hardships and difficulties 9. This may explain why residents who stayed in shelters who typically experienced more losses and stresses showed greater post traumatic growth than community dwelling residents did.
This study has a relatively small sample size, which limits the statistical power of the analysis and the potential to include more controlling variables. Furthermore, because this study is cross-sectional, the findings of this study speak more about the association between independent and dependent variables rather than argue for any causal relationship. Additionally, we relied on respondents’ own report of their interactions with family members. The self-reported measures might be biased, as that respondents tended to report higher levels of support provided than received. But the gap was not huge as shown in this study, which suggested limited biases in the self-reported exchanges of support. Finally, we were not able to include interactions among all family members, which would contribute to a more comprehensive understanding of family interactions after a disaster.
Despite all those limitations, this study includes both the positive and negative dimensions of psychological responses and tries to include a comprehensive picture of exchanges of support within a family. The implications for policy makers include carefully weighing the benefits of family support and thus make decisions on providing formal support to maximize the psychological well-being of residents who experienced significant stresses in a disaster.
Data Availability
Data is available from Figshare at https://dx.doi.org/10.6084/m9.figshare.3600321.v1. The DOI is “10.6084/m9.figshare.3600321”.
Methods: A survey distributed electronically to medical providers with and without disaster experience. Questions asked included what disaster experiences they had, and to rank six attributes in order of importance regarding triage.
Results: 403 unique completed surveys were analyzed. 92% practiced a structural triage approach with the rest reporting they used “gestalt”.(gut feeling) Twelve per cent were identified as having placed patients in an expectant category during triage. Respiratory status, ability to speak, perfusion/pulse were all ranked in the top three. Gut feeling regardless of statistical analysis was fourth. Supplies were ranked in the top four when analyzed for those who had placed patients in the expectant category.
Conclusion: Primary triage decisions in a mass casualty scenario are multifactorial and encompass patient mobility, life saving interventions, situational instincts, and logistics.
]]>INTRODUCTION
A mass casualty incident (MCI) is defined as an event which generates more patients at one time than locally available resources can manage using routine procedures.1 The goal of triage systems, protocols and algorithms, at every level of care, is to ensure the best possible opportunity for survival of all the victims served. Advancements within emergency medical services (EMS) have had considerable impact on the manner in which MCIs are triaged and initially managed.
Primary triage occurs at the first contact with the EMS medical personnel at which point victims are assigned an acuity level based on injury severity. Secondary triage, or a reevaluation of the victim’s condition after initial medical care, may also occur at the scene of the MCI following EMS interventions or during transport to an emergency department or secondary collection station.2 The decision-making processes involved in primary triage and patient hospital distribution are influenced by both reactive (ad hoc) and proactive (based on situational awareness) factors.2 An ‘ideal’ triage protocol system would result in minimal under-triage or patients classified less acute than what they really are, and over-triage, which has been shown to increase mortality as more people are labeled as a higher acuity than they really are.
To date, no single triage tool algorithm can demonstrate sufficient scientific evidence to justify national adoption. In 2006 the National Association of EMS Physicians (NAEMSP) and the Centers for Disease Control and Prevention (CDC) funded the SALT workgroup. The goal was to exam published triage systems and make recommendations based on available science for the adoption of one standard mass casualty triage system. The initial result of the workgroup effort showed that there was no published triage system that could be adopted. Secondary outcomes were two fold; the first was the development a new triage system, the Sort-Assess-Lifesaving Interventions-Treatment/Triage (SALT). This a non-proprietary free system developed from available research, with widely accepted best practices of existing mass triage systems, and consensus opinion from the workgroup. The second outcome, because of resistance from local, state and federal agencies to change current triage practices which, would allow interoperability among existing triage tool algorithms, the SALT workgroup, developed the Model Uniform Core Criteria (MUCC) for Mass Casualty Triage. The MUCC consists of 24 criteria of recommended elements of a MCI triage system (Table 1).
Table 1: Model Uniform Core Criteria for Mass Casualty (MUCC) triage
The criteria, if adopted into existing triage systems, would allow more for uniformity and interoperability between EMS responders from different jurisdictions upon arrival at an MCI site. As of 2011, 15 of the 24 MUCC essential elements are being used by existing triage systems; SALT is totally compliant with all 24 criteria.3
In recognition that current classification systems may not be accurate enough or properly mitigate subjectivity, several studies including those by ethicists and critical care specialists have suggested that, due to social, medical, and logistical variables, that only an experienced provider or a triage team approach should be utilized during the most difficult triage decisions.4,5,6 Additionally, very few studies have satisfactorily identified, compared, and discussed the actual real time decision-making criteria used by experience-rich providers, in order to create an accurate and usable prioritization algorithm for mass casualty events.7,8,9,10
To better understand both the reactive and situational awareness factors influencing the primary triage decision-making process among pre-hospital responders, both experienced and not, this study was designed to investigate and analyze those factors that actual medical providers during MCIs perceived that directly and indirectly impacted and influenced how their primary triage priority decisions were processed.
METHODS
To evaluate how triage decisions are initially processed, this study distributed an electronic survey to EMS and pre-hospital medical providers to help identify and rank the factors that influence primary triage decisions made by those with and without disaster experience. The survey questionnaire was designed by the authors, in English, to ascertain what attributes healthcare workers value and utilize when evaluating a patient for triage and treatment priority. The initial survey was piloted with a small sample of ten healthcare workers who work in an academically affiliated emergency department and have had previous disaster response experience. Based upon the feedback received, the final survey instrument was revised and the modified questions were entered into SurveyMonkey®. The survey was available on-line for 2 months (April-May 2010). The survey was then distributed electronically via a variety of methods: personal email addresses to disaster responders, emergency medicine and disaster listservs, and a hyperlink on a medical website frequented by prehospital EMS medical professionals (https://www.jems.com/articles/2010/05/mci-triage-techniques-survey.html). Respondents were not provided any financial or other incentives for participation. The survey study received approval by our hospital’s institutional review board prior to the start of data collection. Surveys that were not completed in their entirety were excluded from the final analysis.
The introductory paragraph described the intent of the survey, provided assurance of anonymity, and indicated that the approximate time to complete the survey would be less than 20 minutes (this was based on Beta testing of the survey on SurveyMonkey®). By survey design, all questions were required to be answered and the respondent could not advance without answering; The only exception was for specific stand-alone questions asking for opinion-based write-ins, if these were not answered, the respondent’s survey was still included.
General information required, aside from date of birth and gender included:
Patient attributes contributing to triage placement: Six patient and disaster attributes were to be ranked in the order of importance to the respondent (1-6 with 1 being the most important); to help that would determine the preferred ranking of these attributes by the respondent.
In addition, for those who claim prior disaster response experience, a comment box was added to allow for additional observations to be added besides the six listed attributes and/or factors that might influence the triage priority of patients.
RESULTS
Data Analysis
A total of 495 surveys were returned, with 92 deemed incomplete and thusly excluded from data analysis. The 403 completed surveys were analyzed using SAS 9.3 for Windows. Descriptive findings are presented as numbers, proportions, means, frequencies, and standard deviations. Respondents, for further analysis, were classified into three groups based on their disaster triage experience: no disaster triage experience (NoExp), performance of disaster triage without the “expectant” category (ExpNoExpectant) experience, and performing disaster triage with an “expectant” category, those people who are not expected to survive based upon logistical and or skill limitations. Those with “expectant category” (ExpBT) experience (n=47) were classified as the most triage experienced respondents of the three groups. Wilcoxon (non-parametric) tests compared mean rankings between the different triage experience groups. Bonferroni adjustments to the alpha level were made for 12 comparisons, and for these comparisons, alpha level was set at p<.004 (.05/12). Chi-square statistics were used to compare the dichotomous top four vs. lowest two rank order of the supplies/resource availability factor and of the patient age factor between the NoExp vs. ExpNoExpectant groups and between the ExpNoBT and ExpBT groups.
Fifty three percent of the 403 respondents were pre-hospital providers (Table 2).
Table 2. Self reported medical occupations of respondents, all of who worked in emergency management areas. (N=403)
Nearly all indicated that they practiced a structured triage approach (i.e., START, MASS, SAVE, STM, ESI) with 8% (32/403) reporting that they utilized an informal “gut feeling” triage methodology. The NoExp group comprised the majority, 60% (240/403), 29% (116/403) were in the ExpNoBT group, and 12% (47/403) were in the ExpBT group. Those in both the ExpNoBT and ExpBT groups, were able to expound on their personal disaster experiences. These included deployments to military conflicts, Oklahoma City bombing, 9/11 for both World Trade Center and Pentagon sites, and protracted disaster events such as hurricanes Katrina and Ike.
The mean (SD) ranking of each of the six-triage factors by the three experience groups is displayed in Figure 1.

Fig. 1: Mean rankings of triage factors by respondent’s disasters experience level.
‘Respiratory status, ability to speak, perfusion/pulse, and gut feeling’ factors were ranked in the top four by the majority of the 403 respondents. The mean rankings for five of the six variables (all but ‘gut feeling’) differed by experience groups and were all statistically significant depending on disaster experience (Table 3).
Table 3: Ranking differences of criteria separating experienced, black tag with and without disaster experience (163) vs. no disaster experience (240). (p<0.05 sig)
Though there were slight differences in the order of ranking, both groups had the same top and bottom three criteria choices with ‘supplies and age’ showing strong significance in their ranking placement differences. Further analysis with a series of nonparametric Wilcoxon tests comparing the factor rankings across each of the disaster experience group pairs found the following significant between-group comparisons: the NoExp group ranked the ‘supplies/resource availability’ factor significantly lower than did the ExpNoBT group who in turn ranked the ‘supplies/resource availability’ factor significantly lower than did the ExpBT group. The Z proportion of each of the three experience groups ranking ‘supplies/resource availability’ in the top four is demonstrated in Figure 2.

Fig. 2: Percent of respondents by triage experience category, who ranked ‘supplies’ in the top four choices.
The NoExp group had a significantly lower Z proportion ranking the ‘supplies/resource availability’ factor in the top four than in the ExpNoExpectant group (c2=7.2, df=1, p=.008), who in turn had a significantly lower proportion, ranking the ‘supplies/resource availability’ factor in the top four, than the ExpExpectant group (c2=7.1, df=1, p=.008). This statistical significance is important when reviewing resource utilization (‘supplies/resource availability’) considerations among the three groups. The ExpBT group employed ‘resource utilization’ based factors as important in disaster triage decision-making 62% of the time compared with ExpNoBT and NoExp groups, who employed it 39% and 25% of the time, respectively.
LIMITATIONS
Surveys are not strong science, with a sampling bias in this case due to the use of specific and limited access listservs, personal email lists, and web site visit. The results were analyzed as professionally pooled and therefore might be skewed toward the larger numbers of physicians, EMTs, and paramedics among the EMS providers surveyed. The electronic survey limited the pool of respondents to those willing and able to use and access the survey using a computer. The true potential response rate is unknown as the actual number of people who received an invitation via email list or listserv is unknown. The use of a convenience sample, such as we used, did not allow for us to have any control over who chose to respond. It is not an ideal method of gathering data, but in this case, it allowed for the survey to be distributed to a much larger geographic population to give a better sense of the triage provider population at large and was not cost prohibitive, as we only had to pay for the SurveyMonkey® annual fee of $400 U.S.. In addition, the top three ranked attributes (airway, circulation, and neurological status) are seen in START triage, possibly skewing their priority ranking due to the Hawthorne affect, where participants change behavior because they are aware of being observed. Moreover, the survey did not inquire whether triage decisions were made individually, or with assistance such as a team and this triage aspect will be included in subsequent studies.
DISCUSSION
Only in a perfect world would the ideal MCI triage system exist that accurately identified each casualty by severity and type of injury/illness, ensures that victims received the proper treatment and transport prioritization, and are delivered to appropriate medical care quickly and efficiently. Admittedly, in every mass casualty event patients who are able to leave the scene often do so often prior to EMS arrival. Those remaining are either dead, need an intervention to save their life, are still on scene because they cannot ambulate, or are rending bystander medical assistance; as was witnessed during the Boston Marathon bombing. Those victims left on scene, as organized first responders arrive, are evaluated, and often moved to a gathering location where more medical supplies or shelter is available (i.e. treatment tent in the Boston Marathon, I-10 causeway, Louis Armstrong international airport). It is here that transportation and other logistical considerations become additional factors that may impact triage decisions, all of which are an integral part of pre-hospital decisions. Interestingly, aside from SALT, no popular triage algorithm discusses patient movement, transport, and logistics.
Ideally, triage decisions, made without emotional input or bias, should be able to identify those victims likely to survive if taken to definitive care. However, the ranking of victims into severity and priority treatment categories makes triage dynamic and, depending on numerous external variables, can be an emotive activity that might skew priority categories, possibly introducing bias, leading to either under triage or over triage, which, as mentioned earlier, can cause an increase in mortality. Recently, Cross and Cicero compared six different triage systems and found that none worked well for every event with most resulting in over triage.11 Travers and colleagues suggest that triage systems providing the most reliable and effective patient outcomes have multiple triage categories, with the optimum number of five levels felt to be “safer, with greater discrimination, reliability and improved specificity”.12 This was independently supported by others such as Burkle whose triage levels include: immediate, delayed, minimal, expectant, and deceased as recommended for bioevent triage, and with ICU teams where physician seniority was considered a favorable independent factor in ICU admission criteria.5,13
Admittedly, triage is a fluid and dynamic process; it has multiple variables influencing the decision maker and should be adaptable to a myriad of situations. Most triage criteria endorsed by the American College of Surgeons, Emergency Nursing Association, and the American College of Emergency Physicians use a combination of physiological, anatomical, mechanism of injury, and special considerations categories to determine severity categorization.14,15 It is created as a step-by-step algorithm for the provider to follow to allow for the best patient transportation designation. However, triage is a very complex task that is dynamic, heuristic, and driven primarily by “provider judgment rather than specific triage criteria”.16 Newgard and colleagues further demonstrated the “independent predictive value” of the EMS provider’s judgment, a gut feeling-like primary triage criteria for identifying seriously injured victims, showing that the “cognitive reasoning processes encapsulated in this criteria can help in identifying seriously injured patients potentially missed by other triage criteria.”17
The purpose of this survey was to query practicing field experts and identify factors that for them affect their triage category placement of patients. The assumption made is that medical providers with practical experience in triage situations will prioritize different attributes for the sorting of patients compared to those providers with no disaster experience. These findings in turn, could provide more attribute weighting of the factors used create a more accurate triage algorithm. For example, in this study, the top ranked categories regardless of experience level were ‘cardiovascular’ and ‘neurological’ with those respondents with disaster experience placing a higher value on the ability of the patient to ‘speak’ than on the ‘cardiovascular’ criteria. This suggests that brain perfusion to the experienced triage provider is considered a good indicator of injury severity.
After the physiological attributes, in our rankings, ‘Gut instinct’ ranked forth, regardless of disaster experience level with 8% reporting, that they used it as their primary form of triage guidance. Instinct or gut instinct is related to experience, which is a part of expert knowledge, and is very effective in cases of complex decisions such as triage.18 In the nursing literature, much has been written about experience and instinct in patient care, with an acceptance that experience creates ‘intuition’ which guides recognition of subtle deterioration and subsequent appropriate nursing action.19 In the prehospital literature the support of ‘gust instinct’ has been mixed. A review of the earlier prehospital triage literature is varied, with some studies suggesting that provider judgment is effective in increasing the sensitivity of triage.16,20,21,22 Other papers suggest it has no affect at all, which could be due to a lack of overall provider experience.23,24 There have been two large retrospective trauma studies examining prehospital triage and destination assignment to determine what historically prehospital providers have used for decision-making. These analyzed a three year period where >250,000 injured person were transported; 36% of the time, EMS provider judgment was the most commonly used triage criterion.17,25 This is further supported in a variety of published case reports which have noticed that ‘gut instinct’ played an enormous role in correctly assigning triage criteria to patients.16,17,18,25,26
Supplies ranked 5th amongst the 403 factors analyzed, in toto, was found to rank in the top three in 68% of responses when subset analysis was performed on those claiming prior disaster experience. Other than being used in the SACCO scoring system, this factor is not part of the most popular triage algorithm decision trees, but is part of the MUCC criteria and SALT system.27 When the write-in sections were reviewed, respondents with Expectant Category experience “wrote in” that the reason for the placing of patients in the expectant category was due to the lack of ‘supplies/transportation’. This pivotal point is not unique to the pre-hospital or disaster arena. It has been described often in the critical care literature, where, during times of resource limitations in critical care units, patients who normally would meet admission/treatment criteria are refused a bed in favor of patients with a perceived more favorable set of sociological and medical parameters that might predict a better outcome.26,28,29,30
This document supports the MUCC, as it provides an additional framework for the development of local and adaptable triage algorithms that include resource availability, sorting, lifesaving interventions, and individual patient assessment endorsing five triage categories. From the MUCC came the resulting CDC endorsed SALT triage (Figure 3)

Fig. 3: SALT Triage
as an example of a disaster triage algorithm and is presently taught as part of the National Disaster Life Support (NDLS) course series. Triage is a fluid and dynamic process; it has multiple variables influencing the decision maker and should be adaptable to a myriad of situations
CONCLUSION
Based upon this survey analysis, respondents both with and without direct disaster triage experience identified and ranked triage attributes that support the MUCC guidelines. What appears to best support a balanced disaster mass casualty triage system and considered the most important factors among the surveyed respondents are ‘neurological/cardiovascular’ condition, ‘resource availability’, and the personal attribute of ‘gut instinct’. In addition, decision making in primary triage of a MCI scenario is multifactorial and encompasses life saving interventions, patient mobility, situational instincts and logistics all considered as critical components of a triage scheme that needs more study and analysis. Consensus places experience during MCIs as very important. Based on the success of this survey, the designed electronic survey tool is considered reliable for a second stage international EMS qualitative analysis study of factors influencing primary triage decisions.
Competing Interests
The authors have declared that no competing interests exist.
Data Statement
All relevant data are available within the paper.
Abbreviations
ARC: American Red Cross
CDP-Noble: Center for Domestic Preparedness-Noble Training Center
ESI: Emergency Severity Index
FEMA: Federal Emergency Management Agency
MASS: Move Assess, Sort, Send
NDLS: National Disaster Life Support
SALT: Sort, Assess, Lifesaving Interventions, Treatment/Transport
SAVE: Secondary Assessment of Victim Endpoint
START: Simple Triage and Rapid Treatment
STM: Sacco Triage Method
Method: A systematic search of the academic literature was undertaken utilising six electronic databases (EBSCO, Medline, PsycINFO, Embase, ERIC and CINAHL) using terms that relate to: teacher-mediated and school-based interventions; children and adolescents; mental health and wellbeing; natural disasters and man-made disasters. This was supplemented by a grey literature search.
Results: A total of 20 articles reporting on 18 separate interventions were identified. Nine separate interventions had been evaluated using methodologically adequate research designs, with findings suggesting at least short-term improvement in student wellbeing outcomes and academic performance.
Conclusions: Although none of the identified studies reported on Australian-based interventions, international interventions could be adapted to the Australian rural and remote context using existing psychosocial programs and resources available online to Australian schools. Future research should investigate the acceptability, feasibility and effectiveness of implementing interventions modelled on the identified studies in Australian schools settings.
]]>Background
The impact of disaster in Australia
Between January 2010 and January 2015, Australia experienced 31 natural disasters including cyclones, floods, storms, tornados and bushfires1. While all Australians are impacted by natural disasters, those in rural and remote communities are at increased risk of experiencing one or more natural disasters in their lifetimes2. A national strategy for disaster resilience has been developed to guide the planning and implementation of prevention, preparation and recovery efforts3. As understanding of the psychological impact of natural disasters has developed, so to have the range of responses addressing these impacts4. However, the implementation of responses (including psychological support responses) to sudden onset disasters is associated with different challenges compared to responses to gradual onset disasters (e.g. chronic weather events) or man-made disasters.
For the purpose of this article, natural disasters refer to sudden onset of significant environmental events, including bushfires, flood and cyclones. Man-made disaster refers to war or terrorist-related activities, rather than human induced environmental disasters such as oil spills or environmental degradation.
Child and adolescent mental health following a disaster
The trauma that children and adolescents may experience as a result of disasters is widely explored5,6 and the resultant emotional and behavioural adjustments that can be triggered by a traumatic experience well known. Increased rates of depression and anxiety among children following a natural disaster have been reported7 with some evidence of symptoms persisting over time8. Additionally, research conducted in Australian schools in the aftermath of bushfires identified elevated rates of post-traumatic stress disorder (PTSD) among students9; a finding comparable to global PTSD rates among children who have experienced a range of other natural disasters 10,11,12. Exposure to man-made disasters, such as war and terrorism, may also elicit PTSD symptoms among children and adolescents.13
Children who are diagnosed with PTSD often report a decrease in post-disaster quality of life14 These responses to trauma can emerge as negative classroom behaviours, including poorer grades, difficulty concentrating and disruptive behaviours15,16. There is growing recognition of the need for supportive interventions targeting child and adolescent mental health and other behavioural outcomes after a disaster 17,18.
The rationale for school-based, teacher-mediated interventions in Australia
It has been argued that teachers are ideally placed to deliver post-disaster mental health programs and support to their students in the school setting19 for a number of reasons. Schools play a key role in the aftermath of a disaster20, and are often used as relief sites, community information hubs or supply depots21. Additionally, schools are typically one of the first organisations to resume operations after a disaster, and can provide students with a sense of returning to normality22. Through their existing network of teachers, parents, peers and students, schools provide a non-stigmatising setting for seeking and receiving psychological support19,23. This has particular relevance in rural and remote areas of Australia, where access to health resources are traditionally limited.1,19
In Australia, the school setting is increasingly used to deliver support programs for students who experience trauma associated with family breakdown or the loss of a loved one. The Seasons for Growth program is an example of this24. There have also been increasing efforts by schools to implement programs to support and address other aspects of youth mental health such as youth depression and drug and alcohol use, with programs including MindMatters25 and KidsMatter26. Although disaster education is included in the Australian curriculum, a recent study conducted by Dufty27 highlighted further opportunity for the inclusion of disaster resilience strategies.26
Objectives
The primary aim of this review was to identify describe, and determine the effectiveness of, school-based teacher-mediated interventions developed to support child and adolescent mental health and wellbeing following either a natural disaster or a man-made disaster. The secondary aim was to identify interventions conducted in or relevant to the Australian rural and remote schools.
Method
Search strategy
This review was conducted in accordance with the PRISMA guidelines for systematic reviews.28
Eligibility criteria
All literature identified by our search as reporting on school-based, teacher-mediated interventions to support child and adolescent recovery after a disaster was included in the review. Studies were included if they clearly described that the intervention was delivered by the classroom teacher to their students or if they described an intervention for teachers, and/or reported the outcomes of these interventions on students or the teachers. Interventions facilitated by therapists/counsellors or other health professionals in partnership with teachers were excluded, as these were not considered to be relevant to the Australian rural or remote school context. All study designs were included as long as they met the above eligibility criteria. No restrictions on the start date of the search period were imposed; the end date of the search period was July 2013, which has been subsequently updated to January 2015. The search was restricted to English language and peer-reviewed journal articles. No further search restrictions were applied.
Information sources
Six electronic databases were searched: EBSCO, Medline, PsycINFO, Embase, ERIC and CINAHL. These databases were chosen due to their target audience; health, psychology and education.
Search strategy
Each database was searched using terms that relate to: teacher-mediated and school-based interventions; children and adolescents; mental health and wellbeing; natural disasters and man-made disasters. For example, the specific search terms used in the EBSCO database were: (teacher mediated OR teacher led OR teacher based OR school based OR school led OR community based OR social support) AND (child OR children OR adolescent OR child, preschool OR teenagers) AND (grief OR anxiety OR stress, psychological OR stress disorders, post-traumatic OR depression OR trauma OR coping OR mental health OR wellbeing OR social capital OR resilience OR connectedness OR adaption, psychological) AND (disasters OR natural disaster OR bushfire OR wildfire OR floods OR cyclonic storms OR cyclone OR earthquake OR tsunami OR man-made disaster OR terrorism OR terrorist attack OR war OR civil war).
Study selection
All identified articles were added to an Endnote library. Duplicates were removed using the Endnote “remove duplicates” function, and through manual scanning. Based on titles, articles returned in the search that were clearly not relevant were excluded. The remaining articles were assessed based on abstracts and key words, and excluded if they did not meet the inclusion criteria. If no abstract was available full text articles were retrieved and reviewed to assess relevance. If there was uncertainty regarding article inclusion, a co-author was consulted until agreement was reached.
Data items
Data extraction tables were used to record characteristics of included studies. Studies were grouped as being relevant to either 1) natural disaster events or 2) man-made disaster events. Additional data extraction items and grouping/classifications applied to studies included: a) Study design;b) Disaster of interest; c) Participant characteristics; d) Intervention characteristics; e) Teaching training characteristics; and f) Results. In order to make a judgement about the effectiveness of the identified interventions, articles were then categorised based on whether the study design conformed to Effective Practice and Organisation of Care (EPOC) guidelines29. For studies that met EPOC research design criteria, information on measures, length of follow-up and direction and significance of study outcomes were extracted. Due to the heterogeneity of outcome measures across studies, the findings were not deemed to be suitable for synthesis via meta-analysis.
Risk of bias
Risk of bias was assessed for each study meeting the EPOC criteria, utilising the suggested risk of bias criteria for EPOC reviews29. Two reviewers assessed each article separately, before comparing their results. Consensus was reached for each study.
Grey literature search
Additional to the database search, a series of Google searches were conducted during July 2013, and subsequently updated in January 2015 to explore resources currently available to teachers online. Google searches used simplified combinations of the electronic database search terms, with a focus on Australia; for example ‘disaster resources Australia teachers’. While the limitations of this grey literature search strategy are acknowledged30, the search aimed to develop an understanding of the types of disaster resources that are accessible to Australian teachers, and not to provide an exhaustive resource. The resources were classified by a) organisation; b) specific type of disaster; c) description of resource; and d) web link to resource.
Results
Study selection
Figure 1 describes the process of article identification, screening, and full text article retrieval and assessment for inclusion. A total of 1652 articles were retrieved, of which 20 articles reporting on 18 separate interventions were deemed relevant to this review.

Fig. 1: Process of selection of papers for review
Included peer-reviewed papers
Of the 20 articles, nine described seven interventions following a natural disaster and 11 articles described interventions in response to man-made disasters. The 18 interventions broadly fell into one of two categories: They either a) reported on the implementation of the intervention in the classroom and its outcomes for students (n = 12), or b) reported on the process of training teachers (n= 6). None of the interventions identified were conducted in Australia. Each intervention (categorised as being a response to either a natural or man-made disaster) is outlined in Table 1.
Table 1 – Identified Interventions
Studies with EPOC designs
Table 1 indicates that nine of the 18 studies were deemed to meet EPOC design criteria, and Table 2 summarises the findings of these nine studies. Three studies related to natural disasters (2 classroom-based, 1 teacher training) and 6 studies related to man-made disasters (5 classroom-based, 1 teacher training).
Study characteristics
Of the three studies focusing on natural disasters that met EPOC research design criteria, one focused on outcomes for teachers with the study31 reporting an intervention effect on teacher’s professional self-efficacy and a range of other outcomes (see Table 2). The two classroom based interventions reported on general child-functioning outcomes (including academic performance and social behaviour) described intervention effects19,32,33. Although there was some evidence of short-term intervention effects on mental health outcomes (including PTSD symptomology) in these studies at 3-months follow-up19,33, no effects were found 3-years post-intervention 32 (see Table 2).
Five out of the six studies focusing on man-made disasters that met EPOC research design criteria reported data on child and adolescent mental health outcomes. As seen in Table 2, all studies reported reductions in PTSD symptomology 34,35,36,37, and a range of other mental health and functional/behavioural outcomes. One study indicated that three students in the intervention group actually developed PTSD during the course of the intervention36, however this outcome was not attributed to the intervention. The only study reporting any contraindication for an intervention was Wolmer et al. 37, where the grief outcomes worsened post-intervention (see Table 2).
Risk of bias
Risk of bias was assessed using EPOC guidelines29 More than half of the EPOC studies were categorised as high or unclear risk in the domains of sequence generation and allocation concealment, primarily due to their study design. Additionally, in the domain of ‘other sources of bias’ unclear risk was given to all studies as they did not address other possible areas of bias and assessors could not adequately judge if bias occurred. For example: it was unclear if students from control and intervention groups interacted about the program while it was underway, or if teachers in the control who received the training but were told not to implement it, either inadvertently or consciously delivered the training to students. All studies were scored either low or unclear risk on the remainder of the risk of bias domains (see risk of bias table 3).
Resources available to Australian schools
Table 4 details the disaster resources provided by government and non-government organisations in Australia and New Zealand that were identified through the grey literature search. The resources fall into three categories: 1) information and fact sheets for teachers; 2) lesson plans and interactive resources to be implemented in the classroom; and 3) teacher training. Some resources are disaster-specific (e.g. bushfires), while others are more general. Almost all resources focused on natural disasters. Please see Supplementary Table 1 for further detail about these resources, including URLs. The grey literature search did not return any of the included studies in this review.
Discussion
We identified seven school-based teacher-mediated interventions that were developed to support child and adolescent mental health and wellbeing following a natural disaster, and 11 following a man-made disaster. Eight interventions were evaluated using methodologically rigorous designs, reporting significant short-term intervention effects on some student outcomes (including reduced psychological symptomatology and increased academic performance) and teacher outcomes (including increased personal and professional self-efficacy). Although none of the identified interventions were conducted in Australia, there is potential to adapt effective international models, drawing upon nationally relevant disaster recovery resources that are freely available online.
Description of the identified interventions
The greatest disparity evident between interventions responding to natural versus man-made was commencement time. Natural disaster interventions commenced immediately to 15 months after the disaster, while interventions targeted at man-made disasters were implemented across a broader timeframe. Differences between natural and man-made disaster interventions were also evident in their reported outcomes. Natural disaster targeted interventions more often reported behavioural changes, while man-made disaster interventions reported clinical changes and behavioural changes. Behavioural changes may be most relevant to teachers if they assist school performance and do not require clinical knowledge.
Interventions were categorised according to their intervention type as either classroom based or teacher training with there being slight differences between these two categories (see Table 1). Classroom based interventions involved the classroom teacher delivering class sessions lasting between 45 minutes to two hours, which occurred on a regular basis over a number of weeks. These sessions focused on building resilience and coping strategies and included play therapy, activities to develop emotional awareness, conflict resolution, drama games, and cooperative learning, the timing of the implementation of the intervention relative to disaster onset and the duration of the interventions varied. Comparatively, teacher training interventions reported on the process of training teachers in disaster preparedness and response and provided the tools and resources to use personally or in the classroom. These were most often facilitated by mental health workers. A number of studies reported using the ‘train the trainer’ technique, which was often used to reach a large number of schools and students. All teacher-training articles focused on the goal of providing the teacher with the tools and resources to support their own recovery and to implement a mental health program in their classroom without the need for external services running the ongoing program.
Effectiveness of the identified interventions
Of the interventions that were evaluated using an EPOC endorsed rigorous research design, positive findings suggest that the identified interventions may be effective for improving teacher self-efficacy and student academic, mental health and wellbeing outcomes, at least in the short term. Based on heterogeneity of intervention components, outcomes measures and follow-up periods, we were unable to determine which particular interventions characteristics were associated with which outcomes. Further methodologically rigorous research assessing similar outcomes is required before conclusions can be drawn about intervention effectiveness.
Relevance of the identified interventions to the Australian context
Despite none of the interventions being conducted in Australia, a number of the interventions reported here were based on a particular disaster-recovery strategy (for example ERASE-Stress 31,33,34,36), which was applied to different cultural contexts and disasters. Potentially these strategies could also be adapted to the Australian context. There are a number of online resources available to Australian teachers from reputable sources, including a number of Australian government departments and Non-Government Organisations. The recent redevelopment of MindMatters for use in secondary schools is one such example. MindMatters provides online resources and guidance for schools in developing and implementing mental health strategies applicable to their individual school environments38. Online resources often focus on developing students’ psychosocial skills, such as increasing resilience. Given that most of the interventions identified in this review similarly aimed to develop resilience, general online resources with a focus on building resilience and wellbeing could potentially be used by teachers post-disaster in the absence of an Australian specific intervention. As highlighted in the introduction, programs such as these are already used in schools to address other aspects of mental health and wellbeing; post-disaster implementation may be feasible.31,33,34,36,37
Consultation with teachers to identify their needs (both personal and professional) after a disaster may be the most logical next steps for this area of investigation. Consultation with Aboriginal communities would also be a crucial aspect of any intervention development. Further investigation into resources available to Australian teachers, particularly the usefulness of these resources and their ability to be implemented into the classroom may also prove beneficial. A recent study has found that approximately 50% of the teachers sampled felt that they do not have enough time to meet the mental health needs of their students39. Thus, consultation may help ensure that teachers would not be over-burdened with complex intervention strategies that require high level mental health training, and allow greater integration into the classroom environment.
Review limitations
Publication bias may be evident as none of the included studies reported significantly negative findings. Further, due to the difficulty of implementing and evaluating interventions in a post-disaster environment there may be interventions with successful and positive outcomes that have not been reported in the peer-reviewed literature. Many non-relevant studies were also identified through the search procedures employed. A preoccupation with PTSD was evident and the authors acknowledge the need for broader strategies addressing issues above and beyond PTSD are essential. As the inclusion criteria was limited to interventions that describe teachers delivering the support program interventions may have missed that have other school staff delivering the program. It is worth noting that if the school has resources, including other staff such as chaplains or school counsellors that can be trained to deliver interventions may be an option for some schools.
While our search criteria sought to capture teacher mediated class room based interventions we acknowledge that interventions may have been missed using such a strict search strategy. Interventions such as the Classroom-Based Intervention (CBI)40, which highly involve teachers and schools during the development and delivery but used CBI trained guidance counsellors to deliver the classroom sessions with the support of teachers, have been missed using this search strategy. These types of studies are relevant to the field and provide evidence and support for classroom based disaster recovery programs.
We have defined man-made disaster as war or terrorist-related activities, rather than human induced environmental disasters such as oil spills or environmental degradation. Although no interventions were identified which specifically addressed human-induced environmental disasters, it may be possible that our selection of search terms may have inadvertently excluded any literature discussing these types of disaster interventions. Additionally, drought was not included our search terms as it is not currently considered a natural disaster in Australia under the Australian Government’s Natural Disaster Relief and Recovery Arrangements41. Further, responses to chronic weather events, such as drought, differ from responses to sudden onset natural disasters42.
The grey literature search identified resources related to resilience and wellbeing from organisations such as Beyond Blue and KidsMatter. While these resources are readily available to schools, as they were not disaster recovery specific they were not reported in this review. However, as resilience building and increasing wellbeing are often the focus of disaster recovery interventions, programs such as these could be included in future research exploring resources available to teachers post-disaster.
Conclusion
Teacher-mediated interventions may have the potential to improve child and adolescent mental health after a disaster, although findings are inconclusive. International studies provide a useful guide for the development, implementation and evaluation of teacher-mediated disaster-response mental health programs for Australian schools. Further investigation is necessary before conclusions can be drawn about the applicability of these identified international interventions to the Australian rural and remote context. In the absence of recommendations for evidence-based teacher-mediated disaster interventions, resources aimed at increasing resilience and wellbeing may be useful for teachers attempting to manage disaster recovery in their classrooms, particularly in rural and remote locations where provision of services by mental health professionals is lacking.
Competing Interest
The authors have declared that no competing interests exist.
Appendices
Background
In the 21st century, we live in a world regularly affected by emergencies[1], often with severe local and regional health consequences. Recent examples include the devastating hurricanes and floods in the US, Australia and Pakistan; earthquakes in Haiti, Japan, and New Zealand; and the conflict in Syria. In the context of climate change and corrosive political instability in many world regions, it is unlikely that we will see a reduction in disastfers[2] or their resulting health impacts.
Simultaneously we are witnessing an increase in the burden of noncommunicable diseases (NCDs), including, but not limited to, heart disease, diabetes, cancers and chronic lung diseases. This phenomenon is not only visable in aging populations, but now too in younger populations secondary to the obesity epidemic and more sedentary lifestyles. Described by UN Secretary General Ban Ki-Moon as a “public health emergency”, NCDs are already the world’s leading cause of death. The diseases are estimated to be responsible for over 60% of global mortality each year with 80% of these deaths occurring in low- and middle-income settings1. In addition, NCDs now contribute 54% of global Disability-Adjusted Life Years Lost with a majority of this burden afflicting developing countries2.
NCDs also act as a barrier to economic development and equity causing financial and social stress3,4,5. In 2005, NCDs cost the Indian economy an estimated US$9 billion with an estimated 2 million people experiencing ‘catastrophic’ spending as a result of cardiovascular disease and cancer6.
While it is widely accepted that emergency situations render this vulnerable population increasingly susceptible to overcrowding, inadequate sanitation, poor shelter, insufficient food supply and disruptions to healthcare services3,7,8, few interventions are specifically aimed to mitigate these effects. These factors can also interact synergistically to result in an increased incidence of NCDs as well as progression of existing disease. In this light, NCDs are a poverty-cycle catalyst, exacerbated during a disaster.
During and following emergencies, there is often a fragmented approach to health intervention and coordination. Health authorities may not have the capacity to monitor and evaluate efforts and there is no single agency with the tools, resources and authority to take up this role9. Health systems can be compromised and health policy formulation disrupted8,10. Population health needs escalate and humanitarian personnel enter the arena to provide essential services9,11.
Research has been conducted and guidelines developed for the acute phase of disasters however these primarily focus on communicable diseases such as measles and diarrhoeal disease 12 . Limited research has been conducted into the short and long-term impacts and management of NCDs. There is a resulting paucity of NCDs in operational emergency guidelines and policies, for example:
The outcome is greater morbidity resulting from a lack of evidence-based guidelines and a resulting healthcare gap for populations with chronic diseases during and following emergencies. This gap, and the resulting morbidity, is yet to be sufficiently quantified.
The Result of Noncommunicable Diseases in Emergencies
When considering NCDs and emergencies, the focus should be on the overall goals of the health response, particularly in the acute phases of an emergency. Effective emergency action can avoid the escalation of an event into a disaster. Emergency management involves plans and institutional arrangements to engage and guide the efforts of government, non-government, voluntary and private agencies in comprehensive and coordinated ways to respond to the entire spectrum of emergency needs. Its goal is directed towards avoiding excess morbidity and mortality (UNISDR).
There are several ways in which excess morbidity and mortality related to NCDs during emergencies and disasters might occur, for example:
a) Persons with NCDs are more vulnerable in emergencies and disasters
For individuals with NCDs, their condition may deteriorate as a direct result of the emergency. They are less able to cope without access to adequate nutrition, medications and follow-up7,11,15. This includes individuals living with disabilities. For example, people with diabetes may loose glucometers and insulin stock, lacking essential back-up supplies8. Dialysis centres may be destroyed and home healthcare services may not be operational10.
b) Emergencies exacerbate NCDs leading to acute complications
Many NCDs require close and sustained interaction with health systems and providers. During and following an emergency, this is often not possible. Due to interruptions in access to care and medications, acute exacerbations of NCDs can occur16,17. Common examples include exacerbations of chronic respiratory diseases and infectious ulcers in persons with diabetes mellitus8. Conditions that caused little or no impact on activities of daily living may deteriorate causing not only greater morbidity through debilitating symptoms but also loss of income, security8,10, limb or life.
c) Long-term implications of NCDs resulting from emergencies and their management
The morbidity and disability associated with NCDs is normally life-long. Therefore, suboptimal management during and after a disaster not only has immediate health effects, but can also have lasting social and health ramifications. A lack of appropriate care for even a short period can result in greater levels of chronic morbidity and suffering, as well as poverty entrenchment3.
d) The multifaceted impact of NCDs and emergencies
Developing countries are often disproportionately burdened by both NCDs and disasters in comparison to higher income countries18. Developing countries face the greatest burden from global and regional conflict as well as increased vulnerability to the effects of climate change and natural disasters. Many of these situations are exacerbated by the increasing levels of urbanisation and slum-populations. Additionally, the “double burden”19 of disease also contributes to the multifaceted impact of NCDs and emergencies.
NCDs in Emergencies and Disasters: A Way Forward
In order to address the problem of NCDs in emergencies and minimise excess morbidity and mortality, the authors of this paper suggest:
1. Comprehensive review of the current scientific literature
A full and comprehensive review of the current global scientific literature relating to NCDs in emergencies and disaster situations is needed in order to build evidence-based policies and guidelines. Existing research should be evaluated, allowing for assessment of current interventions and identification of future interventional possibilities. In recent years, there have been several efforts to try and coordinate information, needs assessments, and disaster response, such as the efforts by the Cochrane review with EvidenceAid. Although admirable, these efforts continue to exclude specific focus on management of chronic diseases in disaster response at present.
Uniquely, a full assessment of evidenced-based practice in assessing and treating chronic disease in disaster may not be plausible in the classical sense since this is more of a “modern era epidemic.” In decades past, chronic diseases did not affect the sheer number of people that they do now, nor did they present as a pressing consideration during a disaster. As a result, it will be vastly important to also collect and assess anecdotal evidence from first responders, humanitarian organisations, and governements who have recently experienced a large scale disaster to be able to fully understand the scope of chronic diseases in disaster and emergency settings.
2. Increased awareness of the importance of NCDs in emergencies
Greater advocacy and awareness surrounding NCDs and emergencies is vital. Discussion of NCDs specific to emergency response at the global level is imperative, as well as appropriate allocation of funding specific to chronic disease in disaster. Strides towards this have indeed been underway in venues such as the Geneva Health Forum, the American Public Health Association, as well as organization specific fora such as the Red Cross Movement and Medecins sans frontieres. Over the last couple of years the authors of this article have involved themselves in all of the above, supporting the discussions.
3. Increased research on morbidity and mortality patterns during and following an emergency
Further research is needed with regard to the patterns of morbidity and mortality related to NCDs in emergencies. Acute complications, long-term complications and disease progression need to be qualified and quantified. Health outcome assessments of disasters should incorporate NCDs as a factor impacting the current and potential health problems in a population affected by a disaster along the proposals made during the 15th World Congress on Disaster and Emergency Medicine in Amsterdam (2007) regarding assessing the public health dimension of disasters.
One viable option would be the establishment of a coordinated, international, open database focusing on the epidemiology of NCDs during and following emergencies around the world. A platform for government, academic, NGO and IGO data, this could serve as a timely, efficient and effective source of valuable evidence for policy and practice26.
4. Incorporation of NCDs into existing emergency-related policies, standards, and resources
NCDs should be incorporated into publications and operational guidelines and resources including the Sphere Handbook 13 and the Interagency Emergency Health Kit 14,20,21 . These must be readily available to those working within emergency situations.
Disaster risk reduction plans aiming to avoid, lessen or transfer the adverse effects of hazards through activities and measures for prevention, mitigation and preparedness (UNISDR) should assess and integrate the role of NCDs as a factor increasing the vulnerability of the population exposed. In this regard, the United Nations-endorsed Hyogo Framework for Action and the International Strategy for Disaster Reduction (ISDR) should recognize NCDs as a threat to achieve their expected outcomes to reduce losses related to disasters.
5. Development of technical guidelines on the clinical management of NCDs in emergencies and disaster situations
Guidelines, which take into account the practical problems associated with NCDs in emergencies are essential21. These could include partnerships and protocols for the supply of medications such as established by the International Diabetes Federation on insulin supply during emergencies and disasters (https://www.idf.org/insulin-diabetes-supplies/emergencies-and-disasters).
6. Greater integration and coordination in health service provision during and following emergencies
The integration of NCDs into emergency healthcare provision during and following emergencies is imperative. Collaboration between existing health infrastructure, the healthcare system and humanitarian assistance would improve the sustainability of efforts22. This does not require the duplication or reinventing of response efforts. Rather, an intelligent and collaborative approach learning from experiences relating to communicable diseases23. For example, health clinics and supply chains created for the treatment of malaria or diarrhoeal diseases should be capitalised in their potential to simultaneously avert excess suffering and disease from NCDs such as diabetes24 .
7. Integrating NCDs into practical and academic training of emergency workers and emergency-response coordinators
High-quality courses are required in order to build community-level, government and organisational capacity in the field of NCDs during and following emergencies and for disaster risk reduction planning. These courses should be practical, evidence-based and affordable to participants from every socio-economic background. Here again, several of the authors have been involved in developing such training.
Our Call to Action
We call upon healthcare professionals, communities, organisations and governments to further understand and address the structural determinants of NCDs in emergency and disaster situations.
We urge governments, non-government organisations and intergovernmental bodies to allocate specific resources for the prevention and management of excess morbidity and mortality from NCDs in emergencies and disasters on a scale which reflects the magnitude of this health issue.
We call on the international research, humanitarian and governing sectors to recognise and address NCDs in emergency and disaster situations and produce evidence-based, global technical guidelines for the management of NCDs in emergencies and disasters. NCDs should not have a token inclusion, but rather a meaningful and integrated one that addresses the care gap for this vulnerable population.
Footnote
[1]For the purposes on this publication, emergencies include natural disasters, conflicts and technological disasters, or a combination, which result in major loss of life in a population and disruption to healthcare.
[2]In this publication, disaster refers to a serious disruption of the functioning of a community or a society involving widespread human, material, economic or environmental losses and impacts, which exceeds the ability of the affected community or society to cope using its own resources. Disasters are often described as a result of the combination of: the exposure to a hazard; the conditions of vulnerability that are present; and insufficient capacity or measures to reduce or cope with the potential negative consequences. Disaster impacts may include loss of life, injury, disease and other negative effects on human physical, mental and social well-being, together with damage to property, destruction of assets, loss of services, social and economic disruption and environmental degradation”25.
Competing Interests
The authors of this paper declare no conflicts of interest.
1. Introduction
The 2010 floods in Pakistan began as a result of unprecedented monsoon rains overwhelming the Indus basin. The ensuing floodwaters affected 78 out of 121 districts nationwide engulfing an area of 100,000 km2. The floods claimed 1985 lives, affected 20.2 million people, damaged 2.4 million hectares of agricultural land and damaged or destroyed 2.1 million houses and 515 health facilities.1 Indiscrimate damage was caused to state infrastructure including: transport and communication networks, water and irrigation channels, power and energy plants and grids. Over 37 million medical consultations were reported by the Disease Early Warning System (DEWS) within one year following the floods with acute respiratory infection (23%), skin diseases (11%), acute diarrhoea (9%) and suspected malaria (6%) forming the most common presentations in flood affected districts.2
ReliefWeb, an online database administered by the United Nations Office for the Coordination of Humanitarian Affairs (OCHA), provided humanitarian information to organisations and interventionists during the floods. The database was continuously updated with situational reports and bulletins by various stakeholders (e.g. UN agencies, NGOs) and enabled the humanitarian community to assess need and mobilise response to the disaster accordingly. However, much of the information published on the ReliefWeb database was fragmented and the number of summary reports documenting the floods in a holistic manner was limited. Furthermore many of these reports exhibited an inconsistency in format and content that did not follow a standardised method for reporting. Therefore their expediency to humanitarian organisation and interventions – although advantageous – can be probed.
Kulling et al. (2010) have proposed guidelines promoting a common structure and method for reporting health crises and critical health events. These guidelines require reports to include assessments of the status before the event, a description of the disaster and the subsequent damage, the relief and recovery responses to the events and identification of lessons that can inform preparations and interventions in future crises. Therefore a concise report on the Pakistan floods of 2010 based on key principles described by these guidelines can serve as a useful resource in analysing summary findings that may help to improve preparedness, planning and response for future crises whilst advancing international collaboration and learning.3
2. Methodology
This summary report is based on the key principles of health crisis reporting described by Kulling et al.3 The main focus of this paper is to provide a summary focus on the pre-flood status of Pakistan, the impact of the floods and the subsequent response efforts by the humanitarian community. All the data included in this report are available in the public domain. As academic literature on recent floods in Pakistan have proved to be scarce and fragmented, a literature search was conducted using multiple search engines and databases to enable a wider inclusion, and therefore consideration, of primary data for this report. Search terms synonymous with “Pakistan floods”, “Pakistan floods 2010”, and “Pakistan floodwaters” were employed. An initial literature search was conducted on the PubMed/Medline databases and all resulting and related papers and references were extracted and analysed. Reliefweb, a database of humanitarian information maintained by the United Nations Office for the Coordination of Humanitarian Affairs, was used to collect all information related to Pakistan floods of 2010. Bibliographies of reports and articles were followed and extracted. Information and literature available on stakeholder websites including UN agencies, governmental departments, non-governmental organisations and academic institutions were studied. A wider search of grey literature was carried out on the internet.
Inclusion and Exclusion criteria: All information from frontline sources involved in the Pakistan floods including UN organisation, governmental departments, non-governmental organisation and academic institutions were considered. However, newspaper and journalistic report articles were excluded.
This report forms part of a research project that I undertook as part my medical studies at Barts and The London School, University of London. I received supervision from Dr Paul Wilkinson of London School of Hygiene and Tropical Medicine and Professor Virginia Murray of Extreme Events and Health Protection at Health Protection Agency UK. This report was not funded or allied with any governmental or non-governmental organisation.
3. Pre-floods
3.1. Country Profile
Pakistan covers an area of 796,096 km2 and stretches from the Himalayan Mountains in the north to the Arabian Sea to the south. The country shares borders with Afghanistan and Iran in the west, China in the north-east and India in the east; and is made up of four large provinces: Balochistan, Khyber Pakhtunkhwa, Punjab and Sindh; and also a small federal capital territory and a group of federally administered tribal areas. Pakistan has a total population of over 178 million people.4 The Gross Domestic Product (GDP) of Pakistan is US$ 841 per capita with government expenditure on health of US$ 7 per capita forming a total expenditure on health of 2.9% of GDP.5
3.2. Climate
Pakistan’s climate is predominantly semi-arid to arid and is typically characterised by hot summers and cool or cold winters. The northern mountainous and hilly regions of the country are cooler than the warmer and topographically flat regions of the south. Pakistan, depending on geographical location, weathers four seasons: a cool and dry winter period (December to February), hot and dry spring (March to May), rainy summer or monsoon period (June to September) and a retreating monsoon period (October and November).6 The annual rainfall in the northern parts of Pakistan receives less than 250 mm per year as compared to 125mm in the south. Rainfall during the monsoon rains, which accounts for 59% of annual fall, can increase to 750mm in the plains and 625mm in the highlands.7,8
3.3. The Indus River
The Indus River originates in Tibet and travels westwards through India and Kashmir before entering Pakistan through the northern mountains. It then runs southwards through the centre of the country before emptying into the Arabian Sea. The basin stretches approximately 3,000 km in Pakistan and covers an area of 977,000 km2 (approximately 25% of total land mass). The river sources its water from annual rainfall, glacier melt from the northern mountains and a number of large tributaries including Shigar, Shyok, Gilgitm and Kabul rivers from the northern province and the larger Beas, Chenab, Ravi, Jhelum and Sutlej rivers from the Punjab province (Figure. 1).9
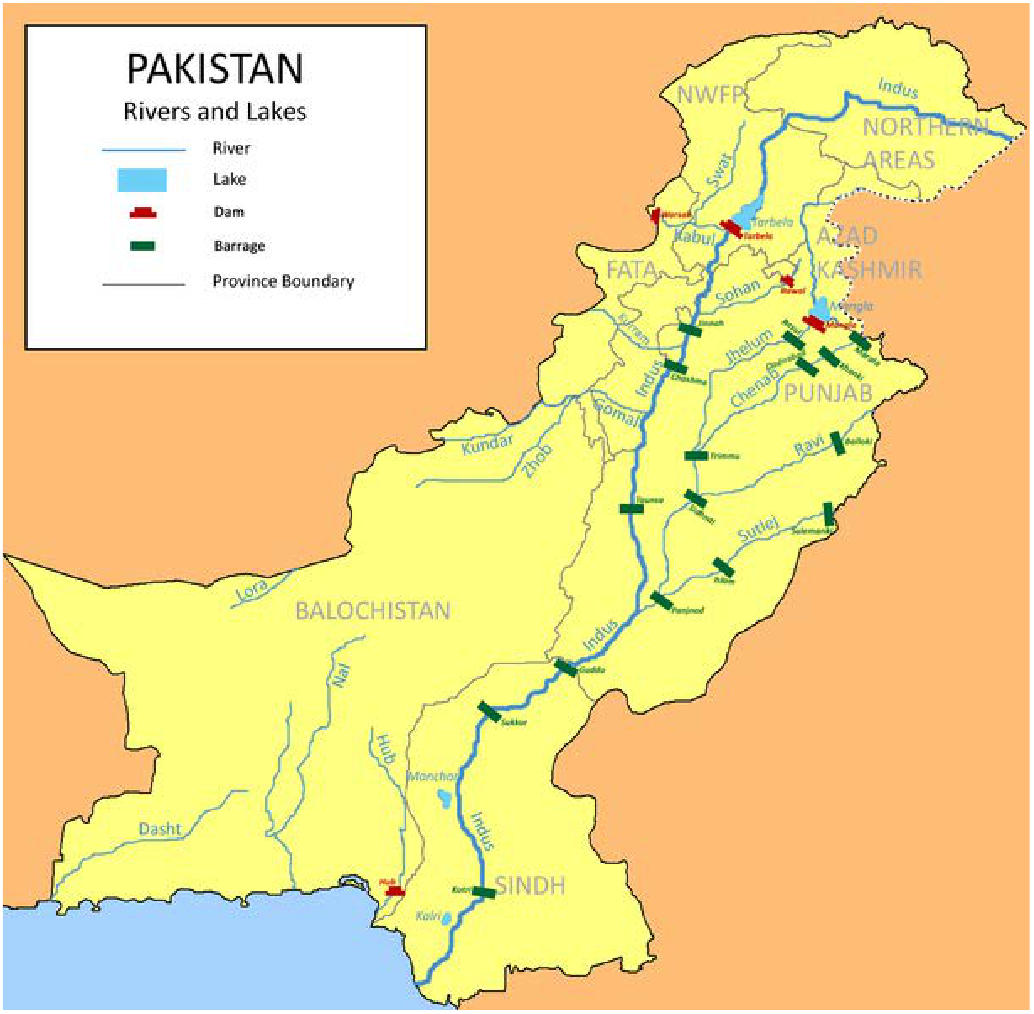
Fig. 1: Map showing the major rivers of Pakistan.10
3.4. Preparedness
3.4.1. Hyogo Framework for Action (2005-2015)
The Hyogo Framework for Action (HFA) is a 10-year disaster risk reduction plan that has been adopted by 168 member states of the UN. It was established in 2005 and describes strategies aimed to reduce losses caused by disasters (e.g. lives, social, economic and environmental) by 2015. The guidelines list key activities to build national resilience and outline five priorities for action (PFA):
Pakistan became a signatory of the framework after the 2005 earthquake exposed vulnerabilities of the existing disaster risk management strategies adopted by the country. In 2006, the National Disaster Management Ordinance (NDMO) 2006 was introduced by the Government of Pakistan to provide a legal framework for disaster risk reduction at a federal, provincial and district level and included nine priority areas from the HFA. In 2010 the framework was enacted under the National Disaster Management Act 2010.12,13 Although institutional commitments to the PFAs have been attained at a Federal and Provincial level, the degree of achievement have varied for each strategy and action.12
3.4.2. National Disaster Management Authority (NDMA)
The NDMA, under the National Disaster Management Commission (NDMC), is responsible for devising guidelines and implementing programmes on disaster risk reduction, preparedness, capacity building, response and recovery. During disasters the NDMA acts a central hub for implementing, coordinating and monitoring disaster management. They communicate with all stakeholders to facilitate a collaborative response to the disaster (including Pakistan Disaster Management Authorities, Army, Governmental Ministries and Departments, NGOs).14
Some of the key functions of the NDMA include:
3.4.3. Provincial disaster management authroity (PDMA)
Each province has a disaster management authority in the form of PDMA that operates under a Provincial Disaster Management Commission (PDMC).
Some of the key functions of the PDMA include:
3.4.4. District Disaster Management Authority (DDMA)
The DDMA, under the District Disaster Management Commission, is involved in executing disaster risk reduction programmes at a district and tehsil level (second-lowest tier of local government).
Some of the key functions of the DDMA include:
3.4.5. Federal Flood Commission (FFC)
The Federal Flood Commission (FFC) was created in 1977 in response to the severe floods of 1973 and 1976; which exposed vulnerabilities in existing disaster risk management and signified the importance for a national policy on the flood problem. In 1978, the FFC prepared the National Flood Protection Plan (NFPP) that set out to reduce flood losses, prioritise flood protection for areas of greatest economic risk, provide protection for areas outside the flood plains and improve existing flood protection facilities.15 Under the FFC, three 10-year plans have been implemented: NFPP-1 (1978-1988) mainly emphasised for the installation of structural flood protection measures (e.g. precipitation measuring systems, radars and improvements to telemetry networks); NFPP-2 (1978-88) mainly focused on the installation of more structural flood protection measures and the establishment of the National Flood Forecasting Bureau, now Flood Forecasting Division (FFD); and NFPP-3 (1998-2008) focused on strengthening of NFPP-2. NFPP-IV (2008- 2018) is currently under approval by the Planning Commission.14
3.4.6. Flood forecasting Division (FFD)
The Flood Forecasting Division (FFD) of the Metrological Department is the sole flood forecasting agency in Pakistan and is responsible for issuing forewarnings to relevant stakeholders (e.g. FFC, Provincial and National Disaster Management Authorities, Ministry of Water & Power, Combatant Generals’ Headquarters (GHQ), Ministry of Defence) to prevent and mitigate damage to lives, property and infrastructure caused by floods. The FFD receive and process hydro-meteorological data from various national sources to prepare flood forecasts and warnings. The Water and Power Development Authority (WAPDA) and the Irrigation Department provide the FFD with rainfall and river flow data in the catchment areas of the river Indus and Jhelum and hydrometric flood data from the Tarbela, Chashma and Mangla dams.14 The data is processed every six hours and analysed to produce flood forecasts and reports.16
3.4.7. Pakistan Army
The Pakistan Army’s Corps of Engineers have the responsibility of providing assistance to civil authorities by operating rescue and relief operations during national disasters. The Pakistan Army is involved in all phases of flood mitigation from pre-, during- and post-floods. During the pre-flood preparatory phase, the Commander Corps of Engineers make regular inspections of flood protection structures. During floods the Corps Engineers are stationed at the FFD to monitor the flood situation and provide regular situational updates, forecasts and warnings to the designated Director General (DG) and all other CC Corps of Engineers. Units of the Army are deployed to target areas to carry out rescue and relief operations. It is the responsibility of the PDMAs to provide the army equipment during disasters (e.g. boats, life-jackets, tents, vehicles). Further meetings are held post-floods to assess performance and identify lessons for the future.14
3.4.8. UN Clusters Approach
In 2005, the UN’s Inter-Agency Standing Committee (IASC) established a ‘Cluster Approach’ to humanitarian assistance with the aim of improving predictability, timeliness and effectiveness of response and recovery. The initial nine clusters (Camp Coordination and Management, Early Recovery, Emergency Shelter, Emergency Telecommunications, Health, Hygiene, Logistics, Nutrition, Protection and Water Sanitation) with two added later (Education and Agriculture) consisted of groupings of UN agencies, non-governmental organisations (NGOs) and other international organisations and stakeholders around sectors and services that worked together to provide assistance during a humanitarian crisis.17
The cluster approach was first implemented, in its elementary form, in the aftermath of the 2005 earthquake in Kashmir. Each cluster was designated a lead agency and made responsible for coordinating deliverance of humanitarian assistance within that sector. These clusters held intra-agency forums to share information; formulate joint strategic plans and partnerships; define roles , responsibilities and delicate activities in order to avoid gaps in coverage, duplication of aid and delay in assistance.18 As a result of implementing the cluster system much experience had been gained and capacity formed in the northern regions of Pakistan.
3.4.9. Disease Early Warning System (DEWS)
The Disease Early Warning System (DEWS) was setup in Pakistan by the World Health Organisation (WHO) in collaboration with the Ministry of Health after the Kashmir earthquake in 2005. Its goals include reducing mortality and morbidity through early detection and response to alerts and diseases outbreaks (e.g. acute watery diarrhoea, cholera, malaria). DEWS receives surveillance data from 490 fixed and 554 mobile outreach centres and has been instrumental in predicting and controlling epidemics in Pakistan through weekly reporting of disease trends and responding to health alerts within 24 hours.19
3.5. Hazard: Floods
Pakistan is prone to natural disasters including floods, earthquakes, landslides and tropical cyclones. Riverine floods are a common phenomenon in Pakistan and are predominantly caused by concentrated rainfall in river catchments areas during the monsoon season; that are sometimes compounded by increased glacier melt. Monsoon currents from the Bay of Bengal in India and the subsequent depressions can result in heavy rainfall in the Himalayan regions of northern Pakistan. Furthermore the weather systems originating from the Arabian and Mediterranean seas can compound the heavy downpours in the north and inundate the Indus River and its tributaries.20
The Indus River has been responsible for 11 of the major floods in Pakistan including the floods of 1950, 1955, 1956, 1973, 1976, 1978, 1988, 1992, 1995, 1997 and 2005 (Figure 2).15,21 The floods of 1973 claimed 474 lives and destroyed over 3 million houses. The floods of 1976 caused 425 deaths and destroyed 10 million houses with a total cost to the economy of 6 billion rupees.21 The floods of 2005 that were caused by the warm weather and snowmelt in the northern regions killed more than 30 people and affected over 460,000 people nationwide.22

Fig. 2: Major floods of Indus River in Pakistan.15
3.6. Vulnerability
3.6.1. Housing
The poor quality of housing stock in the rural areas of Pakistan makes them vulnerable to natural disasters. Houses in the northern mountainous regions are typically of kutcha (non-permanent) stock and constructed from mud or stone rubble making them feeble and unable to withstand extreme natural events. Even the pucca (permanent) are not exempt from these dangers due to poor structural design comprising heavy concrete slabs supported by thin walls constructed of sand and cement mortar.23 Furthermore, the majority of houses lining the Indus River in Punjab and Sindh along the heart of the country are made of basic adobe materials and inhabited by poor agrarian people. Only 24% of rural areas have access to piped water and the major sources for drinking water are tube wells, hand pumps and boreholes. Furthermore, 43% of rural households do not have any toilet facilities.24
3.6.2. Environment
Extensive deforestation, particularly in the northern mountainous regions around the Indus River, has resulted in soil erosion. The resulting reduction in vegetation has led to an increase in surface water run-off during monsoon seasons. Augmented by increased glacial melt, deforestation has resulted in the Indus River receiving a greater amount of water upstream. 25
3.6.3. Flash Floodings
Flash floods, as opposed to slow rising riverine floods, can cause considerable damage to lives, communities and property as they can present suddenly and without warnings. Flash floods in Pakistan have predominantly occurred in the mountainous ranges of the Himalayans, Kashmir and Gilgit-Baltistan due to steeply uneven topography and unpredictable climate; and in D.I. Khan, D.G. Khan and Kirther Ranges of Balochistan and Sindh Provinces as result of hill torrents and around the coastal areas of Sindh and Balochistan due to tropical cyclones.20
3.6.4. Communicable Disease
The most prevalent communicable diseases in Pakistan include acute respiratory infection, diarrhoea, polio, tuberculosis, hepatitis B and C, measles and vector-borne disease including malaria, Leishmaniasis and haemorrhagic fever (CCHF). The prevalence of malaria is greater in the rural areas and risk reduction behaviour is low with only 6% of households owning mosquito nets. Pakistan has an endemic problem with tuberculosis (297,000 cases reported in 2008) and polio.24
3.6.5. Maternal and Child Health
Pakistan has a high maternal mortality rate of 276 deaths per 100,000 women. Major causes of maternal death include haemorrhages and sepsis. Approximately 62% of all deliveries take place within the home and only 39% of deliveries have a skilled practitioner present. Child mortality rate (under 5 years old) is 94 per 1000 live births; infant mortality rate (under 1 year old) is 78 per 1000 live births; and neonatal mortality rate (under 28 days old) is 54 per 1000 live births. The main causes of infant death include pneumonia, sepsis, diarrhoea and meningitis.24 Immunisation rate in Pakistan is remarkably low with coverage of only 46%.26
4. During floods
4.1. timeline
On 20th July 2010, the FFD issued the first of a series of flood warnings to low lying areas and districts of Punjab as result of widespread thunderstorms and heavy downpours generated by the annual monsoon season. The FFD advised all concerned authorities to take precautionary measures to protect human lives, infrastructure and property. Similar warnings were issued on almost a daily basis; however, the amount of time given between the issuance of the warning and the expected time for flooding varied and ranged from zero to several hours in the northern regions (KPK and Punjab) and a maximum of around 2 days for the southern regions (Appendix 1).
On 22nd July, the first of the heavy monsoon rains hit the north-eastern regions of Balochistan causing flash floods and affecting 50,000 people. A second spell of heavy rains, which lasted for two months, followed on 27th July and resulted in the FFD issuing high flood level warnings along the River Chenab in Punjab and River Kabul in Khyber Pakhtonkhwa. On 28th July the FFD issued further warnings of heavy flooding in the Kalat, Sibi, Naseerabad and Zhob districts of Balochistan and DG Khan and Rajanpur districts and river Tarbella in Punjab and northern Khyber Pakhtonkhwa provinces.
On 29th July, the Swat and Kabul rivers burst their banks resulting in the flooding of Nowshera and Charsadda districts and parts of Peshawar in Khyber Pakhtonkhwa. Furthermore, on-going rains in the northern regions caused landslides and further flash flooding in Khyber Pakhtonkhwa, Gilgit Baltistan and Pakistan-administered Kashmir causing loss of life and significant damage to property and infrastructure. By the morning of 31st July the upper regions of River Indus around the Chashma district of Punjab had been flooded. As the floodwaters headed southwards, floods continued to devastate low-lying district surrounding the Indus basin (i.e. Bhakkar, Layyah, Muzaffargarh, DG Khan and Rajanpur). The total rainfall within the month of July was exceptionally high for the annual monsoon season with recordings of: up to 257mm in districts of Punjab; up to 280mm in Khyber Pakhtonkhwa; up to 58mm in Balochistan and up to 189mm in Gilgit Baltistan & Azad Kashmir.27
By 5th August, as red alerted by the FFD two days earlier, the floodwaters reached the Sindh Province and drowned the district of Guddu. The FFD issued further red alerts of exceptionally high flooding in Sindh to the districts of Khairpur, Jacobabad, Sadiqabad, Shikarpur, Ghotki of Dadu Sukkur, Larkana, Nawabshah, Hyderabad and Naushehroferoze. By 7th August, the floods had affected 15 million people nationwide.
On 9th August, the Indus River overflowed its banks in Sindh causing wide scale destruction. By 26th August, more river breeches had occurred in the district of Thatta and further flood warnings were issued for the district of Kotri. By 30th August, more villages were submerged under water and approximately 1 million people fled from the floods in Sindh. On 13th September, the large Manchar Lake breached its bank and overflowed causing serious flooding of the Jamshoro district (Figure 3).

Fig. 3: Maps showing the temporal progression of floodwaters from 30th July to 13th September 2010.28
4.2. Receding floodwaters
The impact of the floods varied amongst the provinces depending on the nature of the floods (i.e. flash flood versus slow-rising riverine floods), the topography of each affected area and the different levels of preparedness measures. Where Khyber Pakhtunkhwa was only affected by flash floods, the provinces of Punjab and Balochistan were exposed to both flash and riverine floods and the Sindh province to mainly slow-rising riverine floods. Furthermore, the receding of floodwaters also varied depending on the topography of the region. In the topographically hilly Khyber Pakhtunkhwa and Balochistan floodwaters started to recede within days of their onset, however it took several weeks until mid-September in Punjab and several months in some areas of the flat plains of Sindh for the waters to completely clear.29
4.3. Damage
The Pakistan floods of 2010 have caused unprecedented damage to livelihoods, property, infrastructure and economy in the history of the country. The floods claimed 1985 lives, injured 2946 people and affected over 20.2 million people nationwide. Around 11 million people were displaced nationwide; with 7 million people from Sindh alone.30 Both flash and slow-rising riverine floodwaters affected 78 of the total 121 districts and at one point one-fifth of the country was submerged under water (Figure 4).1 Unparalleled damage was caused to housing stock, educational and health facilities, communication networks, power plants and grids, irrigation channels, agricultural land and livestock. The World Health Organisation (WHO) identified 23 of the most severely affected districts (Table 1).

Fig. 4: The number of affected districts in each province.1
Province
Worst Affected District
Sindh
Jacobabad, Kashmore, Shikarpur, Gotki and Qambar Shahdad Kot ,Dadu, Jamshoro and Thatta
Balochistan
Jaffarabad, Nasirabad and Sibi
KPK
Nowshera, Charshada, Swat, Kohistan and Shangla
Punjab
DG Khan, Rahim Yar Khan, Layyah, Rajanpur and Bhakkar
4.4. Impact on Human Health
4.4.1. Deaths and Injuries
The floods caused 1985 deaths and injured 2946 people. Majority of deaths occurred in Khyber Pakhtunkhwa Province (1156; 58%), followed by Sindh (411; 20%), Punjab (110; 5.5%), Balochistan (183; 0.02%). The remainder of deaths occurred in the smaller tribal and administrated areas. Furthermore, the majority of deaths had occurred within the first 14 days with official data reporting 1271 deaths and 1334 injuries by 10th August 2010.31 Sindh (1235; 41%) and Khyber Pakhtunkhwa (1198; 40%) had the most number of injured people (Figure 5).29

Fig. 5: Number of deaths and injuries caused by the floods.29
4.4.2. Disease
From 29th July 2010 to 21st July 2011 DEWS reported 37,391,802 medical consultations in flood affected districts. The most common illnesses included: acute respiratory infection (23%), skin diseases (11%), acute diarrhoea (9%) and suspected malaria (6%) (Figure 6).2 Other diseases reported by DEWS have included Tetanus, Meningitis, Leishmaniasis, Diphtheria, Acute Flaccid Paralysis, and Viral Hemorrhagic Fever.32

Fig. 6: The number of leading causes of seeking medical consultations reported to DEWS from 29th July 2010 to 21st July 2011.2
The incidence of acute respiratory infection increased within two weeks after the onset of the floods and reached a peak in early February 2011. The incidence of acute diarrhoea (AD) increased immediately after the floods and peaked towards the end of August 2010. After a falling trend from September 2010 to late February 2011 the incidence of AD began to climb again around mid-March 2011. The incidence of bloody diarrhoea (BD) remained generally low but constant with a slight increase between late August to mid-October. The number of suspected malaria cases increased between late-August 2010 till early January 2011 peaking in October 2010 (Figure 7).

Fig. 7: The proportional morbidity of priority diseases from flood-affected districts from 29th July 2010 to 2nd June 2011.33
4.4.3. Health Facilities
The damage inflicted on the country’s public health infrastructure was considered to be mild to moderate with basic health units and medical dispensaries mostly affected. From a total of 9721 health facilities in Pakistan, 2957 were situated in flood-affected districts of which 515 were either damaged or destroyed by the floods.34,26 Khyber Pakhtunkhwa and Sindh suffered most proportional damage with 10.9% and 11.7% of total health facilities damaged or destroyed; respectively. About 8.9% of total provincial health facilities in Fata, 6.3% in Azad & Jammu Kashmir, 2.1% in Balochistan and 2% in Punjab were affected by the floods (Figure 8). Most of these healthcare facilities were located in rural areas and provided basic health services to the local population. Although most of the secondary healthcare facilities were unaffected by the floods, however the disruption caused to primary healthcare providers led to secondary healthcare facilities becoming inundated with greater demand for services. Furthermore it is estimated that around 35,000 female health workers had been displaced during the floods causing further disruption to the health service.28 The total cost of damage to health facilities has been estimated around $50 million.1

Fig. 8: Number of health facilities partially or completely damaged by the floods in each province.26
4.4.4. Food and Nutrition
The World Food Programme Flood Impact Assessment reported that at least 10.1 million people required emergency assistance with food of which about 3.6 million people would require long-term assistance. Risks of diarrhoeal outbreaks caused by water borne diseases, poor feeding and loss of livelihoods predisposed the displaced and affected population to acute and chronic malnutrition.
The pre-existing levels of malnutrition in the population (13.2% of Global Acute Malnutrition (GAM) and 3% of Severe Acute Malnutrition (SAM)) had been exacerbated by the floods. Provincial surveys showed that the level of GAM in northern Sindh had increased to 22.9% and 26% in southern Sindh. A total of 13.2 million people required nutritional attention following the floods. Furthermore, about 2.8 million (14%) children under the age of 5 years old and 1.6 million (8%) pregnant and lactating women formed part of the total affected population 35
4.5. Impact on other Sectors
The floods affected 78 out the 121 districts of Pakistan inundating over 160,000 km2 of land mass causing unprecedented damage to housing, educational and health facilities, communication networks, power and energy plants and grids, irrigation channels, agricultural land and livestock (Figure 9). The total cost of damage was estimated to be around US$ 10 billion. Sindh suffered the most damage estimated to be around US$ 4.3 billion, followed by Punjab at US$ 2.5 billion, KPK at US$ 1.7 billion and Balochistan at US$ 620 million (Figure 10).26

Fig. 9: Estimated total cost of damage according to sector in US$ million.26

Fig. 10: Estimated total cost of damage according to Provinces in US$ million.26
4.5.1. Housing
Over 1.6 million houses were either damaged or destroyed by the floods. Approximately 1.45 million of the affected houses were of kutcha stock and around 850,000 had been completely destroyed. Around 156,000 units of pucca houses were affected by the floods of which around 65,000 were completely destroyed. Sindh suffered the most losses to housing with over 800 thousand houses (24% of pre-flood stock) becoming damaged or completely destroyed. About 375,000 houses (9% of pre-flood stock) in Punjab, 250,000 houses (9% of pre-flood stock) in Khyber Pakhtunkhwa, 80,000 houses (14% of pre-flood stock) in Balochistan were either damaged or complete destroyed by the floods.28 The total cost of damage to housing has been estimated at around $1.158 billion (Figure 11).26

Fig. 11: Number of houses destroyed in each Province.26
4.5.2. Water Supply and Sanitation
The severity of damage caused to water supply and sanitation infrastructure varied across the provinces. Flash floods in Khyber Pakhtunkhwa caused most structural damage to water supply networks and infrastructure including pump houses, store tanks and water pipes. Whereas the slow-rising riverine floods in Sindh caused more damage to electrical and mechanical components, pump houses and machinery. Sanitation infrastructure was most affected in the south with extensive damage inflicted on sewerage and drainage systems.26 As water and sanitation is a major determinant of communicable diseases, the impact of the damage on this sector had wide-reaching health implications. The total cost of damages in this sector is estimated to be around $109 million.1
4.5.3. Irrigation
Severe damage was caused to the country’s 50 years old irrigation system that included irrigation channels, canals, drains and public tube wells. The Sindh province suffered most damage costing around $136.9 million followed by Khyber Pakhtunkhwa at around $68 million.1 The overall damage to the irrigation is estimated to be around $278 million.26 The direct damage to the irrigation infrastructure compounded with water siltation and water-logging of agricultural lands have also caused great destruction to crops.26
4.5.4. Education
The floods caused indiscriminate damage to educational facilities that account for 6.2% of total institutions in Pakistan. A total of 10,407 educational institutions were severely affected by the floods of which 6,666 fully destroyed and 3,741 partially damaged. A total of 18.5% of total educational institutions were either damaged or destroyed in the Sindh province and a further 8.8% in Punjab, 12.9% in Balochistan and 5.6% Khyber Pakhtunkhwa.26 The total cost of damage to education sector has been estimated at around $311 million.26
4.5.5. Transport and Communications
The damage incurred to the transport and communication networks (including roads, bridges, railways, airports and telecommunication infrastructure) have had multiple implications ranging from mobility of the affected population to access to basic services (e.g. health, education, public services and markets). Approximately 25,000 km (10%) of road networks and 1,225 km (16%) of railways have been damaged by landslides and floods, incurring losses of $1.2 billion and $60 million, respectively. Damage to the telecommunications infrastructure, which includes cables, transmission towers and optic fibre networks is estimated around $35 million. The total damage incurred by this sector has been estimated to be $1.3 billion.26
4.5.6. Agriculture, Livestock and Fisheries
Agriculture, livestock and fisheries have been the most severely affected sector accounting for 44% of total damage inflicted by the floods. The damage caused to agriculture and livestock varied in each province according the nature of the flood. The unexpected flash floods in the mountainous areas of Balochistan, Khyber Pakhtunkhwa, Pakistan-administrated Kashmir and Gilgit-Baltistan overwhelmed the local population and resulted in the sweeping away of people, houses, livestock, feed stores and food. The slow-riverine floods in the topographically flat plains of Sindh and Punjab together with longer advance warnings by the FFD enabled the population to relocate and save most of their livestock. In total about 1.5 million animals and 10 million poultry birds were lost to the floods.26
Waterlogging and siltation of agricultural lands caused great destruction to crops. According to the Preliminary Damage and Needs Assessment report, damage to crops accounted for 89% (i.e. 2.1 million hectares of mostly cotton, rice, sugarcane and vegetables) and live stock 11% of the overall losses.1 The Sindh province suffered 46% of the total damage to the agriculture, livestock and fisheries sectors, followed by Punjab (36%), Khyber Pakhtunkhwa (8%) and Balochistan (8%). The total damage to this sector is estimated at $5 billion.26
4.5.7. Environment
Forests, wetlands and other natural systems have suffered damages of around $12 million.26 Furthermore, the floods had serious implications on environmental health though contamination of drinking water, accumulation of solid waste and proliferation of disease vectors around stagnant waters.29
4.5.8. Energy
Pakistan’s electricity sector suffered major damages to hydroelectric power generation stations, distribution grid and networks. About 3.5 million people, predominately from Sindh and Khyber Pakhtunkhwa, were left without power. The total damage to the electricity sector was estimated to be around $155 million. Pakistan’s petroleum sector, although representing only 1% of the annual oil imports, also suffered damages totalling around $155 million. Over 240,000 people were cut off from gas supplies, and a number of power generation facilities were temporarily suspended following shortages of oil. Total damage to the energy sector is estimated around $309 million.26
4.5.9. Private Sector and Industries
Whilst the major industrial centres of the country were spared, the floods severely affected small and medium business enterprises. Shops, industrial factories and workhouses received the largest share of the damage estimated at around $282 million. Sindh and Punjab suffered most damage to commercial, agricultural and farming sectors (i.e. cotton, sugar, rice and flourmills). Losses of around 2 million bales of cotton had knock-on effects on the textile industry; which forms one third of the country’s manufacturing sector. Khyber Pakhtunkhwa suffered most damage to its marble, mining, silk, furniture manufacturing and tourism sectors.29 Furthermore damage to the private sector has had serious implications on the labour forces incomes and livelihoods and overall resilience. The total cost to this sector is estimated at around $282 million.26
5. Post-floods
The initial response to the floods was coordinated by the NDMA and carried out by PDMAs, DDMAs, local population, philanthropist and the army. Much experience and capacity had already been formed following the Pakistan earthquake of 2005 that allowed for early mobilisation of response; particularly in KPK where the recovery phase was still in progress following the earthquake. However, as the floods continued to overwhelm and exhaust the country’s resources and capacity, the Government of Pakistan sought help from the international community. By early August 2010 the UN appealed for $459 million through the Pakistan Initial Floods Emergency Response Plan (PIFERP) to cover the immediate relief period and at the heed of the Pakistan government prioritised four clusters (Food, Health, Shelter and Water, Sanitation and Hygiene (WASH)).10 Within weeks, the humanitarian response to the Pakistan floods became the largest relief operation launched by the international community in recent history comprising various United Nation agencies, international non-governmental organisations, foreign government and donors. However, due to initial poor flow of donations the initial response to the floods was heavily hampered, especially in the southern provinces. A revised PIFERP requested over $1.9 billion to cover the early recovery period lasting approximately one year.36 Eventually the UN increased the number of clusters to assist flood-affected people. The NDMA also arranged for visas-on-arrival for relief workers and exempted tax and duty for imported relief items.1
5.1. Rescue and Relief phase
The Rescue and Relief Phase started immediately after the onset of the floods in July 2010 and aimed to reduce mortality, morbidities, disease and malnutrition in the affected population.14 The NDMA, together with the assistance of the army, initiated a rescue operation that included moving stranded people to safety, transporting people that required medical attention and distributing emergency relief supplies (including tents, food, water, sleeping mats, hygiene kits and medical services) (Table 2). The army deployed 60,000 troops, utilised their entire fleet of C-130 planes in the initial operation. Marine support was provided through 1000 boats including 50 life-saving naval boats. The army was also involved in repairing transport infrastructure (e.g. roads, bridges) and setting up mobile medical camps.37 As a result 800,000 people were rescued within one month following the initiation of the Rescue and Relief Phase.38 By 17th September 2010 a total of 1.4 million people were either rescued or evacuated from the floods.1
A total of 88 helicopters (including 48 from friendly countries), 4 hovercrafts and 1238 boats were deployed during the initial rescue operation. A total of 5928 relief camps were established nationwide that sheltered over 3 million people at the peak of the disaster. These had decreased to 103 relief camps and 91,773 people by 31st December 2010 (Table 3).1
Achievements
Number
Food
Food items
0.41 million tons
Ready to eat meals
10.76 million
Shelter
Tents
489,177
Tarpaulin
931,317
Blankets
1,918,483
Plastic mats
129,537
Mosquito nets
290, 262
Kitchen sets
412,401
Health
Medicines
428 tons
Hygiene kits
160,470
Water purification tablets
250 million
Medical consultations
20.11 million
Water and Sanitation Hygiene (WASH)
Water purification kits/buckets
11,341
Water purification plants/units
3896
De-watering pumps
45
No. of Relief Camps
No. of People in Relief Camps
% of Returning People by 31/12/10
Province
During Peak
On 31/12/10
During Peak
On 31/12/10
Punjab
327
0
116,295
0
100%
Sindh
4,682
73
1,815,961
76,421
96%
KP
825
0
915,463
0
100%
Balochistan
67
30
150,343
15,352
90%
AJ&K
2
0
900
0
100%
Total
5,928
103
3024,432
91,773
97%
The relief efforts were further augmented with the formation of clusters that initially prioritised food, health, shelter and WASH but were later rolled out to include other sectors (Appendix 2). This paper will summarise the response of clusters directly related to human health: Health, Food, Nutritional, WASH and Shelter.
5.1.1. Health Cluster
The health cluster led by WHO and the Ministry of Health had the objective of providing emergency health assistance in the flood-affected areas of KPK, Balochistan, Punjab, Sindh, the small tribal areas and the state of AJK. During the initial Rescue and Relief phase a total of over 11.8 million medical consultations were reported from 29th July to 30th December 2010.39
Within one year from the onset of the floods over 37 million medical consultations were reported by DEWS, between July 29th July 2010 to 21st July 2011, from 73 out of 78 flood affected districts.2 The cluster provided essential medicine to over 14 million people and responded quickly to disease alerts, controlling over 480 outbreaks as identified by DEWS.40 The most common disease presentations included: acute respiratory infection, skin diseases, acute diarrhoea and suspected malaria. Over 10.3 million water disinfection chemical kits have been distributed.
5.1.2. Shelter Cluster
The movement of people from flood-affected districts led to the establishment of 5928 relief camps to shelter displaced communities. By 31st December this number had reduced to 103 as about 97% of people returned homes with 91,773 people remaining in the camps.1 Up until March 2011 the Shelter Cluster have reportedly distributed 1.36 million plastic tarpaulins and 381,000 tents to over 1 million households (approximately 66% of the total estimated number of houses damaged or destroyed by the floods) and 14,520 one room shelters and 24,111 transitional shelters (i.e. lightweight structures that can be relocated) were set up. However, only 67% of the emergency shelter needs had been met. Punjab has received the most coverage with (93%) while the shelter cluster in the Sindh province has only reached 51% of the target amount.41
5.1.3. Food Cluster
About 10.1 million people were in need of food following the floods. By December 2011, the food cluster, headed by the World Food Programme (WFP), distributed over 350,000 metric tonnes (mt) of food.42 By February 2011, over 480,000 metric tonnes of food had been distributed in 65 districts in the form of monthly rations (in accordance with SPHERE standards for food security, nutrition and food aid).35 About 8.8 million people (including 4.3 million women and girls and 1.2 million children under the age of 5 years) had been assisted at least once and an average of 6 million people were reached on a regular basis.35 Food and cash for initiatives were also implemented to help rebuild agricultural infrastructure and rehabilitate communities.43
5.1.4. Nutrition Cluster
The Nutrition Cluster established 625 therapeutic centres that comprised of 597 outpatients therapeutic clinics and 28 stabilisation centres. By March 2011, the Nutrition Cluster had screened over 1.29 million children under the age of 5 years and over 492,000 pregnant and lactating women for malnutrition.35 By August 2011, the screening programme identified 95397 severely malnourished children, 256,226 moderately malnourished children and 159,750 pregnant or lactating women who were put onto the feeding programs.40
5.1.5. WASH Cluster
Approximately 13.1 million flood-affected individuals required the provisions or services of the WASH cluster. Key priorities included installing permanent WASH facilities (e.g. safe disposal of excreta), restoring and exceeding pre-flood WASH coverage in the affected districts and hygiene education to promote sustainability.29 The WASH cluster have provided drinking water to 2.5 million people, over 400,000 hygiene kits, 3 million bars of soap and have provided education, health and hygiene promotion to over 750,000 people.29
5.2. Early Recovery Phase
The Early Recovery Phase started in parallel to the initial relief phase and was included in the Pakistan Flood Relief and Early Recovery Plan in November.28 The NDMA, United Nations Development Programme (UNDP) and UN Humanitarian Coordinator formed the Early Recovery Working Group (ERWG) to aid recovery in 29 of the most affected districts. The ERWG, setup at federal, provincial and district level, consists of 8 Sectorial Working Groups (SWG) focused on 8 prioritised sectors (Agriculture & Food and Security, Health & Nutrition, Education, Water & Sanitation, Housing, Governance, Non-Farm Livelihood and Community Infrastructure) and 4 Thematic Groups based on 4 cross-cutting themes (Disaster Risk Reduction, Gender, Environment and Protection. The SWGs and TGs devised strategies for each sector and thematic group after conducting a Map and Gap Analysis to identify early recovery needs, challenges, response, funding and funding gaps.44 On 15th April 2011, the Early Recovery Phase was formally initiated through the Strategic Early Recovery Plan that described sectorial and thematic strategies to address the gap between relief and long-term recovery and rehabilitation.
5.2.1. Health and Nutrition
The Health and Nutrition SWG focused on screening and providing nutritional support for moderate to severely malnourished children and pregnant and lactating women in 29 priority districts. The Health and Nutrition SWG identified 8 million people, including 1.4 million children under 5 years old and 1.4 million women who needing access to health care. Capacity was also developed through the restoration and rehabilitation of healthcare facilities. Temporary structures, medical supplies, and human resource support (e.g. female staff) was provided to manage with the increased number of patients.45 Further partnerships had been formed with UNICEF and World Food Programme to make up for the short fall in capacity.29
Up and until October 2011, 685 Outpatient Therapeutic Program (OTP) and Stabilization Centers (SC) had been established. Over 5.28 million children under the age of 5 years had been screened of which 127435,589 were included in OTP/SC and 4.3 million admitted in the Supplementary Feeding Program (SFP). Over 1.6 million pregnant lactating women had been screened for malnutrition of which 2.52 million were admitted in the Supplementary Feeding Program (Table 4).
Province
No. of Sites (OTP & SC)
No. of Children Screened
Total No. of Children in OTP/SC
No. of SFP Site
No. of SFP Admissions Children
No. of PLWs Screened
No. of PLW’s Admitted in SFP
Balochistan
0
63726
7696
0
21613
99722
25257
KP
29
1058805
12190
29
62806
372567
33093
Punjab
203
1841895
69685
202
223466
568594
119550
Sindh
453
2325459
37488
453
127704
573301
74780
Total
685
5289885
127059
685
435589
1614184
252680
5.2.2. Water and Sanitation
With the passing of the initial relief and recue phase, the emphasis shifted onto recovery and strengthening of institutional capacity to achieve long term health and development goals and supporting the return of displaced people.29 Sanitation has been the main focus of the Water and Sanitation SWG work. Their work has included repairing damaged water supply networks, installing or repairing hand-pumps and constructing latrines for the affected population. Much emphasis has also been placed on hygiene awareness through educational and training programmes. Until August 2011, 1.6 million homes were reached with hand pump installation or repair, 30,000 households have been provided with latrines and 1.2 million households have received educational sessions on hygiene.40
5.3. Early recovery in Other sectors
5.3.1. Agriculture and Food Security
The Agriculture and Food Security Sectorial Working Group led by the World Food Programme has been involved in ensuring food security for the affected population and building agricultural assets of local communities. From February 2011 to July 2011 food and cash for work initiatives were introduced to enable affected communities to rebuild agricultural infrastructure. About 100,300 households have benefitted from the cash for work initiative. About 768,680 households were provided with crop/vegetable packages and 327,340 households with livestock.44
5.3.2. Housing
On 31st March 2011 the Shelter Cluster was handed over to the Housing Early Recovery Group (HERG) after being led by the International Organisation for Migration (IOM) during the Rescue and Relief Phase. The main strategy has been to focus exclusively on houses that were completely destroyed by building cost-effective and durable one-room shelters made from mud and brick per destroyed house. Up and until August 2011 453,293 one room shelter units have been constructed and around 63,700 transitional shelters have been completed.40 Emphasis has also been given on training programmes and centres that provide technical assistance to families building their own homes.41
5.3.3. The Watan Card Scheme
The Government of Pakistan established the Watan Card Scheme to enable the delivery of cash directly to the flood affected families. ATM cash cards were registered and distributed to affected families who were then able to obtain cash from ATM machines. Around 1.5 million households benefited from the scheme receiving sums of approximately £150 each. This scheme also allowed for money to be injected directly into the local economy.
5.4. Pakistan floods 2011
At the time of completing this report, the new onset of floods in the southern regions of Pakistan in 2011 had undoubtedly compromised the recovery and rehabilitation phase following the floods of 2010.47 The floods, triggered by heavy monsoon rains, have caused 486 deaths, injured 753 people and affected a total population of 5.15 million people in Sindh alone. Extensive damage has been caused to nearly 800 thousand houses, 200 health facilities and 2.28 million acres of agricultural lands.48 A comprehensive review of the impacts and effects of the floods 2011 in Pakistan and the post-flood relief and recovery efforts are beyond the scope of this paper.
6. Discussion
The floods of 2010 in Pakistan have caused unprecedented damage and affected over 20 million people, however the impact on health (i.e. mortality and morbidity rates) has been relatively low when compared to other natural disasters in recent history (e.g. Asian Tsunami in 2004 Hurricane Katrina in 2005). This could be attributed to three factors: the early warning system by FFD; the type of floods (flash floods versus slow-rising riverine floods); and the timing and dispatch of early response and recovery efforts to the disaster.
Flash floods that devastated the northern mountainous regions of KPK were responsible for more deaths (1,156) than the slow-rising riverine floods in the south. Furthermore, the number of deaths in Punjab (110) and Sindh Province (411) were remarkably low despite having a larger affected population. This discrepancy in mortality rates could be attributed to range of advance warning given by the FFD. The southern provinces benefitted from longer advance warnings compared to the northern regions. This supports the importance of an effective and timely advance flood warning system to allow people adequate time to prepare and relocate. The NDMA concedes that the current early warning system in Pakistan is of limited nature and can provide a forecast range of 3-4 days; however, coverage is almost non-existent in the north-western region and around the coastal belt of Balochistan.42 Further investment is needed in enhancing early warning systems through the application of modern technology for developing a more comprehensive system for monitoring and archiving data. More, infrastructural investment is needed in developing more efficient channels for disseminating warnings to vulnerable communities. The current system relies upon police wireless networks in police stations, the Forestry Department, mosque committees and other grass root organisations and the growing use of mobile (GSM) networks.12
The sudden and violent nature of flash floods, as seen in the northern mountainous region of KPK and Balochistan, have been responsible for more deaths – to both humans and livestock – than the slow-rising riverine floods that devastated Sindh and most of Punjab. The exact cause of death has been difficult to verify during the course of this report – as the information is not readily available – however review papers show that the leading cause of death by flash floods is drowning.49 Although the timing of flash floods is difficult to predict it is undeniable that they can be a major determinant of human health. Therefore a comprehensive risk analysis and hazard map should be drawn up so vulnerable communities can be identified and appropriate disaster risk reduction intervention can be implemented (e.g. informing, motivating and involving communities’ people in all aspects of disaster risk reduction)
The swift and immediate responses by the NDMA and the military, especially in KPK, may have saved lives that may have been otherwise been lost. The capacity to respond to natural disasters had already been developed by the PDMAs of the northern regions following the 2005 earthquake in Kashmir. This gained knowledge and experience was reflected in the relief efforts during the July 2010 floods. It was felt by stakeholders (e.g. NGOs) that the deployment of relief response was quicker in the northern regions than in the southern provinces where sufficient warning time had been issued in advance of the floods. This shows that much more capacity building is required at a national and provincial level to ensure response is equal, measured and effective.
The United Nations led health cluster approach to coordinating humanitarian assistance to disaster victims has had mixed reactions from stakeholder groups. Although it is generally accepted that the approach had improved since the earthquake in 2005, it was commented that some clusters – which comprised over 600 agencies – lacked experienced leadership. This impacted on cluster meetings, which, rather than being utilised as a forum to coordinate assistance served as platform to share information. As a result of communication failure there were gaps in coverage, duplication of aid in certain areas and delays in assistance.29,37
An overwhelming case has been made for further investment in disaster preparedness and risk reduction. Pakistan needs to continue implementing strategies of the Hyogo Framework for Action (HFA). Although much progress has been achieved through institutional commitments, the Government of Pakistan needs to invest in emergency preparedness, response and recovery programmes.
7. Lessons Identified
The NDMA have been central to coordinating response to the floods of 2010. The NDMA initial rescue operation pays testament to the value of local capacity and leadership. However, where response coordinated by NDMA was swift in the northern regions of Pakistan, the response in Sindh was much slower despite adequate early warnings issued by the FFD. The NDMA need to invest in building capacity in Sindh and Punjab and disaster risk reduction measures in all provinces.
The Watan scheme was an innovative idea that helped to put cash directly in the hands of those in need. However, the scheme was fraught with bureaucracies and red tape that delayed the money reaching its intended beneficiaries. The registration system relied on presenting a national identity card on application. As majority of the people affected were poor and did not own an identity card they were excluded from being enrolled on to the scheme. The scheme could be enhanced by removing some of these barriers to make it more equitable. The government should carry out a registration process of all the people in the area as a preparedness measure for future floods.
The Clusters have achieved varying levels of success. There seems to have been a lack of clear leadership amongst the clusters, especially when some clusters have more than 600 humanitarian agencies grouped together. Initiatives that can rank agencies according to their leadership strengths and experiences should be explored and also structure the size of the meetings to allow for efficient communication and information sharing.
8. Conclusion
The Pakistan floods of 2010 affected over 20.2 million and claimed the lives of 1985 and injured 2946 people. The floods affected 78 out of 121 districts and at one stage submerged 20% of country total landmass underwater causing total damage of over $10 billion. KPK and Balochistan suffered predominantly from flash floods; whereas Punjab and Sindh suffered mainly from slow-rising riverine floods. The amount of fore warning disseminated to vulnerable communities was inconsistent throughout the country. The northern provinces of Pakistan were disadvantaged with shorter advance warnings than the southern provinces. However, response to the floods was much swifter in the northern regions as compared to the southern regions. The NDMA coordinated all response efforts and the UN Cluster approach was adopted to provide humanitarian assistance to affected communities. The initial Rescue and Relief Phase was discontinued on 31st January 2011; except in 27 most affected districts where eight Sectorial Working Groups (SWG) were established in April 2011 to start the Early Recovery Phase. Unfortunately, recovery and rehabilitation efforts have been hampered by the recent floods of 2011 that have affected 5.2 million people and destroyed over 1 million houses in Sindh. The floods of 2010, and indeed 2011, have exposed vulnerabilities in the country disaster risk reduction system where further investment is required in emergency preparedness, response and recovery programme.
Correspondence
Email: [email protected]