Methods: In accordance with the PRISMA statement, “PubMed”, “ScienceDirect”, “Google Scholar”, and “Scopus” were searched up to end of 2015. All English Articles that were published in peer-reviewed journals and had discussed site selection criteria for hospitals were included. Out of 41 articles, 15 met the inclusion criteria in which 39 general criteria for HSS were applied. These criteria were categorized in six main groups including cost, demand, environmental, administrative, disaster risk, and “other” concerns through a focus group discussion.
Results: Accordingly, the application percentage of cost, demand, environmental, administrative, disaster risk, and “other” concerns in the articles was 100, 93.3, 53.3, 33.3, 20.0, and 13.3 respectively. The least devoted attention was to disaster risk issues.
Discussion: Few researchers applied risk related criteria for HSS. Further consideration of “risk of hazards” and “burden of diseases” in comprehensive studies, is recommended for HSS to guide the decision makers for building more resilient hospitals. Keywords Hospital, Site selection, Systematic review, Disaster risk
]]>Introduction
Hospitals are one of the main elements of social services, and a cornerstone of response to disasters in an acute phase, especially in countless mass casualty incidents. Social service delivery has its roots in the time when humans began living together as a community to meet their needs. Accordingly, health-related services were developed particularly in more centralized populations, when diseases and injuries became one of the most challenges besides food and water1.
The percentage of people living in cities is rapidly increasing due to having an easy access to social services. To provide a chance for having equitable access to hospitals a convenient location of establishing the service centers is of great importance1. In the decision-making process to establish a new hospital or renovate an old one proper location plays an important role specifically with regard to guaranteeing the profit return on investment. In other words, determining the location of a hospital is an important factor that can affect the cost and benefits2. In 2006, Younis et al showed that the geographic location influences the profitability of a hospital i.e. financial performance3. Considering the projections related to the increase in urban population to greater than 5 billion by 2025 and its effects on increasing the vulnerability in addition to climate-change related risks, assigning a proper location for medical centers becomes a crucial factor for planners4,5,6, given its long time impacts7. For instance, in a study by Bell (2007) it was indicated that the location of a hospital would have a direct effect on survival in situations such as nuclear attacks8. Also Ochi (2014) stated that inappropriate location may cause damages to a hospital due to external hazards such as earthquakes9.
On the other hand, Sendai framework emphasizes structural disaster risk prevention and reduction measures as well as the promotion of resilience of new and existing critical infrastructures such as hospitals10.
In this regard, there are two main theories used to optimize hospital location. The first is based on the Weberian model, which focuses on a single objective namely the minimum cost or maximum profit. (WU 2007) The second theory has its roots in “behavioral approach” which simultaneously considers several factors to determine the most appropriate location. For instance, Analytic Hierarchy Process (AHP), a Multi-Criteria Decision-Making (MCDM) method, is based on “behavioral approach”11.
The present study through a systematic review aims to retrieve a list of disaster risk related criteria applied in hospital site selection (HSS).
Methods
Study design
This study is a descriptive systematic review investigating risk criteria in HSS. The 27-item Preferred Reporting Items for Systematic Review and Meta-analysis statement (PRISMA) 2009 checklist is used as a reference12. The study protocol was approved by the Higher Education Council of School of Public Health at Tehran University of Medical Sciences.
Search methods for identification of studies
In the present study, “hospital “refers to the legal institution that provides 24-h medical services, including accepting, visiting, admission, and treatment of injured and/or sick individuals13,14. “Site selection” refers to an operational problem solving research in which the researchers will find out the best location that meets the assigned preferences15. “Risk” refers to both the probability of an event (hazard) and its impacts on the exposed community (vulnerability)16.
Initially, four electronic databases (MEDLINE through PubMed, Scopus, Science Direct and Google Scholar) were searched up to December 31; 2015.The search strategy was based on the PubMed database model. The key terms were adopted from Medical Subject Heading (MeSH) when possible; otherwise appropriate key words were selected according to the expert idea. The expert team is including the authors’ team and 3 more volunteer PhD students at Health in Emergencies and Disasters from Tehran University of Medical Sciences with previous field experiences in disaster medicine. Titles and abstracts were searched with the following syntax:
Study eligibility
The inclusion criteria were articles that were published in peer-reviewed journals and had site selection criteria for a hospital. Gray literature including conference proceeding papers and thesis were included as well. All non-English articles were excluded.
Data collection and analysis
The key terms were searched in the databases separately and all articles were imported to a bibliographic management program (EndNote X3). Duplications were then omitted. The titles and abstracts were evaluated by two authors (MJM and BR) independently; in the cases that the exclusion criteria could not be applied, the full article was reviewed. If there was disagreement about the eligibility of a particular article between MJM and BR, the third author (AA) was asked to adjudicate. The electronic search was conducted from November 2015 to December 2015.
In the next step, the data were extracted out of the full-text of the included articles. This data included the first author’s name, the year of publication, and the first author’s country, the geographical scope, site selection criteria and the method of study. The references of selected articles was hand searched. Finally, the extracted site selection criteria were categorized through a focus group discussion by the expert team which has been described above already. The final results were sent to the expert team for confirmation through e-mails.
Quality assessment
A 9-question checklist was produced to assess the quality of the retrieved publications by authors (Table 3). The Quality-related questions investigated the following components: number of applied criteria for HSS, categorization of the applied criteria (Yes or No), source of applied criteria (i.e. the authors themselves, experts idea or review of literature) , GIS based method (Yes or No), explanation of why the analysis method was used (Yes or No), description of the candidate regions for HSS (Yes or No), number of candidate regions for HSS (i.e. the number of regions or a countless sites), discussion about the limitation (Yes or No), and discussion about the generalizability of the study (Yes or No).
The checklist was filled out by two assessors independently (MJM and BR) and “AA” adjudicated when there was disagreement.
Results
In the first step 41 studies were retrieved through the bibliographic search. After removing seven irrelevant and nine duplicates, 25 were remained. Sifting process left 15 eligible studies that were published up to the end of December 2015, 2 of them were identified from hand searching of references of included articles. Figure 1 illustrates the related PRISMA flow diagram. The result of quality assessment is summarized in Supporting Information file, S1 Table.
Fig. 1: PRISMA Flow diagram for systematic review of hospital site selection criteria
Table 1 summarizes the main results of the present study. The first article was published in 199517. The maximum number of articles were published in 2013, i.e., 6 articles. The total number of authors of the included articles was 38 (2.7 authors per article, in average). The first/corresponding authors were affiliated with different universities; among these, only K.N.Toosi University of Technology (in Iran) was associated with two publications2,18.
Table 1: Main results of the systematic review about disaster risk criteria for hospital site selection
HSS studies performed in China were 2, Iran (5), USA (2), Taiwan (2), Tunisia, South Africa, Israel and Bangladesh (1). Regarding the geographical scope, three studies were performed at the provincial or state level, two at the country level, five at the city level, and five at a district of a city.
With regard to the methodology, 10 articles used Geographical Information System (GIS), 5 studies applied AHP, and one used fuzzy AHP for site selection19. One study combined the AHP with the Ordinary Least Squares (OLS) method18 while another one combined AHP with the Rank Order Method (ROM)20. Other models that were used included mathematical modeling, Belief-Desire-Intention (BDI)2, Technique for Order of Preference by Similarity to Ideal Solution TOPSIS1, goal programming11, fuzzy Analytical Network Process (ANP)7, and travel-time methodology21.
Through a focus group discussion, with the above described expert team, all 39 HSS criteria were classified into six main groups namely cost, demand, environmental, administrative, disaster risk, and other concerns. The application percentage of each of these groups was 100, 93.3, 53.3, 33.3, 20.0, and 13.3 respectively (Figure 2).
Fig. 2: Usage of main groups of Hospital Site Selection Criteria in included articles.
The six mentioned groups were subsequently divided into 16 subgroups (Table 2).
Table 2: List of classified criteria for hospital site selection in included articles
Discussion
This systematic review was conducted to find out the disaster risk related criteria for HSS. According to the results, despite the increasing trend of worldwide disasters, risk related criteria are not taken into consideration to the extent that they should.
It is not mandatory and also not realistic to apply all these factors for HSS. Depending on the strategy for building medical centers, the planners may consider only some of these. For example, Kim et al (2013) conducted HSS in the construction of a hospital for the aging population and considered factors that looked at the real health requirements of the target group; thus, some criteria such as environmental issues (air and sound pollution and sewerage system) were not considered22. Soltani et al (2011) used several criteria such as urban planning, traffic volume, and travel time for site selection of a hospital in district five of Shiraz, Iran; however they did not consider environmental and land specification issues in their study7. As the main goal of Wu et al (2007) was ensuring competitive advantage for HSS, they considered administrative criteria such as regulations, policymaker’s attitude, and even demand for the hospital personnel. They did not consider environmental concerns and accessibility to infrastructures such as main roads, as well23.
Alavi et al. (2013) considered two groups of factors that affect accessibility (roads and social services) and also distance from potential hazards (faults and industrial centers) for one region of the capital city of Tehran, Iran. However they did not use future planning development, real demand for hospital in the region, existing health services, and other land specifications1. Also Jing-Er Chiu and Hang-Hao Tsai (2013) used MCDM to determine the optimal location for expansion of a regional teaching hospital in Yunlin County, Taiwan. They used highly detailed criteria including the demand for medical service, cost, transportation, sector support, and future development. The main theme considered in their study was increasing the competitive advantage for the hospital24.
In 2014, Xiao-Hua Hu et al developed a model to identify the proper location for medical and health services in a large group of islands in Hainan Province in China. This model was based on minimizing the travel distance for clients of these services. In this study, the real demand and environmental issues were not considered25.
To achieve sustainable development, a community should consider important issues in building and utilizing a new hospital. In HSS procedures, environmental considerations are important issues26,27,28. While important, the majority of publications devoted more attention to cost and demand rather than environmental issues such as air and noise pollution as these have sever negative effects on hospital functions. In addition, following the completion of the hospital, these types of pollution would be aggravated.
Regarding the cost concerns, most of the studies devoted attention to accessibility by main roads and arteries. Other cost subgroups were proximity to infrastructures, and land specifications (availability, use, texture of the ground, being vacant, and ownership). However, none of the articles discussed the beneficial aspect of the proximity of the hospital location to airports or seaports.
Concerning the demand category, health service utilization of the community was assessed according to the total number of required beds, the patient transfer rate, and the number of patients rejected by hospitals11,18,22. In this category, epidemiological indices such as “burden of disease” and forecasting demand for health care based on demographic factors, economic growth in the area, and even new technologies in health system could be considered. For example, oil and energy activities are a great source of economic development but require a certain type of health care infrastructure when it comes to emergency medical services including trauma and cardiac patients.
As construction of a hospital is a kind of investment, the investors wait for future profit. Hence, threats to this investment should be taken into account. For more than 25 years, WHO has promoted and supported the efforts to the purpose of safe hospitals to improve the function of hospitals in emergencies and disasters. Besides, in Sendai Framework (2015-2030)10 the application of the principles of universal design and standardization of building materials in critical facilities such as hospitals is considered with the aim of disaster risk prevention and reduction. Unfortunately, few articles discussed hazards such as faults and industrial areas 1,11,27. Other potential hazards, such as floods and man-made disasters, should be considered for at-risk areas. Considering the “risk”, rather than merely hazards, is highly recommended in future permanent and field hospital site selection studies.
The two unclassified criteria, namely unforeseen circumstances and other competitive hospitals were considered in the “Other” category. It is recommended that the safety and security of the candidate locations, rural versus urban areas, local investors, accessibility of communication systems, and availability of competent and qualified staff be considered in this category in further studies.
Conclusions
Despite the critical role of hospitals in health service delivery in disasters and emergencies and the effect of hospital location on the quality of these services, few articles have considered hazards as the criteria for hospital site selection (HSS). Cost and demand are two groups of criteria that have been addressed more frequently in HSS studies. The decision makers should prospectively match the main objectives of hospital building with the HSS criteria according to the strategy of site selection and the availability of data and resources. Undoubtedly, being safe and remaining functional in emergencies and disasters should be one of the main objectives in HSS in line with Sendai Framework. More comprehensive criteria like “risk of hazards” and “burden of diseases” are suggested to be considered in future studies.
Limitations
Non-English articles were not included in this study.
Supporting Information
S1 Table: Quality assessment results for included publication in HSS systematic review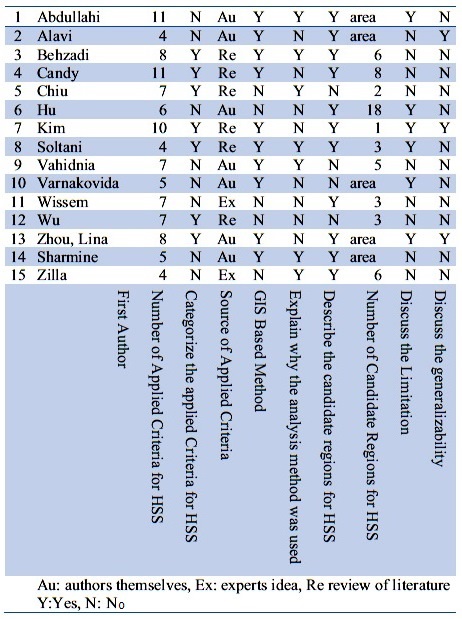
Corresponding Author
Ali Ardalan, MD, PhD
E-mail: [email protected]
Tehran University of Medical Sciences, Tehran, Iran
Data Availability
All relevant data are in the article.
Competing Interests
The authors have declared that no competing interests exist.
Introduction
This short report presents a response to the article written by Cibulsky et al. (2016) 1 ‘Mass casualty decontamination in a chemical or radiological/ nuclear incident with external contamination: guiding principles and research needs’. The paper by Cibulsky et al. presents a useful and timely overview of the evidence surrounding the technical and operational aspects of mass casualty decontamination. It identifies three priority targets for future research: operational analysis to determine the best ways to integrate casualty decontamination into the incident response and coordinate it with medical evaluation and treatment; comparative study of the efficacy of various decontamination methods and their potential adverse effects; and behavioural, communication and privacy issues, including what casualties and community members need during an incident that requires mass decontamination, and how their needs can be met in ways that best support compliance with and effectiveness of casualty decontamination.
We agree that each of these areas is a priority for future research. However, while further investigation into behavioural, communication and privacy issues during mass decontamination is warranted, there is now a substantial body of research in this area which is not considered in detail in the succinct summary provided by Cibulsky et al. (2016) 1. In this short report, we summarise the available evidence around likely public behaviour during mass decontamination, effective communication strategies, and potential issues resulting from a lack of privacy. Our intention is to help further focus the research needs in this area and highlight topics on which more research is needed.
Behavioural (likely public behaviour)
Traditionally, planning and policy for mass decontamination has focused on the technical aspects of mass decontamination, such as developing and testing decontamination equipment, with little consideration of likely public behaviour. Where likely public behaviour has been considered in planning for incidents involving mass decontamination, there has been a reliance on common myths about crowd behaviour, such as inherent public disorder and mass panic 2. However, over 50 years of research has shown that panic occurs very rarely during mass emergencies and disasters, and that people are much more likely to behave in a helpful and cooperative way 3,4,5,6,7. This reliance on assumptions about panic has resulted in little attempt to develop strategies for communicating with members of the public during decontamination; if people are going to behave in an irrational way then there won’t be any point in trying to communicate with them. Indeed, research suggests that assumptions about panic may lead to information being withheld from members of the public, which may actually create the very disorder 8,9 and non-compliance 10 which authorities are hoping to prevent.
Evidence from small-scale incidents involving decontamination shows that those people who are affected may refuse to comply with decontamination procedures if they are not provided with sufficient information about why decontamination is necessary, and what the process involves 2. Findings from large-scale field exercises and field trials involving mass decontamination suggest that, if sufficient information is provided and the people involved believe that responders are being open with them, members of the public are likely to be willing to comply with decontamination 11,12, and also willing to help others to undergo decontamination 12,13.
Overall, these research studies show that public behaviour is likely to be contingent on the way in which emergency responders manage the incident. Emergency responders who communicate effectively with members of the public and show respect for their needs change the relationships and that, consequently, results in more positive outcomes from the incident, in terms of reduced public anxiety and increased public compliance and cooperation. Thus, if managed well, members of the public can actually be an asset to emergency responders in their attempts to successfully manage the incident.
Communication and privacy
Effective communication is essential during mass decontamination – failure to communicate effectively can result in reduced public compliance and cooperation, increased confusion, and even attempts to challenge responders’ authority. Several research studies have examined how different perceptions of responder communication can affect public compliance and cooperation, as well as levels of public anxiety, during mass decontamination 11,14,15.
A recent mass decontamination field experiment specifically tested three different responder communication strategies, in order to try to identify what makes some communication strategies more effective than others 12. Results from this study revealed that, for a communication strategy to be effective during mass decontamination, it should include open and honest information about the nature of the incident, health-focused explanations about the importance of decontamination, and sufficient practical information to enable those people who are affected to successfully undergo decontamination. Crucially, the inclusion of an effective communication strategy not only resulted in more positive psychological outcomes for those affected, it also resulted in improved speed and efficiency of decontamination on objective measures 12. Therefore, this could save lives during a real incident.
As well as the provision of effective responder communication, another key issue during mass decontamination will be whether members of the public feel they have sufficient privacy 16,17,18. It is crucial that emergency responders show that they are doing what they can to respect public needs for privacy and modesty; failure to do so can result in reduced public compliance and cooperation 2,12,13,14,19.
Several research studies have examined the mechanisms underlying the relationships between effective responder communication, sufficient privacy, and positive outcomes during mass decontamination 12,14,20. Findings show that effective communication from emergency responders and the provision of sufficient privacy are crucial because they enhance public perceptions that responders are behaving in a legitimate way. Enhanced perceptions of responder legitimacy facilitate increased identification between members of the public and emergency responders, as well as amongst members of the public, and it is this identification which leads members of the public to actively engage with the decontamination process.
The findings from these research studies have been used to generate recommendations for emergency responders when managing incidents involving mass decontamination 15, and so far have been included in US decontamination guidance documents for emergency responders 21,22,23.
Conclusion
This research programme can be used to inform best practice for managing casualties during mass decontamination. However, as noted in Cibulsky et al. (2016)1, there is a need for further research in this area to optimise casualty management strategies for mass decontamination. Ongoing work related to the development of optimal management strategies for mass decontamination is being carried out as part of the NIHR Emergency Preparedness and Response Health Protection Research Unit (EPR HPRU) (https://epr.hpru.nihr.ac.uk/). This research includes a qualitative study of factors which affect perceived public acceptability of different decontamination methods, part of which involves testing the effect of different responder management strategies on perceived public acceptability of mass decontamination. The research also examines cultural factors which may affect public willingness to comply with different decontamination methods. Further research could include analysis of data from real incidents involving decontamination, as well as new field studies and exercises testing different responder management strategies. In particular, future research should consider practical aspects of communication, such as how best to deliver information to members of the public during the decontamination process, and also how best to protect casualties’ privacy and so promote compliance with the decontamination process.
Competing Interests
The authors have declared that no competing interests exist.
Correspondence
Holly Carter: [email protected]
Methods: The current review presents a conceptual framework for studying psychological aspects of crisis and risk communication using the social media through social computing.
Results: Advanced analytical tools can be integrated in the processes and objectives of crisis communication. The availability of the computational techniques can improve communication with the public by a process of Hyper-Targeted Crisis Communication.
Discussion: The review suggests that using advanced computational tools for target-audience profiling and linguistic matching in social media, can facilitate more sensitive and personalized emergency communication.
]]>Background
The extensive use of social media in modern lives redefines social interaction and communication. Many of us are heavy consumers of the different channels of the social media, whether it is social networks, microblogs, photo sharing, forums, blogs or other types of the media. Nowadays, we are passive absorbers of information and active distributers of it. Many people spend a considerable portion of their time maintaining their virtual social networks, expressing themselves in different settings, staying tuned with the latest news and finding relevant information. During and following crisis or emergency situations, people turn to social media for various reasons, to make sense of the world through words, or as described by Lahad1 for the natural need of the storytelling animal’. We express ourselves and share our inner world through combination of words that others instantly absorb, process and act upon.
Disaster situations increase the need for information. The need, roots from high levels of uncertainty, true threats to life or health, and often manifest themselves in an urgent necessity for immediate information2. Effective crisis communications can therefore serve to mitigate anxiogenesis and direct rapid and focused rescue, recovery, and rehabilitative operations3. In the past, in such situations, the mass media disseminated messages and information to the public. Social media has revolutionized how individuals interact and how organizations and decision makers communicate with the public during routine and emergency times through the possibility of mass interactive communication. It has been suggested by practitioners that successful message phrasing, delivered to specific groups with specific characteristics, plays a crucial role in the communication process 4. While tuning to the public is a challenging task, the application of state of the art computational methods on the huge amount of user-generated textual content in social media, can enhance public understanding through insight extraction.
The current review seeks to clarify the following topics:
Finally, we will discuss where and how the introduction of new media and the advancement of social computational approaches calls for an update of theories and models of crisis communication.
Literature Review
Social Media and Crisis
The rise and proliferation of Web 2.0 applications revolutionized the way people interact and collaborate with each other. At the core of the Web 2.0 framework, are the social media, “a group of Internet-based applications that build on the ideological and technological foundations of Web 2.0, and that allow the creation and exchange of User Generated Content (UGC)”6. Social media nowadays includes collaborative projects, blogs and microblogs, content communities, social networking sites, virtual game worlds and virtual social worlds. Through these applications, users create online communities to share information, ideas, personal messages, and other content. This user-generated content in a changing and dynamic virtual community creates a massive and unstructured data6.
In modern society, the significance of the social media in everyday life has increased dramatically, turning the world into a “global village”7. Since the late-20th century, new methods of mass media including the internet, cellular technologies and personal portable devices, have been considered as fulfilling a significant role in agenda setting and framing8, creating social capital9, and affecting politics, society and culture10. According to a recent report that summarizes social, digital & mobile statistics among global users11, 42% of world’s population are active internet users, and above one-quarter have active social media accounts. With regard to social networking platforms, the report shows that there are 1.36 billion Facebook users, 629 Million Qzone users (Chinese social network), 343 million Google+ users, 300 million Linkedin users and 271 million Twitter users. Twitter, a microblogging communication platform, for instance, reaches an estimated total of over 50 million tweets per day12, and during crisis twitter activity increases exponentially13.
Social media has become an essential mean of communication during disasters and it has been suggested that best practices need to be established to assist organizations, government and decision makers in optimizing risk and crisis communication in this era 14. Houston et al.15 developed a framework for the practice and study of disaster social media. They note that disaster social media users in the framework include communities, government, individuals, organisations, and media outlets. Those players seek to gain insights from the massive user-generated content published in the communication channels, provided by the social media platforms. This published timely information is quickly spread across multiple social networks, and may affect, shape or direct public behavior without official involvement or even in contradiction to formal instructions 16. Although many challenges exist during social media message processing and analysis, (e.g. management of information overload, credibility issues, and prioritizing different classes of messages), state of the art computational methods exist to carry out complex information processing operations. 17
Crisis Communication
Crisis communication can be defined broadly as the collection, processing, and dissemination of information required addressing a crisis situation. Crisis communication is a research and practice field in various setting and crises; including national18, organizational crises19,20 , natural21 , man-made22 and technological disasters23. Effective communication with the public remains a crucial role in public safety through crisis preparation and response24. The media are critical for facilitating pre-disaster preparedness, disseminating warning messages of pending disasters, providing information to citizens about the disaster, and facilitating recovery efforts25. Moreover, according to Firestone & Everly3 , crisis communications can play an important role in mitigating, or exacerbating, the psychological and behavioral reactions to critical incidents and disasters. One important adjacent field of crisis communication is Risk Communication, defined as any purposeful exchange of information about health or environmental risks between interested parties (e.g. governments, agencies, media, citizens and more)26. Reynolds and Seeger27 prposed a merged and comprehensive approach called “crisis and emergency risk communication”.
Social Media as a crisis communication platform
Social media has been radically changing the communication landscape over the past several years and as a result, crisis communication is undergoing substantial change28. It becomes clear that social media serves as ultimate space for crisis communication processes. Implementation of traditional crisis communication activities, was identified as one of the functions of disaster social media15. A recent survey29 of about 288 government officials in the US revealed that 71% of them were using social media during crisis, with Facebook as the popular social medium. Officials used social media during various types of crises, including public health30, natural disasters, transportational, political, social and criminal crises. Researchers found that the degree of social media use, rather than the number of tools used, was positively correlated with local city officials’ evaluations of their ability to control a crisis situation and the strength of their responses29.
Another research team31 systematically investigated crisis messages collected from Twitter. Relevant tweets for 26 different crisis situations that took place in 2012 were sampled from the available public twitter stream, and for each situation types of information and sources of that information were examined. During crisis situation, eyewitnesses, government, NGOs, business, media & news organizations and outsiders participate and publish different information types in social media 31. Types of information include data about affected individuals (e.g. people trapped, casualties, people missing, found or seen), infrastructure & utilities (e.g. damages, reports about environment, and availability of services), donations & volunteer (e.g. donations of money, goods of services; requesting help; shelter needed, food shortage/distribution; volunteer information); caution & advice (e.g. warnings, preparation; caution & advice; tips; safety), sympathy & emotional support (e.g. concerns and condolences; gratitude, prayers; support; emotion-related info) and other useful information (e.g. flood level; weather, wind, visibility; information verification). Based on the available data of that study (https://crisislex.org/tweet-collections.html), it seems that the Government, being the official source of information during crisis, was responsible for less than 5% of all published information. Of the applicable information types, the majority (32%) of the communication efforts by the government were about useful information (32%) and caution and advice (27%). Only 6% of the published tweets concerned about sympathy and support.
Effective Crisis Communication.
Seeger32 demonstrated ten best practices of crisis communication, drawn from a literature review and verified by expert crisis communication panel that reached high consensus. Seeger32 divides the recommendations into three broad categories: strategic planning, proactive strategies and strategic response. These are used as principles or processes that underlie an effective crisis communication plan and an effective crisis response.
Covello, McCallum, & Pavlova33 note that detailed, in-depth knowledge and understanding of both the characteristics of target audience and the community in which the target audience resides, are needed for effective message development. Target audience characteristics include knowledge, attitudes, perception, behavior, beliefs, values, needs and concerns, while community characteristics include information about social networks, opinion leaders and community dynamics. Covello34 suggested several risk communication templates to utilize in the process of risk communication: 1) CCO (Compassion, Conviction, Optimism) template, which is particularly useful when responding to a question indicating a high level of emotion or outrage4. 2) Primacy/Recency template35 emphasizes the first and last messages in the communication due to the restriction of recall of information. 3) 27/9/3 template states that the combination of the three key messages should equal a total of 27 words, 9 seconds spoken aloud, and 3 key messages34. 4) AGL-4 (Average Grade Level minus 4)4 template recommends phrasing the message at four reading grade levels below that of the stakeholder – taking into account the national reading grade level. 5) 1N=3P (Negative equals 3 positives) template counterattacks the weight of negative messages by introducing three positive messages for every negative message. 5) TBC (Trust, Benefits, Control) template suggests to phrase three messages that are phrased with specific order and content (trust first, benefits second and control last). These templates, however, were not empirically tested and thus limit our certainty regarding effective messaging.
The media plays a crucial role in shaping public response to terrorism and other disasters25. Effective crisis communication suggests the need of an unhindered but purposeful exchange of information within and between authorities, organizations, media, involved individuals, and groups before, during, and after a crisis36. Covello et al.33 also argue that risk communication is no longer a neglected topic within government. With the changing media environment and the developing online atmosphere, traditional media are shifting to practices that are more adapt to a social media environment37. Furthermore, to improve services and communication with the population, government officials seek to leverage these new media channels. Nevertheless, Graham, Avery & Park29 emphasize that government’s engagement through social media should be more active and reflect a clear response priority in crisis communication plans. Ambiguous or unreliable communications can cause damage and serve to exacerbate publics’ mental health reactions and a delay in operational response and recovery38To conclude, it is important to incorporate the use of citizen generated content into any crisis plan and learn to respond to the media and public even quicker than before39
Models and theories of Crisis Communication. Over the years several models of crisis communication were developed40, such as the Situational Crisis Communication Theory (SCCT41). SCCT “predicts the reputational threat presented by a crisis prescribes crisis response strategies designed to protect reputational assets”41, especially in organizational context.
Chaos Theory42 was described as a general framework for understanding crisis communication43. CT argues that chaos or disorder may be the necessary precursor of a higher level of order. CT functions best at the broad level of a paradigm for understanding the behavior of complex systems. Seeger43 adds that in the context of CT, small variance in communication processes, message phrasing, distribution, timing or other factors may produce extensive fluctuations in systems, leading to bifurcation.
Reynolds & Seeger27 presented the Crisis and Emergency Risk Communication (CERC) five-stage integrative model. The model blends crisis and risk communication together into a processes model (see27), assuming that crises will develop and progress in a predictable and systematic ways. According to the working model of CERC, communication processes occur during five stages: 1) Pre-crisis, 2) Initial Event, 3) Maintenance, 4) Resolution and 5) Evaluation. In each stage, communication can have different aims, strategies and target audiences.
With the advancing new media, the social media aspect was integrated in these models. For instance, the Social Media Audience Sharing Model (SMA)²24 aims to increase the reach for messages disseminated via a given social media platform in the context of an emergency. Social mediated crisis communication model (SCCM)44 is another model that serves as a framework for crisis communication management in the changing media landscape and explains how the source and form of crisis information affect organizations response options and provides recommended social-mediated crisis response strategies. The Networked crisis communication model45 examines the influence of communication strategy and media type on damage to reputation, as well as secondary crisis communication and secondary crisis reactions. Although these models recognize new players in the crisis communication processes (e.g. influential social media creators, follower, and the growing empirical evidence that emphasizes the psychological functions of social media during emergency management – during most of the time, less or no consideration is given to psychosocial aspects during crisis communication. The need to focus on other participants (such as the public) rather than the organization or the responding authority, is echoed in Liu & Fraustino46 who suggests that scholars should move beyond predominantly focusing on image management, emphasized by dominant crisis communication theories
Accommodated Communication
Considerable research, using text derived from social interactions, such as natural conversations and social media conversations, suggests that individuals tend to converge in various dimensions such as posture, pause length, utterance length, self-disclosure, head nodding, backchannels and linguistic style47. Niederhoffer & Pennebaker48 studied psychometric properties of language in dyadic interactions and assessed the degree to which people coordinate their word use in natural conversations, derived from internet chat and laboratory conversations. Based on a text-analysis software, they found that individuals in dyadic interactions exhibited linguistic style matching (LSM) on both the conversation level as well as on a turn-by-turn level. LSM found in research to be a predictor of social dynamics in small online and face-to-face groups49. LSM, also found to be a robust marker for romantic relationship stability, stressing the importance of similarity in the way people converse with each other in the context of interpersonal processes50. Lord, Sheng, Imel, Baer & Atkins51 saw that’s language style synchrony between client and therapist was predictive of empathy ratings during evidence-based behavioral treatments like motivational interviewing (MI). Therefore, it is apparent that synchronized verbal behavior holds an important role in various interpersonal interactions.
LSM, in fact is a derivative of Communication (or speech) Accommodation Theory (CAT), an intergroup theory of interpersonal communication, provides a framework for understanding how and why people adapt their communication toward and away from others and the social consequences of doing so. The theory holds that people tend to preform accommodative and non-accommodative moves, to reduce or increase significant social distances between the speakers, depending on the different circumstances. Convergence and divergence, called in the CAT approximation strategies, include the adaptation (or the alteration) of communicative behaviors in terms of wide range of linguistic-prosodic-nonverbal features. The theory also proposes different patterns of accommodation (upward vs. downward, and symmetrical or asymmetrical), based on the reciprocity of the speakers52. During the last years, examination of CAT progressed to the domain of electronic communication, such as e-mail, text messages, voice mail and recently also was adapted to electronic communications and the social media sphere. Danescu-Niculescu-Mizil et al.47 examined and verified the hypothesis of accommodated communication in the context of twitter conversations. The researchers developed a probabilistic framework that enabled to model accommodation and measure its effects. They focused on linguistic style feature, derived from the Linguistic Inquiry and Word Count53.
To the best of our knowledge, CAT was never integrated in any crisis communication models published in the academic literature. The closest domain LSM, was mainly researched in the context of crisis negotiations of suicidal and surrender outcomes, and hostage taking negotiation outcomes54,55,56. In these studies, the researchers analyzed the correlations between the linguistic behavior of each communicator across 18 linguistic dimensions, like word count, prepositions, negations, emotionally toned words and others. LSM was assessed by the strength of the correlation and averaged across all conversations taken into account. The studies showed that negotiators (police officers and hostage takers) tended to show greater levels of linguistic style matching in successful negotiations compared to unsuccessful negotiations57, and an overall consistency in the linguistic behavior of subjects and police negotiators in surrender and suicide incidents54.
Interestingly, linguistic matching or accommodated communication is not emphasized in the processes models of crisis and risk communication, and possibly is taken for granted. Even when a certain aspect that is related to crisis communication with the public is presented, such as crisis communication strategies from the Situational Crisis Communication Theory41, linguistic features and linguistic accommodation are not explicitly mentioned as being part of the processes. Some research considered other aspects like number of words, number of sentences and words per sentence58. In other words, when a crisis communication model, like the networked crisis communication model45 and social-mediated crisis communication model59, mentions elements like message form or message strategy, it ignores the linguistic characteristics of the message. The best practices in crisis communication32 introduce general principles of crisis communication, such as strategic planning, proactive strategies & strategic response, and each include sub categories that can be directly related to public communication, e.g “be open and honest”, “communicate compassion” and “provide self-efficacy”. Since speakers’ verbal style also influences how messages are perceived60, we suggest that even if crisis managers will act according to these principles, they should employ certain linguistic styles and consider delivering messages in public accommodated language
Social Computing
“Computational social science is an emerging research area at the intersection of computer science, statistics, and the social sciences, in which novel computational methods are used to answer questions about society”61 (p. 257). Ericson62 argued that social computing refers to “systems that support the gathering, processing and dissemination of information that is distributed across social collectives. Furthermore, the information in question is not independent of people, but rather is significant precisely because it linked to people, who are in turn associated with other people.” Scholars63 stated that social computing represents a new research frontier for information systems. Social computing environments present settings for data collection on a wide variety of aspects for researchers interested in online behavior of individuals, both in natural observations and for controlled experiments.
Behavioral Targeting.
Behavioral targeting (BT), also called online profiling64 or hypertargeting65 uses historical user behavior to predict user behavior and affinities in web applications such as targeting of online advertising, content personalization and social recommendations66. BT is used by online advertisers to increase the effectiveness of their campaigns, and is playing an increasingly important role in the online advertising market67. Through series of experiments, compared to standard run of network advertising, BT advertising was found to be more successful, creating greater utility for consumers from more relevant advertisements and clear appeal for advertisers from increased ad conversion68. User profiling is performed using novel computation techniques66,69, commonly fall inside the social computing paradigm, an approach to analyze and model social behaviors on different media and platforms70. Van Dam & van de Velden71 proposed that social networks, like Facebook, can be “operationalized to gain insight into the individuals connected to a company’s Facebook site” (p. 60). In their study they describe a user profile data collection framework that uses “Facebook insights” (accessed by the admin) and other personal public information on Facebook to cluster users. They propose that their methodology can be implemented into an analytical customer relationship management (CRM) framework aimed at the analysis of customer characteristics that may help improve a firm’s customer management strategies.
Recommender systems.
Ricci, Rokach, & Shapira72 defined Recommender Systems (RS) as “software tools and techniques providing suggestions for items to be of use to a user” (p. 1). They add that since recommendations in most cases are personalized, different users or user groups receive different suggestions. RSs try to predict what the most suitable products or services are, based on the user’s preferences and constrains (learned and collected from users. Many product purchasing sites like Amazon and E-Bay use advanced recommendation engines73, but social networking sites (e.g. Facebook) use RS as well, to “push” relevant social content based on use preferences, actions and texts74.
Recommender systems in Emergency. In the context of emergency, the existing published literature suggests that recommendation systems can be integrated for improved disaster management75, Construction and real estate crisis management76 and supply distribution in emergency77. However, we could not find existing literature of how crisis communication can be aided by RS. More specifically, how crisis messages are selected for individuals or groups of individuals based on some characteristics. Research shows that integrating data obtained from popular social media networking websites significantly can improve results of existing recommendation systems78.
Computational social science in the face of disasters.
Over the past years technologies that rely on citizen sensing have been playing a major role in real life applications, such as public and environmental health surveillance79, and other participatory social activities80,81,82. Purohit, Castillo, Meier & Sheth83 noted that with the explosion in social media and the universal mobile access– researchers have unique opportunities to “extract social signals, create spatial-temporal mappings, perform analytics on social data, and support applications that vary from situational awareness during crisis response, preparedness and rebuilding phases to advanced analytics on social data, and gaining valuable insights to support improved decision making”. (p. 1).
Social computing, analytics, visualization for crisis communication.
In the era of big data analytics and social media, incorporation of business intelligence systems in the organization are very common. These systems are responsible for data processing, analysis and visualization for better decision making and business function. Based on a recently published taxonomy in the domain of text analytics and visualization84, one can find various analytical tasks and visualization tasks with specific aim. The tasks are common text analytical procedures85,86, and include: 1) Text Summarization / Topic Analysis / Entity Extraction, 2) Discourse Analysis; 3) Sentiment (Opinion) Analysis, 4) Event Analysis; 5) Trend / Pattern Analysis; 6) Lexical / Syntactical Analysis; 7) Relation / Connection (Association) and 8) Translation / Text Alignment Analysis. These tasks later serve for visualization procedures for: 1) Region of Interest, 2) Clustering / Classification / Categorization, 3) Comparison, 4) Overview; 5) Monitoring; 6) Navigation / Exploration; 7) Uncertainty Tackling.
Tables 1 & 2 summarize current state of the art of how social computing and text analytical tools can be integrated in the best practices of crisis communication27,32. We focus on the objectives in the processes of crisis and emergency communication27 that occur in different times of the crisis life cycle and have direct association to communication processes with the public. Finally, we describe how computational and analytical tools can be utilized to accomplish these aims.
Table 1: Analytical Tasks in the domain of Text Mining & Analytics for Crisis and Emergency Communication using Social Media
Table 2: Visualization Tasks in the domain of Text Mining & Analytics for Crisis and Emergency Communication
Monitoring and recognition of emerging risk.
Information extraction tools using pre-defined lexicons of crisis related terms87,88, as well trend analysis (e.g. hashtag or term anomaly detection) could be a useful way to spot potential risks in the environment, based on social media feeds and streams, that previously have shown themselves to be valuable sources of real-time information about what is happening in the world89. Social Media feeds can represent a hybrid form of a sensor system that allows for the identification and localization of the impact area of the event90,91. Next, using text visualization techniques, geo-located information can be mapped and depicted in a way a potential risk can be categorized according to its geographical occurrence. As people will explicitly mention different terms related to potential risks, dynamic map would show categorizations of the terms into risk topics, allowing crisis managers to monitor risks.
General public’s understanding of risk.
Public’s knowledge of risk is conducted most of the times through surveys33. However, it can also be inferred from social media discussions. Emergency authorities can, for instance, publish question regarding different issues related to specific risk in their feed (e.g. lifesaving behavior in wild-fire) and later investigate the discussion followed by post publishing. Research shows that social media discussions tend to be topic dependent92,93, especially when the page posts direct questions and asks the general public to discuss an issue. Crisis managers could train text responses over documents that an expert panel would consider as relevant to the original question (e.g. “what is the correct lifesaving behavior during wildfire”), and also classify documents according their answer correctness using Natural Language Processing (NLP)94 and classification algorithms86. Overview level of the public understanding of risk, based on social media discussion, then could be visualized using simple pie charts.
Message development in crisis communication.
Based on the variety of approaches presented above, this aspect can be aided by discourse analysis95, linguistic analysis and natural language processing. Using lexical approach96 and psycholinguistic tools53, crisis managers can analyze messages from different perspectives– from syntactic features of the text and various word meaning categories (e.g. LIWC categories). We propose that integration of such tools would enable to observe whether all pre-designed crisis messages are adapted to the target audience’ communication capacities.
Affected public opining mining.
To gain feedback from the affected public, one should monitor social media and extract signs from citizen who speak and discuss the emergency. Temnikova et al.88 presented a terminological resource, EMTerms, which include over 7,000 terms used in Twitter to describe various crises, classified into 23 information-specific categories (e.g. caution and advice, infrastructure damage, supplies needed or offered, personal updates, safety and security and more). Such resource can assist decision makers monitor different categories of information, and later communicate to the public on the most prominent information. Once information is retrieved, automated text analytical approaches, like opinion mining, can assist in capturing public’s perceptions. Opinion mining refers to the extraction of emotion, appraisal and opinion words that are associated with certain social issue, people or entity (e.g. product, public figure, and event) and the classification of the words into different opinion categories (e.g. positive vs. negative, support vs. against)97. Seeger32 argued that capturing public’s perceptions are important due to the tight association between beliefs and actions. He adds that monitoring public’s risk perceptions and opinion prior and during crisis is essential for crisis response and message adaptation to public’s needs and concerns. This text analysis procedure has various application in a review summarization & classification, market and brand analysis98, political opinion analysis and decision making. Opinion and sentiment classification is performed on a document and sentence levels by extracting relevant features (e.g. single and/or multiple words, emoticons) from the text and applying computational techniques for estimating the overall polarity or direction of the text. The most common methodology involves pre-defined sentiment or opinion lexicons that carry thousands of domain-specific words, or machine learning techniques that use supervised learning for sentiment classification.. In the context of natural/human made disasters, the assessment of sentiment is somehow scarce. Nagy, Valley, & Stamberger99 compared methods for evaluating sentiment in disaster microblogs and explored patterns of change in emotion of the crowd during a technological disaster. Unfortunately, assessment of sentiment towards the general crisis event provides only partial information for crisis communication practitioners regarding crowd opinion, since it is not matched to specific risk or issue, and more
In the case of health crisis and pandemics, however, considerable research is found. For instance, in the case of swine flu pandemic, Salathé & Khandelwal100 used publicly available data from users of online social media and measured spatial-temporal sentiment towards a new vaccine over a period of six months. They further found strong correlation between sentiments expressed online and CDC-estimated vaccination rates by geographical region. This provides good example of how policy makers can use publicly available data to learn about public’s perception regarding risk and its’ related behaviors.
Misunderstanding/Rumors Corrections.
Possibly one of the most researched topics in the domain of disaster computing and social media research during crisis, is information credibility101,102. Castillo et al.102 analyzed information credibility of news propagated through Twitter and suggested that by using automated methods a tweet can be classified with up to 80% precision as being credible or not. Their automatic credibility estimation was done by extracting message-based features (e.g. text length, sentiment ratio in the text, inclusion of hashtag), user-based features, topic-based (e.g. aggregates computed based on message and user based features), and propagation-based features (e.g. depth of a retweet in the network of message spread, initial tweets per topic).
Evaluation and assessment of responses, including the effectiveness of communication.
Similarly to the previous section, evaluation of public responses can be achieved through continuous social media monitoring using opinion mining, to infer on concerns, panics, and the emotional impacts of interactions among social media users103. Recent studies demonstrated capabilities to track changes in sentiments of affected public during natural disasters99,103,104.
Proposed Process of Hyper-targeted Crisis Communication in Social Media (HCCS)
In the above paragraphs, we described how advanced analytical tools can be integrated in the processes and aims of crisis communication. We suggest that the availability of the computational techniques can improve communication with the public by a process of hyper-targeted crisis communication. Figure 1 demonstrates how the data posted and shared through social media is collected for monitoring, analyzed and prepared for a tailor-made crisis communication.

Fig. 1: The Process of Hyper-targeted Crisis Communication in Social Media (HCCS)
In the process, massive amounts of textual user-generated content in social media is continually generated and monitored for crisis or emergency related communication. Once detected, content is collected and transferred to the analytical phase, where it is preprocessed, analyzed according to various text mining analytical methods. The information then is either transferred for reporting where it can be visualized and interpreted or moves to the communication management module. Authorities, crisis managers and designated spokespersons personnel can communicate with the public, using the communication management module, which include a recommender system that proposes matched messages. This sub-system is also responsible for target audience profiling (i.e. hypertargeting), that enables accommodated communication to specific groups in the population. Bi-directional communication is then monitored for matching accuracy and secondary messages in the communication. During the conversation, a crisis messaging recommender system formulates messages based on conversation history and the other available parameters.
Benefits of Targeted Crisis Communication
Automatic categorization of unstructured vital information is of high importance for speeding up disaster management. More precisely, psychosocial information extraction is valuable for decision makers to understand the endurance of the public, public’ psychological needs and psychological risk, using validated theoretical models in the field of disaster psychology105. Being able to capture these aspects, emergency authorities can be more synchronized with population needs and thus more effective in their response to the public during disaster. By integrating disaster related psychosocial aspects in a command and control disaster management systems, they will be in a better position to manage the situation and speed up recovery.
Successful detection of language choice patterns from social media content may assist in guiding the authorities and service providers to respond on the same communication “channels” of the public, and enhance responsiveness and interactivity. This can further lead to a more cooperative public and enhanced public morale. It is our assumption that such focused messaging may not only improve the reception of the message, but also contribute to the ensuing behavior or compliance which is critical in disasters.
Limitations of the present review and currents challenges
One should remember that beyond text, additional forms of data are published on social media, sometimes far more influencing, since pictures (regular photo or meme) may generate more engagement than other forms of data (including text and video)106. Research documents applicable tools for multimodal analysis of social media content, that include both textual and visual data, e.g. Flicker photos, YouTube videos and more107. Thus, more precise public monitoring could be accomplished when integrating data from different modalities and content qualities, as adjacent task in the crisis communication processes. The above literature focused mainly on text that appears in the social media, that can be extracted and analyzed. As for now, some social media platforms offer easy means of extracting data, like the Twitter Streaming API108. One limitation in social media analysis is the inaccessibility to Facebook public feed API, which is restricted to a limited set of media publishers. This limitation is restricting research institutes and companies to obtain public posts, in a similar way that is available in Twitter. It is possible, though, to extract data from Fan Pages and Groups using publically available applications, like NetVizz109.
Decision makers should not solely rely on text analytics in social media when doing crisis communication. Though social media is very popular and has very high penetration rate11, some social and age groups in the population are not connected to the internet110. As this population tends to receive the information and guidelines during real time emergency via TV, radio, newspaper and word-of-mouth -the instructions will still need to use traditional means of mass communication..
Despite recent anecdotal reports indicating that authorities (e.g. Home-front command) increase their presence in the social media and continuously interact with the public in times of calm and emergency, still authorities prefer to communicate with the public in non-interactive means. This was previously mentioned as an obstacle for crisis communication111 in light of the raising of social media .Nonetheless, decision makers should not solely rely on methods of text analytics and data mining in social media when doing crisis communication and follow a well-organized risk and crisis communication plan34.
It is almost impossible not to consider privacy issues when discussing targeted communication112. Collecting information about the behavior of social media users, for research or commercial purposes, is considered invasive by the public as well as inappropriate113. Recently, the use of Facebook as a research platform for massive social experiment114, was criticized for not passing the ethical board and not providing informed consent to the participants. Conversely, Facebook advertising system is using profile information and interests (extracted from activity patterns of the users), to deliver targeted messages. Hence, authorities have to deal with this issue using sound legal advice and should address the privacy issues in their communications with the public to build trust and credibility.
Recommendations
Both user profiling (i.e. behavioral targeting) and recommender systems are closely related. In both processes, user preferences are used for content recommendation. However, the application of behavioral-targeted recommendation system in the field of crisis communication is novel and deserves future studies. We propose that behavioral-targeted recommendation systems in the domain of crisis communication would be applied on two levels; public level and decision maker level. On the public level, personalized and adapted crisis messages would pop-up or appear in popular websites and social media based on two possible parameters: 1) the written content people provide on these sites (e.g. users’ public posts, reviews, and participation in talkbacks; 2) user behavior on site – such as “like”/”share’ or “re-tweet, or other forms of ratings. This approach would be effective if the user is active and engaged, but also may be relevant for passive users that mainly consume content rather than commenting on it. This proposal will be feasible in social media platforms which allow the tracking of users or has an agreement for data sharing with authoritative bodies. On the decision maker level, designated spokespersons would be assisted by the messaging recommender system to adapt their linguistic style to the user who approaches them (or vice versa) thus “tailoring” the response and assisting people in real-time to get the appropriate help, directions or support.
While certain online platforms for communication with the public in emergency were proposed111,115 they all significantly lack the user-profiling element, that might be in practice, an important factor in communication efforts116. Future web-based or mobile application-based platforms for disaster risk communication should include user-profiling module, based on different parameters extracted from users’ published text and data. We suggest social media management tools29 as suitable platform for crisis communication, as some of the tools enable the integration of extensions and apps that assist in social media data extraction, analytics and interpretation.
Conclusions
In very fast pace, social media have acquired a prominent role in media and our daily life71. During crisis and emergency, people tend to approach social media not only because of the need for quick information, but also due to the human tendency for storytelling, which allows people to experience their lives as coherent, orderly and meaningful. It is what makes people’s life more than a blooming, buzzing confusion117. Communication with public during emergency is critical for successful emergency management118 life saving, rescue and recovery. On the other hand , one should take into account that 2.08 billion people world-wide are social media users11 and significant number of people are expected to participate in the online convergence, posting massive amount of user-generated content making it an almost impossible web of information. Using state of the art computational tools makes this mission possible. Being one of the fundamental tools of emergency management118, crisis and risk communication play an important role in mitigating, or exacerbating, the psychological and behavioral reactions to critical incidents and disasters. Thus the task of continues monitoring of the social web for crisis related information can significantly improve the efforts of emergency management. This is the reason for officials to be eager to exploit social media content to gain insight from the public for the optimization of risk and crisis communication119. Risk and crisis communication’ best practices are well documented and include various tasks during different crisis stages (e.g. understanding public’s characteristics, monitoring emerging risk, feedback from affected publics etc.). These aims and practices can be improved and become efficient when utilizing linguistic computational tools that can quickly assist decision makers in designing emergency campaigns, or/and managing communication with the public during emergency. Officials should also remember that the most effective communication are those designed for a specific audience33. Research shows that interpersonal communication that is linguistically matched between the communicators is not only more successful, but also reflects our natural tendency to adjust ourselves to the listener. Finally, decision makers and crisis managers need to acknowledge the potential of the massive generated textual information published during times of emergency in the social media. This knowledge is not only beneficial for situational awareness but also for user profiling, which in our case, is not intended for marketing purposes. Behavioral analyzed information from text posted on social media can leverage targeted communication during crisis, by automatic target audience characterization and adapted, psycholinguisticly matched risk message preparation. Thus, as we keep facing major disasters and emergencies that have became more frequent during the last decade, governments can be more effective in transmission and dissemination of warning messages or/and survival information, better manage different public reactions triggered by the crisis, gain credibility from the public, and improve public cooperation during emergencies.
Competing Interests Statement
The authors have declared that no competing interests exist.
INTRODUCTION
The competence of responders to international disasters is one of the cornerstones for successful program interventions. Hence, building capacity for responders before deployment is an investment to their organizations.1,2 International relief efforts depend heavily on volunteers when responding to international disasters, and volunteers look for structured training programs as an opportunity to build their capacity and to be better prepared.3 The total percentage of volunteer responders working with non-governmental organizations (NGO) in response to international disasters and complex humanitarian emergencies is not well documented in the literature. Adequately trained responders not only provide better service, but also present a smaller risk for organizations and a higher level of operational efficiency.
When responding to international disasters, most health care professionals face austere environments with limited resources. Some volunteers are organized in advance and have been trained and directed to respond through government programs (e.g., Disaster Medical Assistance Teams [DMAT], Medical Reserve Corps [MRC]) and private sector efforts (e.g., American Red Cross, Orthopedic Trauma Association Mass Casualty Teams [OTAMCT]).4,5,6 There are also “spontaneous volunteers” who show up ready to help but lack organization, identification, credentials, and, ultimately, utility. Rather than assisting in the emergency efforts, the presence of many uncoordinated volunteers can actually impede effective emergency responses and create a liability to organizations and to themselves.2 The most vulnerable responders are novice spontaneous volunteers who lack the experience going on their own instead of through an organization. They may find themselves in situations that require heightened security awareness, cultural sensitivity, and behavioral mental health skills. The better prepared a volunteer is to fill his or her role, the smaller the chance of unintended harm. Volunteers need to know not only what they should do but also what they should not do. As part of this strategy, organizations should make available volunteer position descriptions, a code of conduct, and appropriate training courses and exercises.7
In addition, some volunteers need specialized training in caring for pediatric patients or patients who are suffering from mental health issues. Children are often the worse victims of disasters, with the under-5 mortality rate approaching 13% in a typical 5-year war.8,9 They require specialized medical care as well as intense psychological support.10
The exact number of responders to international disaster and Complex Humanitarian Emergencies (CHEs) is not well documented in the literature, nor is the percentage that have received formal structured training before actual response. Many organizations do not formally train their own personnel before deployment, let alone volunteers.11 This is perhaps the case because identification and characterization of various structured training programs and opportunities available to responders to international disasters is lacking. The objective of this manuscript was to identify and compile a list of the various structured training programs available for responders to international disasters and complex humanitarian emergencies, highlighting their diverse scopes and characteristics.
METHODS
An environmental scan was conducted through a peer-reviewed literature search of PubMed, Scopus, EMBASE, Web of Science, Cochrane databases, and an open Internet search for training program websites. The landscape literature search was conducted by combining the search terms “international,” “disaster,” “complex humanitarian emergencies,” “training,” and “humanitarian response.” All searches were conducted from January2, 2013 to September 12, 2013. Initially, 681 citations were retrieved from the above named search engines. Screening by titles narrowed the focus to 165 articles and a further screening by abstract led to 40 articles, of which a full text review revealed 14 articles that contained information regarding training programs for responders to international disasters and CHE.8,11,12,13,14,15,16,17,18,19,20,21,22

Fig. 1: Program Identification Method
RESULTS
A total of 14 peer-reviewed articles mentioned or described eight training programs, while open Internet search revealed 13 additional programs. In total, twenty-one training programs were identified as currently available for responders to international disasters and CHE.
Each of the programs identified has different goals and objectives, duration, expenses, targeted trainees and modules. Seven programs (33%) are free of charge and four programs (19%) focus on the mental aspects of disasters. The mean duration for each training program is 5 to 7 days. Fourteen of the trainings are conducted in multiple locations (66%), two in Cuba (9%) and two in Australia (9%). The cost-reported in US dollars- ranges from $100 to $2,400 with a mean cost of $480 and a median cost of $135. Most of the programs are open to the public, but some are only available by invitation, such as the International Mobilization Preparation for Action (IMPACT) and the United Nations Humanitarian Civil-Military Coordination (UN-CMCoord) Field Course. The target audience for IMPACT should satisfy three conditions: 1) have met the established criteria (technical competency in an international emergency response context in one of the “core functions”, “field experience”, and available for four-week voluntary deployment), 2) successfully completed screening interviews, and 3) completed World of Red Cross (WORC) training program.23 UN-CMCoord Field course participants should satisfy the following five conditions: 1) completed the UN-CMCoord course, 2) have a minimum of five year experience with civil-military coordination in the humanitarian assistance, 3) fluency in oral and written English; 4) fluency in other UN language and 5) currently performing a task that require interaction with the Military.24
Table 1 displays the twenty-one structured training programs (in alphabetical order), along with the organizer, location(s), cost, duration, and year established.
Name
Organizer
Type of Participants
Location
Cost (USD)
Duration
Year Established
ADPC
NI
Government officials
responsible for disaster management plan and policy; personnel involved in defense forces
and emergency servicesThailand
$2,275-3,175
2 weeks
1986
CDAC
Australia Red Cross
Red Cross staff,
volunteers; anyone interested in building international capacityAustralia
$650-920
2 days
NI
CDHRTP
University of Toronto Koffler Scientific Reserve
Anyone interested in humanitarian work
Canada
$2,080
2 weeks
NI
CHART
ICRC
Civilian and military disaster planners
Multiple
NI
5 days
1993
CHR
Cuba
Not reported
Cuba
Free
Rolling
2005
DHMP
American Red Cross, FEMA
Professionals from diverse mental health backgrounds
Multiple
$500
2 days
1990
DMTC
Rainbow Center for International Child Health
Health care professionals and physicians
Multiple
Free
5 days
1996
ELAM
Cuba
Anyone interested in disaster preparedness
Cuba
Free
6 years
1999
HELP
ICRC
Medical and public health professionals, environmental health engineers, and epidemiologists
Multiple
$1,800
2-3 weeks
1986
IDM
Indian Government
Undergraduate and post-graduate students in Symbiosis International University (SIU), India
SIU India
Free
18 months
2005
IHAT/IHPT
Australia Red Cross
Humanitarian aid workers, program officers/coordinators, caseworkers, policy officers or others working with people affected by disaster
Australia
$650-850
3 days
NI
IHE
RedR
Health workers and any professional groups who wish to work in emergency relief
Multiple
$600-2,500
5-7 days
1980
IMPACT
IFRC
By invitation only
Multiple
Free
2 weeks
NI
MIHA, IDHA, ICTC, DMTC, MHCE
CHIC
Members of
international relief organizations and humanitarian workersMultiple
$1,000-5,000
1,2,4 weeks
1992
PHCE
IRC & WE Inc.
NGO staff who are responsible for making decisions that affect the health of refugees, internally displaced persons, and those affected by CHE; District Medical Officers and other Ministry of Health staff working in regions affected by complex emergencies
Multiple
$2,400
2 weeks
NI
ROC
Medair
Mandated for prospective Medair employees but open to the public
Europe & Asia
$750
7 days
NI
TAP
ICRC
Civilian and military disaster planners
Multiple
NI
2-4 days
1980
UN-CMCoord Course and Field Course
OCHA
Governmental and non-governmental organizations, aid agencies, civil protection units, military and civil defense organizations, UN agencies and other intergovernmental bodies, the Red Cross, and Red Crescent Movement
Multiple
Free
2-7 days
1998
Various training programs
Salvation Army
Spiritual care officers,
disaster workers trained in critical incident stress debriefing, chaplains, and mental health professionalsMultiple
$135-$350
4-8 hours to 3 days
2004
Various training programs
ICISF
People working in the following fields: crisis intervention, disaster response, education, emergency services, employee assistance, healthcare, homeland security, human resources, mental health, military, spiritual care, transportation, and traumatic stress
Multiple
$100-$700
2-3 days per course
1989
WORC
IFRC
Red Cross and Red Crescent staff, volunteers, government authorities, donors, media, schools, and interested public
Multiple
Free
1 week
NI
Table 1 abbreviations:
ADPC= Asian Disaster Preparedness Center; CDAC= Capacity Development across Cultures; CDHRTP= Canadian Disaster and Humanitarian Response Training Program; CHART= Combined Humanitarian Assistance Response Training; CHR= Contingency Henry Reeve Program; CIHC =Center for International Humanitarian Cooperation DMTC= Disaster Management Training course; DMHP= Disaster Mental Health Program by the American Red Cross. ELAM Escuela Latino Americana de Ciencias Médicas (in Spanish; in English Latin American Medical School); FEMA= Federal Emergency Management Agency; HELP= Humanitarian Emergencies for Large Populations; IHAT= International Humanitarian Action Training; IHPT= International Humanitarian; Protection Training; IDM= Integrated Disaster Management Program; IMPACT= International Mobilization and Preparation for ACTion; ICISF= International Critical Incident Stress Foundation; ICRC= International Committee of the Red Cross; IDHA= International Diploma in Humanitarian Assistance; IFRC= International Federation of Red Cross and Red Crescent Societies; ICTC=In country training course; IHE= International Health Exchange programs; IRC= International Rescue Committee; MIHA=Masters in International Humanitarian Action; MHCE=Mental Health in Complex Emergencies; NI=No information; OCHA= United Nations Office for the Coordination of humanitarian Affairs; PHCE= Public Health Complex Emergencies ROC= Recovery Orientation Course, SIU= Symbiosis International University TAP= Training assistance program; UN-CMCoord= Humanitarian Civil-Military Coordination WE Inc.= World Education, Inc. WORC= World of Red Cross; Yr. Est.= year established.
Below are descriptions of the objectives, target audience, course size, and training content of the twenty structured training programs listed in the table above. Information is listed alphabetically and depends on its availability from the various sources queried.
Asian Disaster Preparedness Center (ADPC)21 : The objective is to develop participants’ skills with the aim that they should gain a solid grasp of disaster management processes and be able to address key implementation issues in disaster. Typical participants include government officials responsible for disaster management plan and policy; and personnel involved in defense forces and emergency services. There is a maximum of 30 participants per course. The main topics include disaster preparedness planning and disaster risk reduction.25
Capacity Development Across Cultures (CDAC): The objectives include developing skills for building relationships, understanding capacity, and working collaboratively with partners and colleagues to achieve capacity development outcomes. The participants are Red Cross staff, volunteers, and anyone interested in building capacity internationally. There is no course size restriction.26 The main topics are not delineated in details.
Canadian Disaster and Humanitarian Response Training Program (CDHRTP): The objectives include developing capacity for essentials during a humanitarian response, managing acute issues in complex disasters, and learning research skills. This course also places participants in a three-day simulation complex humanitarian emergency to train their capacity building and problem solving skills. The participants are anyone interested in humanitarian work. There is no course size restriction listed. Topics include gender based violence, leadership, human rights, monitoring and evaluation, and, refugee protection.27
Combined Humanitarian Assistance Response Training (CHART)11,28: The objective is to develop civilian and military response to humanitarian crises in a more efficient manner. It is designed to provide responders with the tools and knowledge to work effectively in rapidly evolving situations. Participants are civilian and military disaster planners, and the maximum number of participants admitted per course is sixty. The main subjects include the complex environment, security, logistics, nutrition, public health, international standards, responder readiness, planning, peacekeeping issues, and international humanitarian law.29
Contingency Henry Reeve Program (CHR): The objective is to develop responders who can aid in saving lives, especially in remote areas. The training program focuses on delivering primary care in disasters and epidemics. The type of participants is not documented. There are no restrictions to number of participants. The main topics includes disaster medicine courses for all types of emergencies.30
Disaster Mental Health Program (DMHP): The objective is to develop resilience among responders by ameliorating acute post disaster stress responses among Red Cross workers and the disaster victims they serve. Participants are comprised of professionals from diverse mental health backgrounds. The number of participants and course titles are not delineated.31
Disaster Management Training Course (DMTC): The specific objectives are to develop participant understanding as to why children are among the most vulnerable populations in disasters and to identify the most important problems and priorities. The program targets health care professionals and physicians as participants. There is no restriction to the number of participants. Lecture topics included epidemiological assessment, triage during disasters, and malnutrition.
Escuela Latino Americana de Ciencias Médicas (ELAM)14: The objective is for participants to develop skills necessary for disaster response. The program has a strong clinical component. Participants worldwide are welcome if they have an interest in disaster preparedness. There are no restrictions to the number of participants. The main topics include disaster medicine courses for all types of emergencies.30
Humanitarian Emergencies for Large Populations (HELP)11,12,16,32: This course is a multicultural and multidisciplinary learning experience created to enhance professionalism within humanitarian assistance programs in the setting of disasters and CHE. Participants are medical and public health professionals, environmental health engineers, and epidemiologists. Twenty-five to thirty participants are admitted per course. The main topics include public health activities, communicable diseases, epidemiology, international humanitarian law (IHL), security, humanitarian principles, and ethics.33
Integrated Disaster Management (IDM): The objectives are to ensure and develop awareness of the nature, type, and management of disasters, design disaster management plans as well as hands-on training in handling medical and non-medical emergencies. The participants are undergraduate and post-graduate students in Symbiosis International University (SIU), India. The number of participants and main topics were not outlined.15
International Humanitarian Action Training (IHAT)/ International Humanitarian Protection Training (IHPT). IHAT: The objective is to develop and equip individuals and organizations with the knowledge needed to respond effectively and implement recovery after disasters. It is open to current and aspiring aid workers, volunteers, and those interested in international emergency response. There are no restrictions to the number of participants per course.26 The main topics were not listed. IHPT: The objective is to develop understanding and competencies for protection into humanitarian action (Sphere 2011) in four key areas: child protection, gender-based violence (GBV), sexual exploitation and abuse (SEA), and other human rights abuses. Participants are humanitarian aid workers, program officers/coordinators, caseworkers, policy officers or others working with people affected by disaster. There are no restrictions to the number of participants per course. The IHAT course is a pre-requisite to this course.34 The main topics include gender-based violence (GBV) and child protection among others.
International Health Exchange programs (IHE): The objective is for aid workers around the world to develop the latest skills to ensure the quality and effectiveness of humanitarian programs. The participants are health workers and any professional groups who wish to work in emergency relief. There are no restrictions to number of participants per course. The main topics include humanitarian essentials, security, and technical training.35
International Mobilization and Preparation for ACTion (IMPACT)19: The objective is to provide additional training to participants by taking an in-depth look at the roles of the ICRC, the Federation, and National Societies in times of disaster and conflict. Another objective is to provide contextual and capacity building skills for relief and development activities. Participation is by invitation only and limited to 20 applicants. Interested parties who meet the established criteria, successfully complete screening interviews, reference checks, and WORC? may be invited to participate in the course. The course covers practical subjects such as dealing with stress, security, and cross-cultural awareness.23
Masters in International Humanitarian Action (MIHA & OTHER PROGRAMS): Center for International Humanitarian Cooperation (CHIC) offers several humanitarian training programs. The objective is for humanitarian workers and members of international relief agencies to perform more effectively in conflict and post-conflict areas. The CHIC designs training courses tailored to organizations or geographical location. Participants are members of international relief organizations and humanitarian workers. There are no restrictions to the number of participants per course. Main topics include mental health issues, disaster management, and negotiation techniques.36
Public Health Complex Emergencies (PHCE)12: The objectives are to develop and sharpen practical problem-based skills in an interactive group setting and to help participants become well-informed decision-makers and managers of public health policy in complex emergencies. Participants are non-governmental organization (NGO) staff who are responsible for making decisions that affect the health of refugees, internally displaced persons, and those affected by CHE. Other participants include District Medical Officers and other Ministry of Health staff working in regions affected by complex emergencies. There are no restrictions to the number of participants per course. The main topics include context of emergencies, reproductive health, epidemiology psychosocial health, communicable disease weapons, violence and trauma, and environmental health protection and security and nutrition coordination.37
Recovery Orientation Course (ROC): The ROC uses an intensive experiential teaching approach to develop a hands-on experience for working in the humanitarian sector. It is mandated for prospective Medair employees but open to the public. There are no restrictions to the number of participants. The main topics include an overview of Medair and understanding humanitarian aid, others and self. The cost of the course is dependent on the participant’s experience with relief work.38
Training Assistance Program (TAP)19: This training program is similar to the CHART program. The difference is that the host organization helps with the designing of the curriculum and develops a draft agenda based on the training objectives and target audience.32 The main topics are similar to CHART, and the class size is not outlined.
United Nations Humanitarian Civil-Military Coordination (UN-CMCoord) Course and Field Course32: The objective of these courses is to equip humanitarian and military personnel with the skills and knowledge necessary to communicate and effectively interact with each other. Participants include governmental and non-governmental organizations, aid agencies, civil protection units, military and civil defense organizations, UN agencies and other intergovernmental bodies, the Red Cross, and Red Crescent Movement. The maximum numbers of participants for the course and field course are twenty and twenty-eight, respectively. The main topics include the roles of military and humanitarian actors in emergencies and complex emergencies. Participation in the field course is by invitation only. The prerequisites are the UN-CMCoord course and a minimum of five years of experience in civil-military coordination.24
Various programs by The Salvation Army: The goal of The Salvation Army’s disaster training program is for individuals to develop the skills needed to serve during times of crises particularly in the field of mental health. Participants include spiritual care officers, disaster workers trained in critical incident stress debriefing, chaplains, and mental health professionals. There are no restrictions to the number of participants per course. The main topics include foundations of emotional and spiritual care, disaster food services, disaster social services, and incident command systems.39
Various programs organized by International Critical Incident Stress Foundation (ICISF): These programs currently offer over 40 different courses selections at conferences and trainings held around the United States. The objective is to develop the skills for handling critical incident stress and mental health issues. Participants include people working in the following fields: crisis intervention, disaster response, education, emergency services, employee assistance, healthcare, homeland security, human resources, mental health, military, spiritual care, transportation, and traumatic stress.The main topics are group crisis intervention, compassion fatigue, emotional, spiritual and psychological first aid.40
World of Red Cross (WORC): This online general orientation program introduces the main elements of the Red Cross Red Crescent Movement. The objective is to educate participants on the history and principles of the Red Cross Red Crescent Movement, in order to improve understanding and commitment to the mandate and culture. The course is open to all Red Cross Red Crescent staff, volunteers, government authorities, donors, the media, schools, and the interested public. There are no restrictions to the number of participants per course. The main topics include the origin and history of the Red Cross. This course is one of the three prerequisite for the IMPACT program.23
DISCUSSION
A successful and efficient response to international disasters and complex humanitarian emergencies depends on the capacity, skills, and prior training those responders have already acquired. As the number of complex humanitarian emergencies and disasters increase, one of the challenges facing responding organizations is to maintain well-trained volunteers and employees. There is an increasing demand for skilled health providers, public health professionals, and field program administrators; this requires a cadre of trainees with both general and specific capacities.11
The SPHERE standards were created in 1997 to define a set of universal minimum standards in core areas of humanitarian assistance.41 This project was a collaborative effort by many agencies to produce standards that relate to disaster assistance in: 1) water supply and sanitation; 2) nutrition and food aid; 3) shelter and site planning; and 4) health services.42 Despite the definition of the SPHERE guidelines, many organizations do not train their personnel in the applications of these guidelines.11
Due to the various objectives of the programs along with the various expectations and interests of the trainees, there is no single training program that is universally accepted as the ideal. The main language used for these trainings is English, but the HELP courses are taught in multiple languages. Regionalized trainings conducted in other languages such as French, Arabic, or Spanish may reduce the burden to find interpreters or obtain visas. This would reduce costs and improve logistics for participants.
The list provided in this paper offers a general description of the various training programs offered worldwide. This will help potential responders –volunteers or non-volunteers- to identify training opportunities that will build their capacities in the specific areas they are responsible for. This will allow them to consider the financial, linguistic, and logistical characteristics. With evolving technology, the responders of the future may not be limited to attending in-person training programs, but have access to virtual environment experiences. However, this modality of training is still infantile for training programs geared towards international disasters and CHE and requires a large amount of financial and technical resources. For the foreseeable future, in-person training programs remain indispensable, and they continue to grow in number, scope, breadth, location and targeted audience
The vast majority of these programs target volunteers and are known worldwide for being offered by large, reputable, and established international organizations; however many more specialized trainings exist as well. NGOs typically do staff training targeted for specific roles in the field, however these training courses are seldom published in peer-reviewed journals and may not even appear on the websites of the NGOs who offer them. A centralized database of all training programs would be beneficial.
Limitations
There is a paucity of peer-reviewed literature with substantial information on structured training programs for responders to international disasters and CHE. Twelve articles on specific training programs were published in peer-reviewed journals. However, it is important to note that the literature search was not conducted in a systematic fashion due to resource constraints. There is no single web-based resource that is comprehensive, robust, and well known enough that potential responders can consider. In addition to the programs reported and analyzed in this report, there are many other smaller programs with different foci.
Additionally, there is no published literature on the recommended consensus-based recommendations for competencies or curricula. Future work could include surveying participants on their experiences in each program.
CONCLUSIONS
Training programs available for responders to international disasters and CHE vary in their objectives, target audiences, modules, geographical locations, and financial cost. Currently, there is no resource that centralizes the descriptions of humanitarian response training programs. This paper presents an overview of available programs and serves as a resource for potential responders and organizations interested in capacity-building training prior to an international disaster response or complex humanitarian emergency.
Introduction
A tsunami, the Japanese word for “large harbor wave,” is a series of large water waves produced by a sudden vertical displacement of water. Aquatic earthquakes are the most common cause, but volcanic activity, landslides and impacts of meteorites may also generate tsunamis. Earthquake-generated tsunamis develop when tectonic plates, either deep sea, continental shelf, or coastal, move abruptly in a vertical direction, and the overlying water is displaced. Waves created by these disturbances move in an outward direction, away from the source. In deep waters, the surface disturbance of water is relatively unnoticeable and may only be felt as a gentle wave. As the wave approaches shallow waters along the coast, it rises above the surface related to the amplitude of the underwater waves. The speed of the tsunami diminishes and the height of the wave increases as it reaches the shore line. The extent of inundation that occurs is largely dependent on local topography; in low lying areas flooding can be extensive and can reach far inland disrupting even non-coastal communities 1,2,3 .
While rare, high-impact tsunamis have the potential to cause widespread destruction and affect hundreds of thousands 4,5 . The 2004 Indian Ocean tsunami resulted in more than 225,000 deaths across twelve nations, and the 2011 Japan tsunami caused an estimated 28,000 deaths 6. Displacement and damage to infrastructure are also important contributors to the human, social, and economic effects of tsunamis 7. Few reviews of the impacts of tsunamis on human populations exist. Given the recent tsunami disasters in 2004 and 2009, a broader understanding of the characteristic effects of tsunamis on human populations could inform preparedness and response efforts. The objectives of this review were to describe the impact of tsunamis on the human population, in terms of mortality, injury, and displacement and to identify risk factors associated with these outcomes. This is one of five reviews on the human impact of natural disasters, the others being volcanoes, floods, cyclones, and earthquakes.
Methods
Data on the impact of tsunamis were compiled using two methods, a historical review of tsunami events and a systematic literature review for publications relating to the human impacts of tsunamis with a focus on mortality, injury, and displacement.
Historical Event Review
Data for the historical event review were obtained from two sources. The National Oceanic and Atmospheric Administration’s National Geophysical Data Center (NOAA-NGDC) tsunami database 8 consists of two sets of related files on tsunami events and a tsunami run-ups. The event file lists the cause (almost exclusively undersea earthquakes) that triggered tsunamis together with the total impact of a single event (i.e. the aggregate impact from multiple wave run-up locations together with the coordinates of the originating event). The run-up file includes wave characteristics and impacts in each affected location (multiple run-up reports per event). Records from the tsunami run-up file that met all of the following criteria were retained: 1) occurred between 1900 and 2009; 2) reported as definitely or probably occurring; 3) had a wave height ≥2.0m; and 4) resulted in ≥1 deaths. This yielded a total of 116 run-up reports from 82 different tsunami events.
The Centre for Research on the Epidemiology of Disasters’ Emergency Events (CRED EM-DAT) was the second data source used in the review. All wave/surge events that were reported between 1900 and 2009 in EM-DAT were included (n=58); data were initially exported in 2008 when CRED reported wave/surge events; this category was subsequently discontinued. For tsunami impacts reported by EM-DAT, zeroes were treated as missing values because they were used as placeholders and their inclusion in the analysis could contribute to the under estimation of tsunami impacts. The NOAA-NGDC run-up database was subsequently searched for events reported by EM-DAT that were previously excluded due to wave height <2.0m or uncertain reporting criteria, and NOAA-NGDC event data were added to the EM-DAT records. This process yielded a total of 151 records, including 58 events reported by EM-DAT and 134 run-ups reported by NOAA-NGDC. The run-up file was used to assess wave characteristics and outcomes. A separate event file comprised of 81 events was created by combining multiple reports of tsunami impact within a country into a single event. To create a summary record for each of event with multiple reports, human impacts at each location were summed, and the maximum wave height and inundation depth were applied. The event file had 94 events, including 58 reported by EM-DAT and 71 by NOAA, and was used to assess frequency and distribution of tsunamis and their impact by country. Findings presented in this review are based on the 151 run up file. Both run-up and source data can be accessed online at https://www.jhsph.edu/refugee/natural_disasters/_Event_Tsunamis.html.
In order to examine country- and event-specific characteristics associated with low and high levels of tsunami mortality, deaths were categorized as follows: low (<10 deaths), medium (11-75 deaths) and high (>75 deaths). Bivariate tests for associations between tsunami mortality and the following characteristics were performed using χ2 (categorical measures) and ANOVA (continuous measures): time period (dichotomized, 1900-1955 and 1956-2009), region as defined by the World Health Organization (WHO), income level (World Bank), gross domestic product (GDP), GINI (measure of income inequality), distance from source (quartiles), wave height (dichotomized, <6.65 and >6.65) and earthquake magnitude. For the region variable, only three events were reported in Africa and because all were related to the 2004 Indian Ocean tsunami, they were grouped with Southeast Asian; only one event was recorded in the Eastern Mediterranean region which was grouped Europe .All analyses were performed using Stata Statistical Software, Version 11.0 9
Systematic Literature Review
Key word searches in MEDLINE (Ovid Technologies, humans), EMBASE (Elsevier, B.V., humans), SCOPUS (Elsevier B.V., humans), and Web of Knowledge, Web of Science (Thomson Reuters) were performed to identify articles published in July 2007 or earlier that described natural hazards and their impact on human populations. Key words used to search for natural hazards included natural hazard(s), natural disaster(s), volcano(es), volcanic, volcanic eruption, seismic event, earthquake(s), cyclone(s), typhoon(s), hurricane(s), tropical storm(s), flood(s), flooding, mudslide(s), tsunami(s), and tidal wave(s). Key words included for impact on human populations were affected, damage(d), injury, injuries, injured, displaced, displacement, refugees, homeless, wounded, wound(s), death(s), mortality, casualty, casualties, killed, died, fatality, fatalities and had to be used in either the title, abstract or as a subject heading/key word. The search resulted in 2,747 articles from MEDLINE, 3,763 articles from EMBASE, 5,219 articles from SCOPUS, and 2,285 articles from ISI Web of Knowledge. Results from the four databases were combined and duplicates were excluded to yield a total of 9,958 articles. . One search was done for all the five natural hazards described in this set of papers. This paper describes the results for tsunamis. The systematic review is reported according to the PRISMA guidelines.
Title screening was performed to identify articles that were unrelated to natural disasters or human populations. Each title was screened by two independent reviewers and was retained if either or both reviewers established that inclusion criteria were met. To ensure consistent interpretation of inclusion criteria, percent agreement was assessed across reviewers for a small sample of articles, and title screening began after 80% agreement on inclusion was achieved. A total of 4,873 articles were retained for abstract review. Articles that met one or more of the following criteria were excluded in the abstract screening: language other than English; editorial or opinion letter without research-based findings; related to environmental vulnerability or hazard impact but not human populations; individual case report/study; focus on impact/perceptions of responders; and not related to human or environmental vulnerabilities or impacts of hazards. As with the title screening, overall percent agreement between reviewers was assessed, and abstract screening began after achieving 80% agreement. Each abstract was screened by two independent reviewers and was retained if either or both reviewers established that inclusion criteria were met. During the abstract review, included abstracts were coded for event type, timeframe, region, subject of focus, and vulnerable population focus.
A total of 126 articles were retained for full article review. Articles discussing the impacts of natural disasters on human populations in terms of mortality, injury, and displacement were prioritized for review. A total of 64 articles on tsunamis meeting the aforementioned subject focus criteria were retained for full review. Upon full review, 27 articles were retained including 23 that underwent dual review and standardized data abstraction, two identified as review articles 10,11, one policy article 12 and one article on mitigation 13 (Figure 1). Following the systematic review, a hand search was conducted using the databases and key words listed above to identify relevant articles published between July 2007 when the initial search was conducted and October 2012; seven additional articles were identified that met criteria for full review. In total, 34 articles relating to risk factors for mortality, injury or displacement were identified; summaries of articles with primary data (n=30) are presented in Table 1.

Fig. 1: Overview of the systematic literature review process for tsunamis
* Displacement is excluded from the table because no primary data on displacement was collected in only three studies: MMWR, 2006; Rofi, 2006; and Yamada, 2006; ** Additional articles from the hand search through October 2012
Article
Event
Summary
Mortality (n=14)
Injury & Morbidity (n=19)
Tsuji et al., 199515
June 3, 1994, East Java, Indonesia
Field survey to assess the destruction of the tsunami
223 deaths reported
Neither reported
Tsuji et al., 199516
December 12, 1992, Flores Island
Field survey to assess the destruction of the tsunami
1690 deaths reported
Neither reported
Davies et al., 200317
July 17, 1998, Aitape, Papua New Guinea , 1998
Interviews and field investigations to describe the physical characteristics of tsunamis.
1600 deaths reported; primary causes of death were drowning and impacts with hard objects
Neither reported
Brennan and Rimba., 200518
December 26, 2004, Indonesia
Rapid health assessment to determine the public health impact of the tsunami in three communities of the Aceh Jaya district
70% of the population died
Injury data not reported85% of children <5 yrs old experienced an illness
Calder & Mannion, 200519
December 26, 2004, Sri Lanka
Review of findings from a DFID needs assessment with an emphasis on trauma/ orthopedic and psychiatric services
Not reported
100 injuries reportedNo morbidity data reported
Johnson & Travis, 200520
December 26, 2004, Thailand
Facility-based, retrospective record review to describe tsunami-related injuries at the provincial hospital in Krabi province.
25 deaths reported
1357 injuries reportedNo morbidity data reported
Lee et al., 200521
December 26, 2004, Indonesia
Description of primary health care services delivered in an internally displaced persons camp by a medical team from Singapore
Not reported
1958 people injuredNo morbidity data reported
Lim et al., 200522
December 26, 2004, Sri Lanka
A description of the patients treated by two Korean medical teams over a nine day period following the tsunami
Not reported
4710 injuries reported; primary causes were running from the tsunami and surviving in wreckageNo morbidity data reported
Maegele et al., 200523
December 26, 2004, Thailand
Observational study of patients seen at an adult intensive care unit a university hospital
Not reported
17 injuries reported; the primary cause of injury was due to hitting floating debrisNo morbidity data reported
Chambers et al., 200624
December 26, 2004, Indonesia
Description of surgical and humanitarian assistance operations of a joint Australian and New Zealand operation in the four week period following the tsunami
Not reported
71 injuries reportedNo morbidity data reported
Fan, 200625
December 26, 2004, Indonesia
Description of patients treated in Banda Aceh by a medical team from Singapore in the first few weeks following the Tsunami
Not reported
2183 injuries reported; primary causes was being caught in the wave and struck by debris. No morbidity data reported
Kwak et al., 200626
December 26, 2004, Sri Lanka
Descriptive study of patients treated by Korean surgical and medical personnel from January 2 to 8, 2005
Not reported
2807 individuals treated for medical problems (82%) and injuries (18%)
MMWR, 200627
December 26, 2004, Indonesia
Three household surveys to assess affected populations and evaluate effectiveness of relief interventions 7 months post-disaster
Not reported
Neither reported
Nishikiori et al., 200628
December 26, 2004, Sri Lanka
Household survey to assess mortality among the internally displaced population
446 deaths reported
Neither reported
Nishikiori et al., 200629
December 26, 2004, Sri Lanka
Household survey to assess mortality among the internally displaced population
446 deaths reported; primary cause of death was drowning
Neither reported
Redwood –Campbell & Riddez, 200630
December 26, 2004, Indonesia
Descriptive study of outpatients at an International Committee of the Red Cross hospital nine weeks following the tsunami
Not reported
271 injuries reported
Rodriguez et al., 200631
December 26, 2004, India and Sri Lanka
Observations and key-informant interviews to describe the societal impacts of the disaster
250000 deaths reported; primary cause for death was drowning
Neither reported
Rofi, et al., 200632
December 26, 2004, Indonesia
Household survey to estimate mortality and displacement
295 deaths reported
Neither reported
Roy, 200633
December 26, 2004, India
Descriptive study of deaths and individuals treated at a secondary care hospital in the days following the tsunami
62 deaths reported; primary cause of death was drowning
Minor injuries reported 17% of patients showed symptoms of PTSD
van Griensven et al., 200634
December 26, 2004, Thailand
Multi-stage, cluster survey to assess the mental health of displaced and non-displaced populations following the tsunami
Not reported
Injury data not reported1061 mental health issues reported; primary cause due to tsunami
Yamada et al., 200635
December 26, 2004, Sri Lanka
Needs assessment conducted to understand tsunami impact on specific population groups and on the health care system
Not reported
Injury data not reportedGeneral mental health consequences of the disaster reported
Doocy et al., 200736
December 26, 2004, Indonesia
Estimation of tsunami mortality using GIS-based vulnerability modeling
131066 deaths estimated
Neither reported
Doocy et al., 200737
December 26, 2004, Indonesia
Four two-stage cluster household surveys to assess mortality and associated risk factors
1642 deaths reported
Neither reported
Johnson & Travis, 200638**
December 26, 2004, Thailand
A description of individuals treated at a provincial tertiary hospital in the weeklong period following the event
Not reported
1357 injuries reported
Johnson & Travis, 200639**
December 26, 2004, Thailand
Application of the tri-modal death model to mortality and injury post-tsunami
Not reported
Not reported
Meynard et al., 200840**
December 26, 2004, Indonesia
Cluster survey s to assess health of children affected by the disaster
Not reported
Injury data not reported7-13% malnourished and 68% experienced sickness
Prasartritha et al., 200841**
December 26, 2004, Thailand
Retrospective record review of injury care seekers at three hospitals
Not reported
2311 injuries reportedMorbidity data not reported
Doocy et al., 200942**
December 26, 2004, Indonesia
Three two-stage cluster household surveys to assess injury and associated risk factors
17.7% (CI:16.8-18.6) of the population died
707 injured individualsMorbidity data not reported
Doung-ngern et al., 200943**
December 26, 2004, Indonesia
Assessment of wound treatment among care seekers at four public hospitals
Not reported
513 injuries (wounds) reportedMorbidity data not reported
Nagamatsu et al, 201244**
March 11, 2011 Japan
Review of DMAT response
282 deaths from deteriorating pre-existing chronic medical conditions
4891 injured patients at the Ishinomaki Red Cross Hospital
Results
Historical Event Review
Between 1900 and 2009, 94 tsunamis that affected human populations were recorded. The frequency of events was relatively constant through the 1980s, after which a dramatic increase was reported (Figure 2). This increase is likely the result of improvements to monitoring and reporting systems. Tsunami frequency and mortality were concentrated in the Western Pacific, Southeast Asia, and Americas regions, each of which accounted for almost one third of tsunami events and deaths, but Southeast Asia accounted for 52% of the tsunami-affected population from 1900 – 2009 and 95% of the tsunami affected population from 1980 – 2009 (Figure 4). An estimated 2.5 million people were affected by tsunamis between 1900 and 2009. A sharp increase in tsunami mortality and affected populations was observed from 2000 to 2009 as a result of the 2004 Indian Ocean tsunami (Figure 3). The overall impact of tsunamis on human populations is summarized in Table 2.
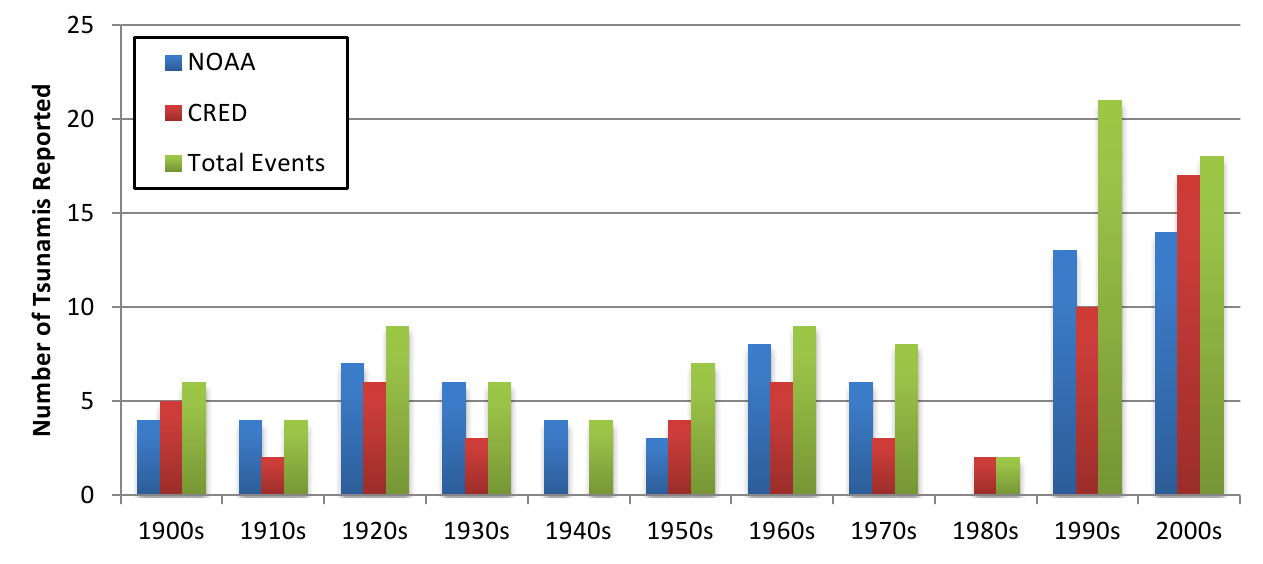
Fig. 2: Reporting of tsunamis by source and decade

Fig. 3: Tsunami events affecting human populations by decade
*Regions as defined by the World Health Organization
Fig. 4: Tsunamis and their impact on human populations by region, 1980-2009*
Notes: figures based on the highest reported number of deaths or injuries in an event in one country. Homeless and total affected populations are reported only by EM-DAT, thus ranges are not presented for overall impact estimates.
Cumulative Impact of Tsunamis, 1900-2009 [1970-2009]
Human Consequence
# of Events
Best Estimate
Range
1900-2009 (n=94)
1980-2009 (n=16)
1900-2009 (n=94)
1980-2009 (n=16)
1900-2009 (n=94)
1980-2009(n=16)
Deaths
87
16
255,195
230,012
252,619-275,784
228,932 – 231,091
Injuries
22
9
48,462
14,029
45,466-51,457
11,033 – 17,024
Homeless
12
7
1,081,764
1,034,214
—
—
Total Affected
25
4
2,532,189
2,479,689
—
—
Event Summary Statistics
Human Consequence
# of Events
Median
Mean
Range
1900-2009 (n=94)
1980-2009 (n=16)
1900 – 2009 (n=94)
1980-2009 (n=16)
1900-2009 (n=94)
1980-2009 (n=16)
1900-2009 (n=94)
1980-2009 (n=16)
Events with deaths
87 [92.5%]
16 [100%]
50
2,963
14,839
1-165,708
1-165,708
Reported by EM-DAT
53 [56.4%]
16 [100%]
64
91
4,559
14,339
1-165,708
1-165,708
Reported by NOAA
69 [73.4%]
15 [93.75%]
61
108
3,623
15,375
1-165,659
1-165,659
Events with Injuries
22 [23.4%]
9 [56.25%]
218
2,878
2,339
5,255
2-23,176
2-23,176
EM-DAT
13 [13.8%]
9 [56.25%]
543
2,214
3,320
5,113
2-23,176
2-23,176
NOAA
10 [10.5%]
10 [6.25%]
127
6,534
885
6,534
7-6,534
—
Homeless, all events
12 [12.8%]
12 [43.75%]
4773
4,296
90,147
147,745
70-532,898
70-532,898
Total Affected, all events
25 [26.6%]
25 [87.5%]
5063
21,457
101,288
177,745
2-1,109,306
194-1,109,306
Tsunami Characteristics. The physical characteristics of tsunamis were reported by NOAA-NGDC and included distance of the tsunami run-up from source, wave height, and earthquake magnitude. The median distance from source was 119 km (mean 810 km; range 7-10,621 km), and the median wave height was 6.7m (mean 13.0m; range 1.8 -67.1m). The majority of the tsunamis reported were due to earthquakes (95.5%), with small minorities resulting from landslides (3.0%), volcanoes (0.8%), and meteorological events (0.8%). Median magnitude for earthquake generated tsunamis was 8.1 (mean 8.1; range 6.3-9.5).
Mortality. Deaths were reported in 92.6% (n=94) of tsunamis occurring between 1900 and 2009. There were an estimated 255,195 deaths (range 252,619-275,784) resulting from tsunamis recorded in the historic event review, with the 2004 Indian Ocean tsunami accounting for an estimated 227,497 deaths (89%) of all mortality. Deaths were concentrated in Indonesia (62% or 170,689 deaths), Sri Lanka (13% or 35,399 deaths), Thailand (3.2%, 8,876 deaths) and the Philippines (3% or 8,137 deaths). Apart from rare high-impact events such as the 2004 Indian Ocean tsunami, mortality levels in tsunamis tend to be relatively low with a median of 50 deaths per event (mean=2,963,range 0-165,708) when using the highest reported death toll.
Table 3 presents results of the bivariate analyses between tsunami characteristics and mortality. Time period, and GINI coefficient were not statistically associated with tsunami mortality. There were considerable differences in mortality levels by WHO region, with the majority of tsunami events that occurred in the Americas resulting in low (<10) deaths and 50% of events in the South East Asian region resulting in high (>75) deaths (p<.001). Both World Bank-defined income level and per capita GDP were significantly associated with tsunami mortality. Whereas the majority of events in high income countries resulted in ten or fewer deaths, a considerably greater number of events in low and lower-middle income countries resulted in greater than ten deaths (p=.009). Similarly, events that resulted in greater than 75 deaths occurred in countries or territories with per capita GDPs that were more than two times lower than countries that experienced fewer tsunami deaths (p<.001). While the data show an inverse associations between tsunami mortality and distance from source (p=.001) and a positive association between mortality and wave height (p=.016), it is important to note that information pertaining to both measures were missing in a considerable proportion of events, particularly those occurring earlier in the study period.
Characteristic
<=10 deaths
(n = 57)11-75 deaths
(n = 51)>75 deaths
(n = 44)P-value
Time period, n (%)
1900-1955
26 (41)
22 (35)
15 (24)
.485
1956-2009
31 (35)
29 (33)
29 (33)
WHO Region, n (%)
Americas
36 (63)
12 (21)
9 (16)
<.001
Western Pacific
8 (21)
19 (50)
11 (29)
Southeast Asia & Africa
8 (20)
12 (30)
20 (50)
Europe & Eastern Mediterranean
5 (29)
8 (47)
4 (24)
World Bank Development Level, n (%)
Low income
6 (38)
6 (38)
4 (25)
.009
Lower-middle income
10 (20)
17 (35)
22 (45)
Upper-middle income
4 (25)
6 (38)
6 (38)
High Income
37 (52)
22 (31)
12 (17)
Distance from Source (km), n (%)
< 67
7 (25)
14 (50)
7 (25)
.001
68 – 119
11 (41)
8 (30)
8 (30)
120 – 468
12 (44)
7 (26)
8 (30)
Greater than 468 km
19 (70)
6 (21)
2 (7)
Distance missing
8 (19)
16 (37)
19 (44)
Wave Height (m), n (%)
< 6.65
31 (53)
18 (31)
10 (17)
.016
> 6.65
19 (32)
20 (34)
20 (34)
Missing wave height
7 (21)
13 (38)
14 (41)
Per capita GDP (USD), mean (SD)
29368 (2605)
20561 (3104)
12584 (2364)
<.001
Earthquake Magnitude, mean (SD)
8.12 (0.11)
8.06 (0.14)
8.18 (0.12)
.784
GINI Coefficient, mean (SD)
40.28 (0.77)
37.72 (1.12)
38.82 (1.27)
.209
Injury. Injury reports were only available in 22 (23.4%) events for a total of 48,462 injuries (range 45,466-51,457). A typical tsunami caused 218 injuries (median value) but the distribution was skewed by rare large-scale events (mean injured=2,339, range=0-23,176). To more accurately estimate the total number of injuries due to tsunamis, it was presumed that injuries would occur in events where deaths were reported. There were 87 tsunami events with fatalities; when the median and mean for injuries were applied to the remaining 65 events with fatalities, it was estimated that between 14,170 and 152,035 unreported tsunami-related injuries occurred worldwide between 1900 and 2009.
Systematic Literature Review
Mortality. Of the 33 articles reviewed, 12 reported on mortality, including mortality counts or rates and/or risk factors for death (Table 4). Age and sex were described as risk factors for death in three articles, all from the 2004 Indian Ocean tsunami 28,32,37. In both Indonesia and Sri Lanka, significantly higher death rates were reported among females who were 1.4 to 2.1 times more likely to perish than males. Significantly elevated risk of death was also observed in children (1.8 to 4.3 times) and older adults (2.1 to 3.1 times) who were more likely to die compared with younger/middle age adults. Other risk factors included education which was inversely associated with mortality risk 28; fisheries-based livelihoods 28,32indoor location at the time of the tsunami and home destruction 28 and the physical environment 15. The majority of tsunami deaths were due to drowning 11,14.
Article
Country
Mortality
Sex as a risk factor
Age as a risk
N
Rate
Tsuji et al., 199515
Indonesia
223
6.9% (Lampon); 3.9% (Rajekwesi & Pancer)
Not reported
Not reported
Tsuji et al., 199516
Flores Island
1,690
Not reported
Not reported
Not reported
Davies et al, 200317
Papua New Guinea
1,600
Not reported
Not reported
Not reported
Brennan, 200518
Indonesia
~5,460-6,090
70% (Calang)
Not reported
Not reported
Johnson et al, 200520
Thailand
25
Not reported
Not reported
Not reported
Nishikiori et al., 200628
Sri Lanka
457
12.6%
Higher mortality was observed among females at 17.5% vs. 8.2% for males.
Elevated mortality among children (<5yrs: 31.8% and 5-9 yrs: 23.7%) and the elderly (15.3%) as compared to 7.4% for adults 20-29 yrs.
Nishikiori et al., 200629
Sri Lanka
446
0.25 deaths / 10,000 population
Not reported
Not reported
Rodriguez et al., 200631
India and Sri Lanka
250,000
Not reported
Not reported
Not reported
Rofi, et al., 200632
Indonesia
295
13.9% (CI:12.4-15.4)
Risk of mortality was 1.9 (CI:1.5-3.0) times greater in females than males.
Elevated risk of death for children <10yrs (2.3, CI: 1.6-3.4) and adults >60yrs (3.1, CI: 1.9-4.9) as compared to 20-39 yr olds.
Roy, 200633
India
62
0.85 deaths / 10,000 population
Not reported
Not reported
Doocy et al, 200736
Indonesia
131,066
Modeled rates of 23.7% (exposed population)
Not reported
Not reported
Doocy et al, 200737
Indonesia
1,642
16.3% (crude) and 14.1% (adjusted)
Higher mortality rate in females (16.4%) than males (12.0%). Risk for death was 1.4 (CI: 1.3-1.6) times greater in females.
Elevated mortality among children (<0-yrs: 19.8%) and older adults (60-69yrs: 22.6%, 70+yrs: 28.1%) (15.3%) as compared to 10.8% among 20-39yr olds.
Injury. Tsunami-related injuries were reported in 18 articles though only ten provided detailed information on injury types or risk factors (Table 5). Only one study estimated a population-based injury rate of 8.5% in Indonesia following the 2004 tsunami 42. Other articles described the proportion of care seekers with tsunami-related injuries or included only patients with tsunami-related injuries, preventing comparisons in injury patterns across events and locations. Only two studies described risk factors for tsunami-related injury, both with similar findings, in the 2004 Asian tsunami. The first, a study of patients seen by a medical team in Sri Lanka, observed that males and adults (15-64 years) seeking care for injuries were over-represented, suggesting these population sub-groups had higher injury rates 26. The second used household survey data from Indonesia and reported lower injury risk among females (OR=0.81) and the highest injury rates among those 20-49 years of age. The risk factors for injury were opposite those of mortality suggesting that those more likely to survive the tsunami were also more likely to be injured 42. The most common types of injuries were wounds due to physical impact with debris, fractures, and near drowning and/or aspiration 21,22,23,25,26,30,42 . As compared to other types of natural disasters, tsunamis often result in relatively high mortality but have lower rates of injury 11.
Article
Country Affected
Injuries Reported
Injury Type
Notes
# injured / cases
Injury Rate
Respiratory Injury or Near Drowning
Musculo-skeletal or Orthopedic Injury
Traumatic Injury / Wound
Dermatologic Injury
Gastro-intestinal Injury
Other
Calder et al, 200519
Sri Lanka
100
Not reported
Open fractures repair, wound debridement and skeletal traction were the most common procedures
Lee et al, 200521
Indonesia
1958
Not reported
27%
72%
Lim et al, 200522
Sri Lanka
4710
Not reported
28%
29%
34% of cases were non- tsunami related chronic conditions
Maegele et al, 200523
Thailand
17
Not reported
Closed fracture 35%; open fracture 24%
Soft tissue hip/ lower extremity 88%; soft tissue upper extremity 29%
Head injuries 18%, hemopnueu-mothorax 18%, thoracic trauma 14%
Johnson et al, 200540
Thailand
1357
Not reported
n=31 (2%)
n=33 (2%)
n=65 (5%)
Head, n=18 (1%); abdominal n=12 (1%), chest/ thoracic (n=3, 0%)
Retrospective study of facility data. Reports on injuries and evolution of pathology.
Chambers et al, 200624
Indonesia
71
Not reported
9% fracture management
34% wound debridement
24% changing dressing under anesthetic
Reports on surgical procedures only; 69% were for tsunami-related injuries.
Fan, 200625
Indonesia
1021
Not reported
32%
11% musculo-skeletal
25%
10%
10%
2% neurologic injuries
Kwak, 200626
Sri Lanka
2807
Not reported
33%
22% orthopedic
8%
13%
4%
4% headache
Adults and males had higher injury rates
Redwood –Campbell et al, 200630
Indonesia
271
12% of cases were tsunami related
Most tsunami related injuries were fractures, wounds, and aspiration pneumonia.
Doocy et al, 200942
Indonesia
707
8.5% (CI: 7.9-9.2)
4%
8% fractures
75%
13% other (unspecified)
Lower injury risk among females (OR=0.81, CI 0.61-0.96); highest injury rate among 20-49yr age group
Discussion
Main Findings
From 1900 to 2009, approximately 2.5 million people were affected by tsunamis including over 255,000 deaths and an estimated 50,000 injuries. The mortality and population affected estimates presented in this study are consistent with other reviews of global tsunami events 11 It is likely that the number injured is underestimated, given the low frequency with which this figure was reported, particularly in the first half of the 20th century. When the mean and median numbers injured were applied to events that resulted in deaths it was estimated that between 10,900 and 116,950 unreported tsunami-related injuries occurred worldwide during this time period. It is important to note, that studies have shown that that ratio of deaths to injuries following a tsunami is typically significantly higher compared with other natural disaster types 11.
This study is the first to examine the influence of place and event characteristics on tsunami mortality. Analyses of tsunami run-up data from 1900 to 2009 reveal that events occurring in the South East Asian region were significantly more likely to result in greater numbers of deaths compared to other regions, and this finding persisted even after excluding the 2004 Indian Ocean tsunami. Examination of the relationship between mortality levels and the two poverty measures (World Bank income level and per capita GDP) demonstrate that risk of mortality event is significantly higher in low-income countries. Lastly, certain event characteristics are more likely to be predictive of mortality than others. Increased wave height and closer proximity to the source were associated with higher mortality levels whereas earthquake magnitude was not associated mortality. A number of other factors that were not examined in this study have been shown to influence tsunami damage and impacts including wave velocity, water depth and submarine topography 10. Ecological assessments such as this review may mask significant in-country differences in mortality risk (e.g. population density, rural or urban location, geographic variations and individual-level socio-demographic factors).
Findings from the systematic literature review of studies examining tsunami-related mortality and injury contribute to understanding the primary causes of death and types of injury, as well as factors that place certain populations at increased risk. The most common cause of tsunami-related death was drowning, and the most frequently reported injuries included wounds and lacerations, fractures, and near drowning and/or aspiration. When reported the mortality risk was higher among females and the very young and old and injuries were more common among middle-aged men. Additional mortality risk factors included location during the event and fisheries-based livelihood. Few studies assessed or found relationships between socioeconomic status and mortality risk, although that one study found an inverse association between education level and mortality 28 which suggests that low socioeconomic status may place individuals at increase mortality risk. This suggests that preparedness efforts target specific population groups for the prevention of deaths and injuries. Future studies on both tsunami-related injury and mortality risk would benefit from incorporating additional socio-demographic measures to gain a more comprehensive understanding of risk factors.
A number of strategies could be adopted by the international community and vulnerable countries to mitigate the short and long term impacts of future tsunami events. In the 1998 Papua New Guinea tsunami factors that contributed to higher mortality during this event included concentration of populations in vulnerable areas and failure of residents in affected areas to timely evacuate. In contrast, deployment of medical assistance and international support immediately following the tsunami played a large role in preventing further loss of life 13.With respect to public health in particular, a greater focus on ongoing disease surveillance, the appropriate targeting of aid to those in most need, and strengthening of health care systems 11 can help to mitigate the medium to long term health impacts of tsunamis. Advanced tsunami warning systems may vastly improve early detection, and education campaigns can play a crucial role in improving awareness about tsunami risk and mitigation 10. Policies enacted by the Sri Lankan government following the 2004 tsunami highlight some of the challenges to longer term disaster mitigation where enactment of a buffer zone policy that forced the relocation of coastal communities had deleterious social and economic impacts 12. In adopting disaster mitigation policy, governments should consider the contribution not only of physical vulnerability (i.e. distance of communities from coastal areas) but also social vulnerability, such as livelihoods, to increased disaster risk and the potential short and long term impacts such policies may have on affected communities.
Limitations
Systematic reviews face numerous limitations. The effects of tsunamis are the subject of gross approximations and aggregations which result in a great deal of imprecision. The availability and quality of data has likely increased and improved over time, however, in many events deaths are unknown or unrecorded. For a significant number of events no data are reported for injured, displaced, and affected populations; this likely contributes to a substantial underestimation of the impacts of tsunamis on human populations. Inconsistencies and errors were common in the data files from the two different sources, and in some cases inclusion criteria were not ideal for the purposes of this review which created a challenge in reconciling event lists. Additionally, mainly due to the small number of tsunami run-up events reported over the study period, we were unable to perform more complicated statistical analyses that would have provided estimates of the independent effects of place and event characteristics on tsunami related death. When combined with the relatively small number of tsunami events, uncertainty in the historical record limits the conclusions that can be drawn about the impact of tsunamis on human populations. A principal limitation of the literature review is the fact that only English language publications were included; this likely contributed to incomplete coverage of studies published in other languages originating from low and middle income countries.
Conclusions
From 1900 to 2009, a total of 250,000 tsunami-related deaths and close to 50,000 injuries, respectively, were reported, the majority of which were concentrated in the 2004 Indian Ocean tsunami. An estimated 2.5 million people were affected by tsunamis during this time period. While mortality estimates presented in this study are consistent with those reported in other studies, particularly for the 2004 Indian Ocean Tsunami, the injury figure may be an underestimate of the true value given low reporting levels. The distribution of tsunami related deaths varied greatly by region and economic development level. Findings from the historical event review indicate that the South East Asian region and poorer countries were more likely to experience higher mortality was associated with larger wave height and closer proximity to the source.
The primary cause of tsunami-related mortality was drowning and, although a number of injury types were reported following tsunamis, the ratio of dead to injured is much greater in tsunamis as compared to other natural disaster types. Risk factors for tsunami-related death included female sex and very young and old age. Tsunami losses are likely to increase in future years due to population growth in high risk seismic areas. Increased attention to tsunami prevention and mitigation strategies, with a focus on areas most prone to tsunamis and populations at greater risk is necessary. While strategies that are specific to the development level and country context are important, global initiatives such as early warning systems are essential for further tsunami risk mitigation.
Competing Interests
The authors have declared that no competing interests exist.
Correspondence
Shannon Doocy, Johns Hopkins Bloomberg School of Public Health, 615 N. Wolfe St, Suite E8132, Baltimore, MD 21230. Tel. 410-502-2628. Fax: 410-614-1419. Email: [email protected].
Introduction
From a global disaster perspective, volcanic eruptions result in relatively little mortality and displacement. Approximately 274,443 volcano fatalities have been documented in the historic records, with an estimated 98,386 fatalities and 5.6 million people affected in the 20th century 1,2 . The 1902 eruption of Mount Pelee in Martinique resulted in 30,000 deaths, which is the highest number of fatalities in any 20th century volcanic event. By comparison, floods were the leading cause of death in the 20th century, resulting in an estimated 6.8 million deaths, and deadliest disaster of the 20th century, the 1976 Tangshan earthquake, caused 242,000 deaths 3. The historical records show that the impact of volcanic eruptions on human populations is punctuated by relatively few catastrophic events with long intervals in between each event.
Approximately 9% of the global population, more than 500 million people, lives within potential exposure range of a volcano that has been active within recorded history 4,5,6. At present, there are an estimated 550 active volcanoes 7 many of which are in locations experiencing rapid population growth. Major urban centers are commonly found within close proximity to volcanoes, including Naples and the capital cities of Mexico, Japan, and the Philippines 8. Population density generally decreases as distance from the volcano increases, with the highest population densities in close proximity to volcanoes in Southeast Asia and Central America 6. The risk of catastrophic loss from future eruptions is significant given population growth, proximities of major cities to volcanoes, and the possibility of larger eruptions 9,10. The objectives of this review are to describe the impact of volcanoes on the human population, in terms of mortality, injury, and displacement and, to the extent possible, identify risk factors associated with these outcomes. This is one of five reviews on the human impact of natural disasters, the others being cyclones, floods, tsunamis, and earthquakes.
Methods
Data on the impact of volcanic events were compiled using two methods, a historical review of volcanic events and a systematic literature review for publications relating to the human impacts of volcanic eruptions with a focus on mortality, injury, and displacement.
Historical Event Review
A historical database of significant volcanic eruptions between 1900 and 2009 was created from publicly available data. Multiple data sources were sought to ensure a complete listing of events and inclusion of both human and geophysical factors. The two primary data sources were EM-DAT: The Emergency Events Database 3 and the National Oceanic and Atmosphere Administration – National Geophysical Data Center (NOAA-NGDC) Significant Volcanic Eruption Database 11. For an event to be included in the EM-DAT database, one or more of the following criteria must be fulfilled: 10 or more people killed or injured; 100 people reported affected; declaration of a state of emergency; or a call for international assistance. In the NOAA-NGDC database, a significant eruption must meet one or more of the following criteria: caused fatalities; caused moderate damage (approximately $1 million or more); caused a tsunami; or was associated with a major earthquake.
Event lists from both databases were downloaded in July 2007 and August 2009. The reporting format for EM-DAT changed during this time period and revisions were made to some records in the NOAA-NGDC database. Event lists were reconciled to create a combined list of events for each data source; the EM-DAT list included 209 events, and the NOAA-NGDC list included 229 events. Event lists were then merged to create a complete listing of significant volcanic events between 1900 and 2009. Volcano and eruptive characteristics were abstracted from the Smithsonian Institution’s Global Volcanism Program (GVP) and added to each event 7; and data on human impacts were added from the Volcanic Disasters and Incidents Database 2. To prevent including events with no direct human impact, records where human impact (mortality, injury, or homelessness/displacement) was not quantified by any source were removed. A limitation of using the NOAA database is that events are reported if they are associated with an earthquake or tsunami, regardless of human impact. Similarly, an emergency declaration is sufficient for inclusion in the EM-DAT database, irrespective of if human populations are actually affected. The final list included 192 events reported by EM-DAT and 192 reported by NOAA; 71 events were reported by both sources yielding a total of 313 volcanic events affecting populations between 1900 and 2009. See https://www.jhsph.edu/refugee/publications_tools/index.html for the database of volcano events.
In order to examine country- and event-specific characteristics associated with low and high levels of volcano mortality, deaths were categorized as follows: low (<10 deaths), medium (11-75 deaths) and high (>75 deaths). Bivariate tests for associations between volcano characteristics and human impacts were performed using χ2 (categorical measures) and ANOVA (continuous measures), and a multinomial logistic regression model was used to examine the probability of evacuation in volcanic events given volcano type, time period, and certain eruptive characteristics. All analyses were performed using Stata Statistical Software, Version 11.0 12.
Systematic Literature Review
Key word searches in MEDLINE (Ovid Technologies, humans), EMBASE (Elsevier, B.V., humans), SCOPUS (Elsevier B.V., humans), and Web of Knowledge, Web of Science (Thomson Reuters) were performed to identify articles published in July 2007 or earlier that described natural hazards and their impact on human populations. One search was done for all the five natural hazards described in this set of papers. This paper describes the results for cyclones. The systematic review is reported according to the PRISMA guidelines. Key words used to search for natural hazards included natural hazard(s), natural disaster(s), volcano(es), volcanic, volcanic eruption, seismic event, earthquake(s), cyclone(s), typhoon(s), hurricane(s), tropical storm(s), flood(s), flooding, mudslide(s), tsunami(s), and tidal wave(s). Key words included for impact on human populations were
Title screening was performed to identify articles that were unrelated to natural disasters or human populations. Each title was screened by two independent reviewers and was retained if either or both reviewers established that inclusion criteria were met. To ensure consistent interpretation of inclusion criteria, percent agreement was assessed across reviewers for a small sample of articles, and title screening began after 80% agreement on inclusion was achieved. A total of 4,873 articles were retained for abstract review. Articles that met one or more of the following criteria were excluded in the abstract screening: language other than English; editorial or opinion letter without research-based findings; related to environmental vulnerability or hazard impact but not human populations; individual case report/study; focus on impact/perceptions of responders; and not related to human or environmental vulnerabilities or impacts of hazards. As with the title screening, overall percent agreement between reviewers was assessed and abstract screening began only after achieving 80% agreement on inclusion. Each abstract was screened by two independent reviewers and was retained if either or both reviewers established that inclusion criteria were met. During the abstract review, included abstracts were coded for event type, timeframe, region, subject of focus, and vulnerable population focus. A total of 133 articles were retained for full article review. Articles discussing the impacts of natural disasters on human populations in terms of mortality, injury, and displacement were prioritized for review. A total of 59 articles on volcanic events meeting the aforementioned subject focus criteria were retained for full review. Upon full review, 19 articles were retained including 10 that underwent dual review, standard data abstraction and 6 that were identified as review articles (Figure 1). Following the systematic review, a hand search was conducted using the databases and key words listed above to identify relevant articles published between July 2007 when the initial search was conducted and October 2012; one additional article was identified that met criteria for full review. In total, 10 articles with primary data relating to risk factors for mortality, injury or displacement were identified (Table 1) and summaries of (n=6) review articles are presented in Tables 2.
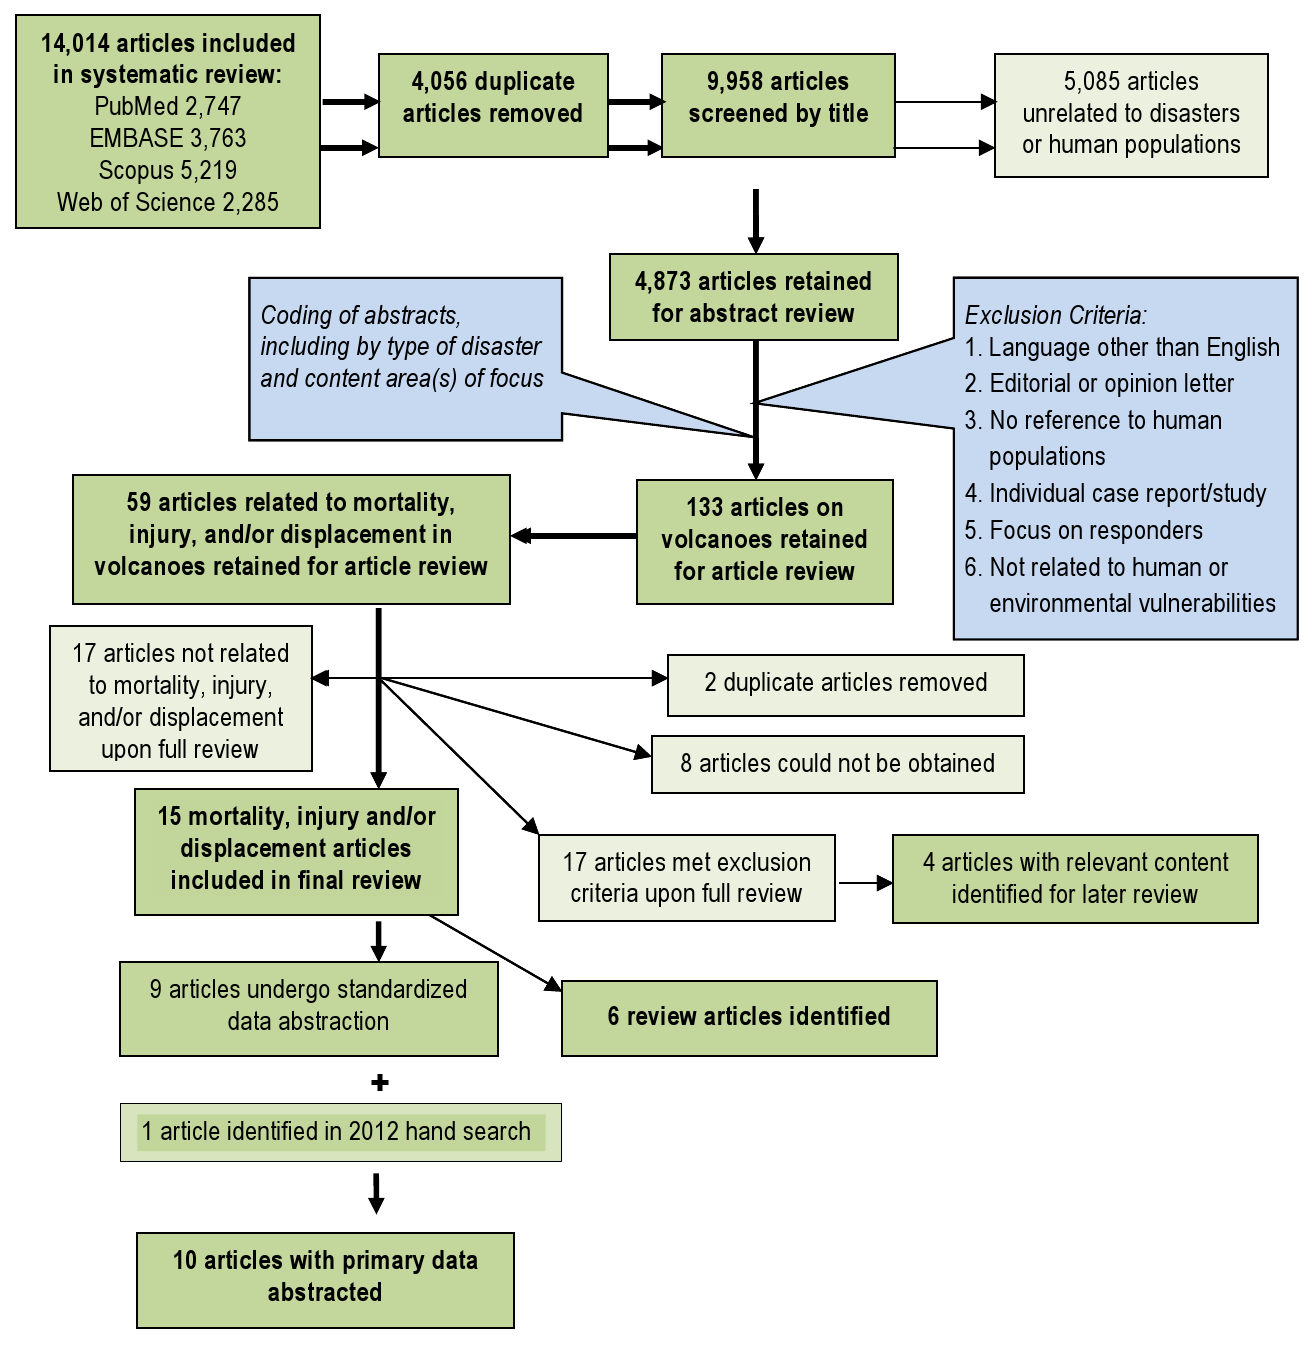
Fig. 1: Overview of the systematic literature review process for volcanoes
Article
Event
Summary
Mortality (n=7)
Injury (n=4)
Morbidity (n=6)
Displacement (n=2)
Eisele et al., 198116
Mount St Helens, USA, 1980
Documents mortality attributed to the Mount St. Helens eruption
53 deaths at time of publication (35 dead, 18 presumed dead), mostly due to asphyxia; proximity was a key risk factor for mortality
Not reported
Not reported
Not reported
Merchant et al, 198223
Mount St Helens, USA, 1980
Evaluates resulting health effects in surrounding areas of Washington state
32 deaths reported from asphyxia (19), burns (6), falling objects (4), fall (1), blast injury (1), and unknown (1)
Primarily respiratory problems as a result of ash exposure; also ocular irritation
Increase in emergency room respiratory admissions and respiratory conditions in high exposure groups
Not reported
Fraunfelder et al, 198339
Mount St Helens, USA, 1980
Assesses ocular effects, ash exposure, and emergency room surveillance data
Not reported
Not reported
No long term ocular or respiratory effects from ash exposure; freq. of complaints increases with ash exposure
Not reported
Bernstein et al, 198622
Mount St Helens, USA, 1980
Considers issues surrounding forecasting of volcanic events
48 deaths reported; among the 25 autopsied, causes of death were ash asphyxiation, (17), thermal injuries (5), trauma (3)
12 injured, from burns or ash inhalation; 72% of survivors in the damage areas injured
Respiratory effects due to ash inhalation were associated with prior lung conditions, occupation, exposure time, and distance
Not reported
Heggie et al, 200440
Kilauea, USA, 1993
Describes injuries and illnesses among hikers in active lava flow areas of Volcanoes National Park
Not reported
472 injured, mostly scrapes and abrasions; novice hikers were at increased risk
Dehydration, respiratory irritation, and headaches were commonly reported
Not reported
Dent et al, 199541
Rabaul, Papua New Guinea, 1994
Reports the impact of the Rabaul eruption on surrounding populations
10 deaths reported from asphyxia (3), road trauma (3), frail/ill/ stranded (2), lightning (1), flood (1)
22 injuries reported
Not reported
~ 70,000
Bourdier et al, 199742
Kelut, Indonesia, 1990
Describes eruptive process; little discussion of human impact
32 deaths reported, the majority of which were due to roof collapse
Not reported
Not reported
Not reported
Horrocks, 199825
Monserrat, 1995
Overview of the effects of continuing volcanic activity on Monserrat
19 deaths reported
Not reported
Not reported
~7,000 displaced; >60% resettled off the island
Grattan et al, 200327
Laki Fissure, Iceland, 1783
Explores the health impact of volcanogenic gasses across Europe using historical data
Volcanogenic pollution and dry fog, and high temperatures contributed to excess mortality in England during the summer of 1783
Not reported
Difficulty breathing, eye and skin irritation, headaches, loss of appetite, and fatigue were associated with dry fog
Not reported
Carlsen et al, 201243
Eyjafjallajokull 2010 eruption in Iceland
Estimates the physical and mental health effects of the Eyjafallajokull volcanic eruption on nearby residents.
Not reported
Not reported
Half of the asthmatics had more pronounced symptoms during eruption ,7% experienced post traumatic stress, Short-term ash exposure was associated with upper airway irritation.
Not reported
Article
Summary
Key Findings
Baxter, 198619
Preventative measures in volcanic eruptions
Some of the most severe eruptions have occurred without warning; explosive volcanoes are generally the most dangerous with the greatest damage occurring within a few kilometers of the volcano; fatalities will likely exceed the number of injured.
Baxter, 199831
Modeling of human survival in pyroclastic flows, and factors associated with survival
Location is an important determinant of survival and injuries. Close to the eruption, conditions are unsurvivable; in distal areas, death mainly results from asphyxiation; reduced temperature and pressure are associated with increased survival.
Tanguy, 199814
Historical review of mortality in volcanic eruptions between 1783-1997
An estimated 221,907 volcano-related deaths were reported in this period, including 79,286 (35.7%) from primary volcanic phenomena, most of which were associated with pyroclastic flows. Other volcano related deaths were associated with related mudflows/lahars (17.1%), tsunamis (16.9%), and famines or epidemics (30.3%).
Simpkin, 20011
Review of volcanic fatalities in the historic record
More than 400 fatal volcanic eruptions have been documented in the past few decades, with an average of 2-4 fatal eruptions annually. An estimated 274,443 volcano fatalities have been documented, and there is an increasing trend in fatal eruptions which is likely associated with population growth.
Hansell, 20049
Review of health hazards from volcanic gases
Studies that assess volcano related mortality suggest that volcanic gases account for less than 1-4% of mortality, though these are likely underestimates.
Witham, 20052
Review of human impacts of volcanoes during the 20th century
Database on deaths, injuries, evacuees and people made homeless by volcanic phenomena from 1900-1999. Includes 491 events with deaths reported in 53% of events; total death toll estimated at 91,724.
Results
Historical Event Review
Overall, an average of 3 (range 1-10) volcanic eruptions affecting human populations occurred annually. When trends in reporting were assessed by source, the number of events reported annually by NOAA (range 8-27) was more consistent than EM-DAT (range 2-53), where the frequency of reported events increased over time and in particular after 1970 (Figures 2 & 3). The impact of volcanic events across regions from 1979 – 2009 is summarized in Figure 4. The World Health Organization defined regions of the Western Pacific (WPRO), Americas (AMRO) and Southeast Asia (SEARO) each accounted for more than 20% of volcanic eruptions, while both the Africa (AFRO) and the European (EURO) regions each accounted for less than 10% of eruptions; no volcanic eruptions were reported in the Eastern Mediterranean (EMRO) region. When deaths were assessed, the vast majority occurred in the AMRO region, which had 73% of reported deaths for 1900-2008; significant minorities of deaths were reported in the SEARO (16%) and WPRO regions (8%). WPRO was the region with the largest affected, which comprised approximately half of the global affected population in each time period. The AMRO region, which reported the greatest number of volcanic events and deaths for both time periods, had less than 20% of the total affected population. The overall impact of volcanic events on human populations is summarized in Table 3.

Fig. 2: Reporting of volcanic eruptions by source and decade

Fig. 3: Volcanic events affecting human populations by decade
*Regions as defined by the World Health Organization
Fig. 4: Regional summary of volcanic eruptions and their effects on human populations,1980-2009*
Notes: figures based on the highest reported number of deaths or injuries in an event in one country. Homeless and total affected populations are reported only by EM-DAT, thus ranges are not presented for overall impact estimates.
Cumulative Impact of Volcanoes 1900-2009 [1980-2009]
Human Consequence
# of Events
Best Estimate
Range
1900-2009 (n=313)
1980-2009 (n=147)
1900-2009 (n=313)
1980-2009 (n=147)
1900-2009 (n=313)
1980-2009 (n=147)
Deaths
237*
44
91,789
28,365
81,703-102,372
25,400-28,072
Injuries
59
18
14,726
9,284
11,541-17,917
7,664-10,903
Homeless
135
55
4,177,163
2,752,365
—
—
Total Affected
156
65
4,719,414
3,128,764
—
—
Event Summary Statistics
Human Consequence
# of Events
Median
Mean
Range
1900-2009 (n=313)
1980-2009 (n=147)
1900-2009 (n=313)
1980-2009 (n=147)
1900-2009 (n=313)
1980-2009 (n=147)
1900-2009 (n=313)
1980-2009 (n=147)
Events with deaths
191 [61.0%]
60 [40.8%]
6
6
536
710
1-30,000
1-23,080
EM-DAT
81 [28.0%]
35 [23.8%]
58
15
1,184
743
1-30,000
1-21,800
NOAA
163 [49.7%]
43 [29.3%]
5
4
466
681
1-28,000
23,080
Events with Injuries
59 [18.8%]
22 [15.0%]
11
13
304
589
1-7,500
1-10,000
EM-DAT
26 [8.3%]
18 [12.8%]
32
21
426
377
2-5,000
1-5,000
NOAA
42 [13.4%]
14 [9.5%]
6
8
325
908
1-10,000
1-10,000
Homeless
188 [60.1%]
106 [72.1%]
2050
5,000
20,479
32,530
0-1,035,870
450-1,035,870
Total Affected
156 [49.8%]
123 [83.7%]
3000
5,000
22,698
31,481
0-1,036,035
6-1,036,035
Mortality and Injury. When mortality data from the three sources were combined, deaths were reported in 76% (n=237) of eruptions since 1900. Overall, 91,834 deaths (range 85,169-102,372) resulting from volcanic eruptions were reported in the historical event review. For eruptions where mortality was reported, there was a median of 6 (mean = 536; 5% trimmed mean= 117; range 1-30,000) deaths per eruption when using the highest reported death toll. The ten most deadly eruptions accounted for 81.1% of reported volcano mortality (Table 4). Deaths were concentrated in Martinique (30.3% or 31,023 deaths, 3 events), Colombia (23.5% or 24,099 deaths, 7 events), Indonesia (18.4% or 18,840, 70 events) and Guatemala (12.2% or 12,522 deaths, 10 events). Injuries were reported in 59 (18.8%) events where a total of 14,726 injuries (range 11,549-17,917) were documented. In eruptions where injuries were reported, there was a median of 11 (mean = 304; 5% trimmed mean=93, range 1-10,000) injuries per eruption when the highest reported figure was used. To estimate the total number of injuries due to volcanic eruptions, it was presumed that injuries would occur in events where deaths were reported. A total of 237 eruptions with fatalities occurred were reported; when the median and 5% trimmed mean for injuries were applied to the remaining 178 events with fatalities, it was estimated that between 1,958 and 16,643 unreported volcano related injuries may have occurred between 1900 and 2008.
Notes: table includes the maximum number of deaths reported for the event. Percent calculated based on maximum reported deaths in all volcanic events between 1900 and 2009.
Deaths Reported
Percent
Injured
Total Affected
1. Mount Pelee (Martinique, 1902)
30,000
29.3%
Not reported
Not reported
2. Nevado del Ruiz (Colombia, 1985)
23,080
22.5%
10,000
12,700
3. Santa Maria (Guatemala, 1902)
6,000
5.9%
Not reported
Not reported
4. Semeru (Indonesia, 1909)
5,500
5.4%
Not reported
Not reported
5. Kelut (Indonesia, 1919)
5,110
5.0%
Not reported
Not reported
6. Santa Maria (Guatemala, 1929)
5,000
4.9%
Not reported
Not reported
7. Lamington (Papua New Guinea, 1951)
3,000
2.9%
Not reported
Not reported
8. El Chichon (Mexico, 1982)
1,879
1.8%
500
40,500
9. Oku Volcanic Field (Cameroon, 1986)
1,746
1.7%
437
10,437
10. Soufriere Hills (St Vincent, 1902)
1,680
1.6%
Not reported
Not reported
Total
82,995
81.1%
Data to compute ratios of deaths to injured and affected populations was available for 58 and 130 historical events, respectively. Wide variation in ratios was observed, presumably because of variation in reporting quality. For 1900-2008, the median ratio of dead: injured was 0.63 (mean 2.53, range 0-36). When compared to the affected population, there was a median of 0 deaths per 1000 affected (mean = 96, range 0-6709). Point estimates for both ratios decreased by approximately half in the period of 1980 to 2008, which may suggest improvements in disaster response and preparedness; however, these changes were not statistically significant. Multinomial logistic regression for predictors of evacuation indicates that time period of the eruption (among other factors) is significantly associated with evacuation, where eruptions occurring in 1980 and later were 20.25 (CI: 8.01-51.21) more likely to have an evacuation reported as compared to those between 1900-1939, which also suggests improvements in preparedness and response (Table 5).
Note: based on a forward multinomial logistic model including all variables in Table 5.
Coefficient (95 CI)
p-value
VEI
1.71 (1.22-2.39)
.002
Volcano type
Complex volcano
Reference
Shield volcano
3.78 (0.96-16.3)
.056
Stratovolcano
4.52 (1.76-11.62)
.002
Other
5.60 (1.37-22.94)
.017
Time Period
1900-1939
Reference
1940-1979
3.78 (1.59-8.93)
.002
1980-2008
20.25 (8.01-51.21)
<.001
Pyroclastic Flow
2.61 (1.28-5.34)
.008
Flank Vent
3.95 (1.82-8.62)
<.001
Mudflows
2.54 (1.25-5.17)
.010
Lava Dome
1.96 (0.93-4.13)
.075
Model Statistics
80.5% Predicted Correct
HL Goodness of Fit
X2 = 123, df=9
<.001
Affected Population and Other Impacts. An estimated 4.7 million people were reported to be affected by volcanoes between 1900 and 2009, including 4.2 million that were rendered homeless. However, these figures are likely to substantially underestimate the true impact of volcanoes on human populations because estimates of the total affected population and the homeless population were reported in 49.8% (n=156) and 43.3% (n=135) of events, respectively. The distribution of the affected population was highly skewed: on average 22,698 people were affected in an eruption, though the median affected population was significantly lower at 3,000. Other measures of effect on human populations reported by GVP included evacuation and damages in excess of one million dollars; these data were reported for 296 (94.6%) of events. Damage in excess of one million dollars were reported in 75.0% of events (n=222/296) and evacuation was reported in 56.5% (n=177/296) of events.
Eruptive Characteristics. Eruptive characteristics were reported by GVP for 296 (94.6%) eruptions in the event file. When assessed by volcano type, proportions were as follows: stratovolcano 73% (n=228), complex volcano 13% (n=39); shield volcano 7% (n=22); caldera 4% (n=11); cinder cone 2% (n=4); and others 2% (n=4). VEI is a logarithmic scale (0-8) indicating the amount of mass ejected during an eruption and the size of the eruption column. 13 In general, VEI 1-3 events generate localized hazardous phenomena and VEI 4-5 events have the potential for disruption on a regional scale; VEI 6+ events can affect the entire planet via their impact on global climate 10. The average VEI of eruptions was 2.60 (Table 6). In a multinomial regression model, an average of 362 additional deaths (CI: 57-667, p=.020) were associated with a one unit increase in VEI after controlling for evacuation.
*mean affected population reported by EM-DAT; damage and evacuation reported by GVP
Frequency of Events
Events with Deaths
Mean Deaths (median)
Mean Affected, Thousands (median)
Damage> 1M USD
Evacuation Reported
Volcano Type(n=312)
Complex volcano
39 (12.5%)
87.20%
19 (10)
7.9 (3.0)
71.40%
31.40%
Shield volcano
22 (7.1%)
77.30%
121 (2.5)
27.9 (2.5)
55.60%
38.90%
Stratovolcano
228 (73.1%)
72.10%
482 (10)
37.0 (10.1)
78.50%
65.10%
Others
23 (7.4%)
66.70%
137 (419)
6.41 (4.6)
84.20%
57.90%
VEI (n=273)
1 or less
29 (10.6%)
72.40%
37 (95)
21.4 (5.3)
44.80%
44.80%
2
104 (38.1%)
69.20%
83 (30)
24.8 (4.9)
69.20%
42.30%
3
100 (36.6%)
81.00%
403 (32)
18.8 (5.5)
84.00%
71.00%
4 or more
40 (14.7%)
87.50%
1523(500)
57.1 (40.5)
97.50%
77.50%
Eruptive Characteristics
Central Vent
226 (80.4%)
77.00%
416 (42)
40.2 (3)
78.20%
60.60%
No Central Vent
55 (17.4%)
78.20%
305 (158)
9.9 (6)
76.10%
50.90%
Pyroclastic Flow
152 (54.3%)
82.90%
103 (37)
20.5 (47.5)
88.20%
73.70%
No pyroclastic Flow
128 (45.7%)
70.30%
645 (58)
44.9 (7.7)
62.50%
40.60%
Lava Flow
137 (48.8%)
75.90%
101 (38.5)
34.6 (7.7)
78.80%
65.00%
No Lava Flow
144 (51.2%)
78.50%
679 (89)
36.4 (5.1)
74.30%
52.80%
Lava Dome
80 (28.5%)
82.50%
613 (37)
49.6 (5.0)
82.50%
78.80%
No Lava Dome
201 (71.5%)
75.10%
308 (100)
29.6 (7.1)
74.10%
50.70%
Flank Vent
61 (21.7%)
83.60%
807 (175)
70.6 (6.9)
85.20%
75.40%
No Flank Vent
220 (78.3%)
75.50%
273 (32)
25.3 (6)
74.10%
54.10%
Radial Fissure
63 (22.4%)
73.00%
81 (56.5)
22.9 (5.9)
84.10%
61.90%
No Radial Fissure
218 (77.6%)
78.40%
483 (68.5)
38.9 (6.0)
74.30%
57.80%
Phreatic Explosion
105 (37.4%)
80.00%
766 (90)
43.0 (6.3)
79.00%
70.50%
No Explosion
176 (62.6%)
75.60%
149 (58)
30.1 (6.0)
75.00%
51.70%
Crater Lake Eruption
22 (7.8%)
72.70%
2073(677.5)
19.9 (10.2)
77.30%
50.00%
No Lake Eruption
259 (92.2%)
77.60%
252 (41.5)
36.6 (6.0)
76.40%
59.50%
Debris Avalanche
27 (9.6%)
81.50%
440 (58)
3.7 (4.0)
88.90%
66.70%
No Avalanche
254 (90.4%)
76.80%
390 (79)
38.4 (7.8)
75.20%
57.90%
Mudflow
126 (44.8%)
87.30%
758 (84)
55.3 (9.0)
89.70%
74.60%
No mudflow
155 (55.2%)
69.00%
94 (30)
17.6 (5.6)
65.80%
45.80%
Tsunami
27 (9.6%)
81.50%
2015(431)
26.4 (5)
77.80%
48.10%
No tsunami
254 (90.4%)
76.80%
271 (48)
36.3 (6.7)
76.40%
59.80%
Systematic Literature Review
Mortality. A review by Tanguy (1998) estimates 221,907 deaths from major volcanic eruptions over the past two centuries (1783-1997), which includes 90% of recorded deaths throughout history. Volcano related mortality was attributed to primary volcanic phenomena (see table 7 for definitions) including ash and pyrolcastic flows (36%), mudflows or lahars (17.1%), volcanogenic tsunamis (16.9%), and post-eruption epidemics or famines (30.3%). Of the 79,286 deaths due to primary volcanic phenomena, 75.0% were attributed to pyroclastic flows or surges and magma-generated sector collapse, followed by debris avalanches (12.6%), ash fall including ballistic projectiles (11.6%), and lava flows (0.8%). Four volcanic eruptions (Tambora, 1815; Krakatau, 1883; Mt. Pelee, 1902; and Ruiz, 1985) accounted for more than 66% of deaths, and the principal causes of death, including famine, tsunamis, pyroclastic flows, and lahars varied in each event. While famine and epidemics were the principal causes of mortality in earlier volcanic events, they currently present much less of a risk due in large part to international relief and humanitarian assistance efforts 14.
Source: adapted from McGuire, 1998 unless otherwise cited; excludes the related hazards of volcano-related earthquakes and tsunamis.
Pyroclastic flows and surges are among the most life-threatening of volcanogenic hazards; high velocities combined with extreme temperatures can lead to severe destruction.
Prior evacuation of threatened areas (identified by hazard mapping) can reduce loss of life. More broadly, effects of pyroclastic flows could be mitigated via long-term urban planning (subways, strong buildings) in lieu of evacuations plans (which are often difficult to implement).14
Lava flows are driven by gravity and their paths are constrained by topography and can thus be predicted.
Hazard maps can be developed for areas of at risk of flow-related damage; more advanced models incorporate digital terrain mapping and solidification during advance which allows for rapid prediction of flow-field volume.44
Debris flows (lahars) and floods are responsible for nearly all of the volcano-related deaths in the last two decades of the 20th century as well as major destructive impacts on surrounding communities.
Lahars are highly topographically constrained, and commonly are confined to river courses, allowing for the prediction of likely debris flow paths, hazard mapping, and identification of high risk areas. Warning systems that permit evacuation could reduce the lethal effect of lahars. Engineering measures, such construction of baffles and sediment dams, can reduce flow mass and resulting destruction. Long-term urban planning can also reduce risk by avoidance of dense population concentrations in valleys and deltas.14
Tephra can be one of the most disruptive volcanic hazards, with ash fall typically representing the most extensive and disruptive form.
In the developing world, tephra accumulation on roofs of poorly constructed buildings often results in collapse; campaigns to promote ash removal can reduce fatalities and damage from tephra-induced roof collapse. Humanitarian assistance can reduce potential long-term impacts of resulting crop loss, livestock deaths, and economic disruption.
Debris avalanches (volcanic landslides) may be associated with an eruption but also occur during periods of inactivity.45
High velocities make prior evacuation the only measure for preventing loss of life. However, evacuation can present a challenge because it requires recognition that a landslide is likely in the short term and identification of the threatened areas.
Gas emissions associated with eruptions or degassing activity include sulphur-dioxide, sulphuric acid, aerosol, hydrochloric acid, carbon dioxide, hydrogen sulfide, mercury, radon and other gases.8
Reductions of future morbidity associated with volcanic gas include identification and ongoing monitoring of hazardous lakes, resettlement, pre-evacuation, and establishing guidelines relative to areas of refuge.46
Another database developed by Witham (2005) considers all volcano-related incidents (n=491) with human impacts between 1900 and 1999, including 296 (60%), which were classified as disasters. Witham found the number of people impacted per event was substantially greater in middle income than in high income countries, with middle income countries reporting the highest numbers of volcano related deaths, injuries, and affected populations 2. While fatalities were the most frequent outcome, observed in 53% of events, the largest consequence was displacement, which accounted for 94% of the affected population. Similar to historic findings, the study found fatalities to be concentrated in relatively few large events. The eruptions of Mt. Pelee (1902) and Nevado del Ruiz (1985), which together accounted for more than 50% of deaths, and the top ten events combine to account for more than 90% of deaths. During the 20th century, pyroclastic flows were the primary cause of death followed by lahars (which were also the principal cause of injury), and tephra was a primary cause for evacuation and displacement 2. Tephra, which includes fragmental material from volcanoes and volcanic ash, is also a common cause of trauma-related deaths either by projectile impact or collapse of ash-covered roofs 1. The three main causes of direct mortality in recent volcanic eruptions include asphyxiation from ash, thermal injuries from pyroclastic flow, and trauma (Table 2) 15,16. A review of health hazards from volcanic gases indicates that volcanic gases account for less than 1% to 4% of mortality, though this is a likely underestimate because studies neglect volcanic degassing when unassociated with eruptive activity, and because the extent of dispersion of volcanic gases is not always appreciated 17. Historical estimates in the 20th Century suggest that 2,000 deaths have resulted from volcanic gases, with the most hazardous volcanogenic gases being carbon dioxide, sulfur dioxide, hydrogen sulfide, mercury, and radon 18.
Morbidity. Transient increases in trauma-related injuries resulting from traffic accidents and falls, and morbidity, primarily ocular irritations and respiratory symptoms, are observed following volcanic eruptions. Increases in communicable diseases and long-term health effects are not attributed to volcanic eruptions, however, volcanism associated morbidity is likely underestimated 9. Ash fall can have health implications for populations as far as hundreds of kilometers away 19. A recent review of the respiratory effects of volcanic ash suggests that they are short-lived and dependent on the mode of ash generation and particle size, among other factors 20. De novo appearance of ash-related asthma has not been documented, though increases in respiratory symptoms are frequently reported. Higher levels of ash exposure have been associated with increased reports of respiratory symptoms among children 21 and in high-exposure occupation groups 22,23. Increases in emergency room visits for respiratory problems have been observed following recent volcanic eruptions in the United States and Ecuador, where children under five 24 and individuals with pre-existing lung conditions such as asthma or chronic bronchitis were at increased risk for the development of respiratory symptoms 20,22,23. Recently, adverse cardiorespiratory health effects have been associated with chronic exposure to volcanogenic gases in both Hawaii and Montserrat 25,26 and historically, where one study suggested that adverse health symptoms in Europe during the summer of 1783 was associated with volcanic gases and fogs 27. Review findings indicate that volcanic eruptions are associated with short-term increases in morbidity, primarily ocular irritations and respiratory symptoms.
Discussion
Main Findings
An increasing trend in the total population affected by volcanoes each decade is observed after 1950; however, this is not unexpected considering this information is reported by EM-DAT where the number of events reported increased over time. Other factors likely contributing to this observation are improved data reporting quality and population growth, which has resulted in a larger population and greater levels of development in at risk areas. This is poses concerns, where lower magnitude eruptions in areas that have experienced significant land use change and high population growth may have greater impacts than anticipated when projections are based on the historical record alone. The 1985 eruption of the Colombian volcano Nevado Del Ruiz is an example of increasing human vulnerability to volcanoes due of population growth in high-risk areas. The town of Armero, which was completely buried by lahars in 1985, experienced similar lahars in 1595 and 1845 and in both instances the community was rebuilt and population expanded 28. In addition to population growth and land use change, globalization is an emerging factor, which may contribute also to increased vulnerability to natural disasters and result in consequences that span larger geographic regions 29.
The increasing frequency of volcanic incidents and impacts on human populations has been documented elsewhere and may reflect numerous factors, including increased reporting, increased use of evacuation in risk mitigation, growth in the population at risk, and actual changes in global volcanic activity 1,2. A total of 102,373 volcano related deaths and an average of 430 deaths per eruption were reported between 1900 and 2008 when the highest mortality estimate from any source in the historical event review was used (102,140 deaths were reported during the 20th century). Other estimates of 20th century volcano mortality range from 91,724 to 98,376, with an average of 845 to 917 deaths per eruption 2,14. Mortality was concentrated in several significant eruptions, most notably the 1902 eruption of Mt. Pelee on the Island of Martinique which resulted in 28,000 to 30,000 deaths and the 1985 eruption of Colombia’s Nevado Del Ruiz where a lahar caused an estimated 21,800 to 23,080 fatalities. Overall, 45% of volcanic deaths between 1900 and 2008 were reported in the 1900s, 29% in the 1980s, and the remaining 26% in other decades.
Historically, pyroclastic flows have accounted for the majority of mortality in volcanic events, which suggests they will continue to be the most lethal volcanic agent in the near future. It has been widely assumed that pyroclastic flows are unsurvivable, but evidence from eruptions in the 20th century challenges this assumption, especially at the periphery of flows where impacts are attenuated and protection can be provided by resistant buildings 30. Modeling and reviews of volcanic deaths and injuries in pyroclastic flows from recent decades suggests that survival is possible under certain conditions. Survival limits on heat exposure, inhalation of hot air, and air containing hot particles have been established, and simulations show that in distal areas survival is possible. Close to the volcanic crater, conditions are unsurvivable due to heat, high particle concentrations, and elevated dynamic pressures. In distal areas of pyroclastic flows, death and injury are mainly related to asphyxiating levels of particles; reduced temperature and lower dynamic pressures increase the probability of survival, especially in masonry buildings which should be the most resistant to the impact of pyroclastic flows 31.
Since 1980, volcanic disasters have resulted in nearly 30,000 deaths, two-thirds of which were preventable and associated with a single event (Nevado del Ruiz, 1985) which suggests that improved mitigation measures have the potential to reduce loss of life in future eruptions. Effective communication with civil authorities and vulnerable populations and education about the threats posed by volcanoes is equally important as volcano monitoring and forecasting. Initiation of volcano awareness programs in volcanic hazards prone areas and contingency planning are also of central importance, particularly as the size of the population living close to active volcanoes increases 10. Accurate forecasting of the eruption force and prediction of its occurrence by volcanologists and timely evacuation of populations at risk are vital to effective emergency management, and risk assessment is an integral part of disaster preparedness 31. Monitoring has a critical role to play in reducing the impact of volcanic hazards by providing early warning and possibly identifying timeframes of forthcoming eruptions 10. In 1994, just more than 20% of the approximately 550 active volcanoes were monitored, and the extent to which monitoring has increased remains unclear 7. The crucial role of monitoring volcanic activity was exemplified during eruptive activities of Mt. St. Helens and Pinatubo when early warning signs were evident enough to start evacuation of population, involve emergency services, which ultimately minimized the number of victims.
While a wide range of geophysical, geochemical and geodetic techniques are available 32,33 the ‘core methods’ of seismic and ground deformation monitoring are the best means of tracking magma movement and accumulation. Increased monitoring, either via satellite platforms capable of detecting pre-eruptive ground deformation 34 and thermal anomalies 35 or ground monitoring is of vital importance. Geodetic and oceanographic surveys of active submerged volcanic cones have recently been employed to assess the state of their hydrothermal activity, sample gases and volcanic rocks 36,37. Periodic assessment of changes in topography of submerged volcanic cones and their geochemical activity will provide early warning signs of possible phreatic explosions. Comprehensive monitoring of volcanoes in conjunction with hazard zonation maps offer the best means of reducing casualties, primarily through ensuring evacuation of people from the threatened areas 10. Hazard zonation maps show areas of potential volcanic impacts, such as possible propagation of pyroclastic or lava flows, locations of eruptive centers, areas of probable landslides, tsunami effects and ash fallout 38. These maps are invaluable tools in planning of mitigation measures (Table 7). Evidence from recent eruptions suggests that emergency planning for explosive eruptions in urban areas should concentrate on distal areas of predicted pyroclastic flows and areas where the primary risk is death due to asphyxiation from ash inhalation rather than death due to injury. This includes the potential need to rescue survivors suffering from ash inhalation as well as trauma; a smaller number of victims may require treatment for dermal and airway burns, though their numbers may easily exceed regional capacity for treatment 31.
Limitations
Systematic reviews face numerous limitations. The effects of volcanic eruptions are the subject of gross approximations and aggregations that have a great deal of imprecision. The availability and quality of data has likely increased and improved over time, however, in many events deaths are unknown or unrecorded. For a significant number of events no data are reported for injured, displaced, and affected populations; this likely contributes to a substantial underestimation of the impacts of volcanoes on human populations. Inconsistencies and errors were common in data files from different sources, and in some cases inclusion criteria were not ideal for the purposes of this review, which created a challenge in reconciling event lists. When combined with the relatively small number of recent volcanic events, uncertainty in the historical record and the relative paucity of primary research focusing on the health-related topics significantly limits the conclusions that can be drawn about volcanic impacts on human populations. A principal limitation of the literature review is the fact that only English language publications were included; this likely contributed to incomplete coverage of studies published in other languages originating from low and middle income countries
Conclusions
The impact of volcanoes on humans in terms of mortality, injury, and affected populations, presented here is a minimum estimate because information for many volcanic events is either unknown or unreported. Data from 1900 to the present suggest that volcanoes have exacted a relatively small toll on the human population when compared to other natural disasters. However, human vulnerability to volcanic hazards is increasing, in large part due to land use change and particularly to the development of densely populated urban areas in close proximity to volcanoes.
Medical treatment clearly has a limited role in volcanic eruptions because severe injuries occur only in a relatively concentrated area, and morbidity experienced in more outlying areas is limited in both severity and duration. A strong emphasis on preparedness strategies is required, and because many major volcanic eruptions are preceded by warning signs, it is possible to plan for these events, which is evident given the increasing trend in evacuations. Because volcano fatalities are concentrated geographically in relatively few eruptions, targeted preparedness efforts in areas that are historically at risk as well as those newly identified via monitoring could be successful. Hazard evaluations for all volcanoes in populated areas, regardless of their active or dormant state, and expanded monitoring could improve preparedness levels. Hazard-specific mitigation strategies such as engineering projects or urban planning could be implemented to reduce potential impacts; however, their costs may be prohibitive when compared to the likelihood of an eruption in the near future. Broader-based awareness and education strategies targeted at the population at risk would likely result in more successful evacuations and may also increase willingness of authorities to implement more costly preparedness measures.
Competing Interests
The authors have declared that no competing interests exist.
Correspondence
Shannon Doocy, Johns Hopkins Bloomberg School of Public Health, 615 N. Wolfe St, Suite E8132, Baltimore, MD 21230. Tel. 410-502-2628. Fax: 410-614-1419. Email: [email protected].
Introduction
Floods are the leading cause of natural disaster deaths worldwide and were responsible for 6.8 million deaths in the 20th century. Asia is the most flood-affected region, accounting for nearly 50% of flood-related fatalities in the last quarter of the 20th century 1,2,3 . The Center for Research on the Epidemiology of Disasters (CRED) defines a flood as “a significant rise of water level in a stream, lake, reservoir or coastal region” 4. More colloquially, flooding is the “presence of water in areas that are usually dry” 1. The events and factors that precipitate flood events are diverse, multifaceted, and interrelated. Weather factors include heavy or sustained precipitation, snowmelts, or storm surges from cyclones whereas important human factors include structural failures of dams and levies, alteration of absorptive land cover with impervious surfaces and inadequate drainage systems. Geographic regions such as coastal areas, river basins and lakeshores are particularly at risk from storms or cyclones that generate high winds and storm surge 5. Environmental/physical land features including soil type, the presence of vegetation, and other drainage basin characteristics also influence flood outcomes 6. Floods transpire on varying timelines, ranging from flash floods with little warning to those that evolve over days or weeks (riverine). Flash floods, characterized by high-velocity flows and short warning times have the highest average mortality rates per event and are responsible for the majority of flood deaths in developed countries 1,3,7. In contrast, riverine floods which are caused by gradual accumulation of heavy rainfall are less likely to cause mortality because of sufficient time for warning and evacuation. Occasionally floods are associated with secondary hazards such as mudslides in mountainous areas.
Recent accelerations in population growth and changes in land use patterns have increased human vulnerability to floods. Harmful impacts of floods include direct mortality and morbidity and indirect displacement and widespread damage of crops, infrastructure and property. Immediate causes of death in floods include drowning and trauma or injury 1,8. Over an extended time period, there may also be increased mortality due to infectious disease 1,9,10,11 . The risks posed by future flood events are significant given population growth, proximities of populations to coastlines, expanded development of coastal areas and flood plains, environmental degradation and climate change 12. The objectives of this review were to describe the impact of floods on the human population, in terms of mortality, injury, and displacement and to identify risk factors associated with these outcomes. This is one of five reviews on the human impact of natural disasters, the others being volcanoes, cyclones, tsunamis, and earthquakes.
Methods
Data on the impact of flood events were compiled using two methods, a historical review of flood events and a systematic literature review for publications relating to the human impacts of flooding with a focus on mortality, injury, and displacement.
Historical Event Review
A historical database of significant floods occurring from 1980 to 2009 was created from publicly available data. Multiple data sources were sought to ensure a complete listing of events, to allow for both human and geophysical factors to be included, and to facilitate cross checking of information between sources. The two primary data sources were CRED International Disaster Database (EM-DAT) 4 and the Dartmouth Flood Observatory (DFO) Global Archive of Large Flood Events database 13. For inclusion in the EM-DAT database, one or more of the following criteria must be fulfilled: 10 or more people killed or injured; 100 people affected; declaration of a state of emergency; or a call for international assistance. The DFO database provides a comprehensive list of flood events recorded by news, governmental, instrumental, and remote sensing sources from 1985 to 2009. Inclusion criteria are: significant damage to structures or agriculture, long intervals since the last similar event, or fatalities. Flooding specifically related to hurricane storm surge and tsunamis were excluded.
Event lists from both databases were downloaded in July 2007 and merged to create a single database; the database was updated in August 2009. The EM-DAT and DFO databases included 2,678 and 2,910 events, reported, respectively, between 1980 and 2009. Both EM-DAT and DFO reported the date and location of the event, the affected region and the number dead. In addition, the number affected, homeless, and total affected (sum of injured, homeless, and affected) were reported by EM-DAT. DFO also reported the number displaced, duration of the event (days), and ‘flood magnitude.’ Flood magnitude is a composite score of flood severity developed by DFO that encompasses damage level, recurrence interval, duration of the flood in days and the area affected 13. For flood impacts reported by EM-DAT, zeroes were treated as missing values because they were used as placeholders and their inclusion in the analysis could contribute to the under estimation of tsunami impacts. The final list included 2,678 events reported by EM-DAT and 2,910 reported by DFO; 1,496 events were reported by both sources yielding a total of 4,093 flood events affecting human populations. See https://www.jhsph.edu/refugee/natural_disasters/_Historical_Event_Review_Overview.html for the database of flood events.
To assess risk factors for flood-related mortality the following categories were used: no deaths (0 deaths), low (1-9 deaths), medium (10- 49 deaths) and high (≥50 deaths). Bivariate tests for associations between flood mortality and the following characteristics were performed using χ2 (categorical measures) and ANOVA (continuous measures): decade, region (defined by the World Health Organization (WHO)), income level (World Bank), gross domestic product (GDP), GINI (measure of income inequality), and flood magnitude. All covariates, with the exception of GINI, which was not strongly associated with flood mortality in adjusted analyses, and GDP, which was highly correlated with per capita World Bank income level, were included in the final multinomial logistic regression model to assess the relative risk of mortality at a given level as compared to events with no deaths. All analyses were performed using Stata Statistical Software, Version 11.0 14.
Systematic Literature Review
Key word searches in MEDLINE (Ovid Technologies, humans), EMBASE (Elsevier, B.V., humans), SCOPUS (Elsevier B.V., humans), and Web of Knowledge, Web of Science (Thomson Reuters) were performed to identify articles published in July 2007 or earlier that described natural hazards and their impact on human populations. One search was done for all the five natural hazards described in this set of papers. This paper describes the results for cyclones. The systematic review is reported according to the PRISMA guidelines. Key words used to search for natural hazards includednatural hazard(s), natural disaster(s), volcano(s), volcanic, volcanic eruption, seismic event, earthquake(s), cyclone(s), typhoon(s), hurricane(s), tropical storm(s), flood(s), flooding, mudslide(s), tsunami(s), and tidal wave(s). Key words included for impact on human populations were affected, damage(d), injury, injuries, injured, displaced, displacement, refugees, homeless, wounded, wound(s), death(s), mortality, casualty, casualties, killed, died, fatality, fatalities and had to be used in either the title, abstract or as a subject heading/key word. The search resulted in 2,747 articles from MEDLINE, 3,763 articles from EMBASE, 5,219 articles from SCOPUS, and 2,285 articles from ISI Web of Knowledge. Results from the four databases were combined and duplicates were excluded to yield a total of 9,958 articles.
A multi-stage screening process was used. First, title screening was performed to identify articles that were unrelated to natural disasters or human populations. Each title was screened by two independent reviewers and was retained if either or both reviewers established that inclusion criteria were met. To ensure consistent interpretation of inclusion criteria, percent agreement was assessed across reviewers for a small sample of articles, and title screening began after 80% agreement on inclusion was achieved. A total of 4,873 articles were retained for abstract review. Articles that met one or more of the following criteria were excluded in the abstract screening: language other than English; editorial or opinion letter without research-based findings; related to environmental vulnerability or hazard impact but not human populations; individual case report/study; focus on impact/perceptions of responders; and not related to human or environmental vulnerabilities or impacts of hazards. As with the title screening, 80% overall agreement between reviewers was needed before abstract screening started. Each abstract was screened by two independent reviewers and was retained if either or both established that inclusion criteria were met. Included abstracts were coded for event type, timeframe, region, subject of focus, and vulnerable population focus. A total of 3,687 articles were retained for full article review. Articles discussing the impacts of natural disasters on human populations in terms of mortality, injury, and displacement were prioritized for review. A total of 119 articles on flood events meeting the criteria were retained for full review. Upon full review, 27 articles were retained including 17 that underwent standard data abstraction and 11 that were identified as review articles (Figure 1).
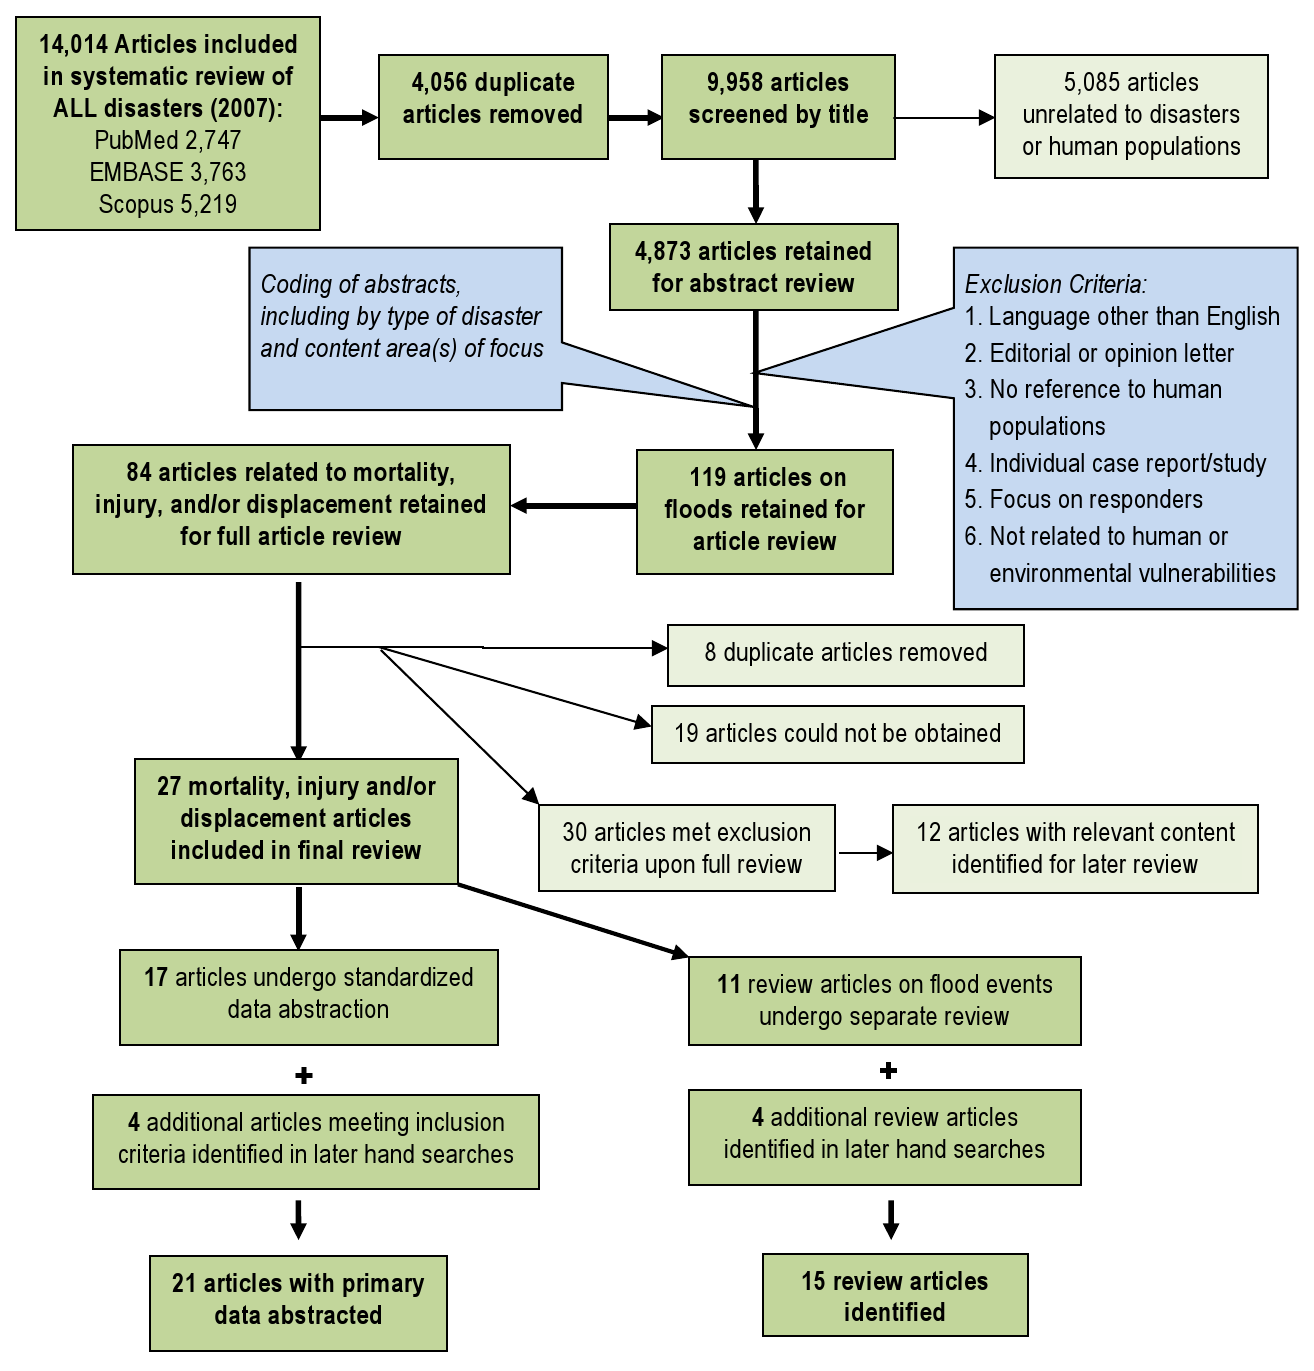
Fig. 1: Overview of the systematic literature review process for floods
Following the systematic review, a search was conducted to identify relevant articles published after the initial search up to October 2012. This search identified seven additional articles, including three articles with primary data that underwent full review and four review articles. Summaries of abstracted (n=21) and review articles (n=15) are presented in Tables 1 and 2, respectively.
* Displacement is excluded from the table because no primary data on displacement was collected in only one study, Schnitzler, 2007. ** Additional articles included from the hand searches are Schniztler 2007, Jonkman 2009, Biswas 2010 and Bich 2011.
Article
Event
Summary
Mortality (n=15)
Injury and Morbidity (n=11)
Janerich, 198153
Hurricane Agnes, 1972, New York, US
Epidemiologic investigation of cancer cases in rural town
Not reported
4 leukemia and lymphoma cases investigated; no increased risk due to flood/environmental hazards identified
Duclos,199116
October 1988,Nimes, France
Surveillance and household survey (n=108) to assess flood health effects
9 drowning deaths reported including two individuals attempting rescues; no risk factors reported
Injuries from surveillance (n=18) included: 3 severe, 3 near drowning, 2 hypothermia, and 10 minor injuries; 6% of 228 survey participants reported minor injuries
Siddique, 199117
Mid-1988, Bangladesh
Record review of health facilities and verbal autopsy
9 of 154 (6%) deaths were directly due to flooding
5% (2,367/46,470) of patients had infected injuries
CDC, 199318
Mid- 1993, Missouri, US
Public health surveillance and medical record review
27 deaths including 21 (78%) direct (drowning); 67% (n=18) of deceased were male
Not reported
CDC, 199334
Summer 1993,Missouri, US
Surveillance of flood-related injuries and illnesses reported at hospitals
Not reported
524 flood-related conditions: 250 injuries (48%) and 233 (45%) illnesses; common injuries were sprains/strains (34%), lacerations (24%), abrasions/contusions (11%)
CDC, 199419
July, 1994,Georgia, US
Record review of flood-related deaths
28 deaths, 96% (n=27) due to drowning; at risk groups were males (71%), adults (86%), and car related (71%)
Not reported
Staes, 199420
Jan 1992,Puerto Rico, US
Descriptive and case-control study of flood mortality
23 deaths; 22 (96%) drowning and 1 (4%) carbon monoxide poisoning; motor vehicles as risk factor
Not reported
Grigg, 199928
July 1997,Colorado, US
Descriptive/historical account
5 deaths reported; 80% were trailer park residents
54 injuries reported; no additional information reported
CDC, 200021
Oct 1998, Texas, US
Public health surveillance and medical record review
31 deaths mostly from drowning (n=24, 77%) and trauma (n=3, 10%); most were male and car related
Not reported
Rashid, 200022
1998, Dhaka Bangladesh
Qualitative survey
918 officially reported flood deaths; qualitative study observed 1200 deaths of which 2% were drownings
Not reported
Ogden, 200133
May 1995,Louisiana, US
Surveillance and record review of disaster-area hospitals and patient visits
Not reported
1855 post-flood injuries, including musculoskeletal (n=791, 46%), lacerations (n=385, 21%), motor vehicle (n=142, 8%), falls (n=134, 7%), and other (n=296, 16%)
Yale, 2003 23
Sept 1999, North Carolina, US
Case-control study of vehicle crashes with drowning
ü 22 deaths reported; males and adults were disproportionately represented
Not reported
Cariappa, 200335
July 2001,Orissa, India
Assessment of flood-related illness/injury in care seekers
Not reported
13% (976/7450) of health facility visits due to injury; males and those 11-40yrs accounted for most injuries
Baxter, 200525>
Jan & Feb1953, UK
Descriptive/historical account
307 deaths due to drowning and exposure; elderly and coastal/poor construction residents were most at risk
Not reported
Gerritsen, 200526
Jan & Feb 1953, The Netherlands
Descriptive review / historical account
1836 deaths; no additional information reported
Not reported
Pradhan, 200724
July 1993, Sarlahi District, Nepal
Household survey in flood affected areas
ü 302 deaths; CMR 7.3/1000; females and young children had greatest risk of death
Not reported
Spencer, 200727
Summer 1977,Pennsylvania, US
Descriptive/historical account
ü 78 deaths; no additional information reported
Not reported
Schnitzler, 200736
August 2002, Saxony, Germany
Telephone survey of flood affected households
ü Not reported
55 (11.7%) of the survey population was injured; risk of injury was increased among those who came into contact with flood water (OR 17.8, 95% CI 17.8– 30.5).
Jonkman, 200929
August 2005,New Orleans
Secondary data analysis of characteristics associated with flood-related mortality following hurricane Katrina
ü Overall mortality percent among exposed was 1%. 853 deaths reported, including 51% male (n=432) and 49% (n=421) female. The majority (85%, 705/829) were among those > 51 yrs of age. In deaths where race was reported (n=819), 55% were African American, 40% white, and 2% other.
Not reported
Biswas, 201037
Summer 2007, Bangladesh
Household survey of child injury in flood-affected areas
ü Not reported
>18% (n=117) children injured were during flood; injuries included 38% lacerations, 22% falls, 21% drowning, 8% road traffic, 6% burns, 5% animal bites.
Bich TH, 201154
October and November 2008, Hanoii, Vietnam
Cross-sectional household survey
ü 2 deaths, no additional information reported
27 injuries, including 18 lacerations/contusions/cuts, 3 fractures, 1 trauma and 5 others. Causes of injuries included falls (16), near-drowning (1) and other (10).
Article
Summary
Key Findings
Statistical Bulletin 197455
Review of tornado, flood and hurricane associated mortality in the US from 1965 to 1974
More than 1,200 flood deaths in the United States during the review period with a concentrated in a few large events. 14 major river systems were linked to flood deaths; damage can be mitigated through reforestation, construction of reservoirs and flood walls, diversion, and improved early warning and forecasting systems.
French et al., 198345
Review of National Weather Service flash floods reports from 1969 to 1981 to assess mortality effects of warning systems
Floods were the primary cause of weather-related deaths. There were 1,185 deaths in 32 flash floods with an average of 37 deaths per flood; the highest mortality was associated with dams breaking after heavy rains. Mortality was greater earlier in the study period and twice as many deaths occurred in areas with inadequate warning systems. 93% of deaths were due to drowning, of which 42% were car related.
Avakyan 199956
Review of global flood events from 1997 to 1999 using Dartmouth Flood Observatory data
Damage due to floods increased over time due to more development in flood-affected areas; mapping and regulation of flood hazards zones are necessary to mitigate damage. Globally Bangladesh is the most affected by floods. Number of events, victims, evacuees and damage are reported for each year.
Berz, 200039
Review of the impacts of major floods in the last half of the 20th century and summary of significant floods from 1990 to 1998 from the Munich Re natural event loss database
Floods account for half of all natural disaster deaths; trend analysis suggests the frequency of and damages associated with floods have increased over time. Excluding storm surges, the three most deadly flood events from 1990 to 1998 were in India, Nepal and Bangladesh in 1998–4750 deaths, China in 1998–3656 deaths, and China in 1993-3300 deaths. Explanations for increased mortality include population growth, vulnerability of structures, construction in flood-prone areas, flood protection system failures and changes in environmental conditions.
Beyhun, Altintas & Noji, 200531
Review of the impact of flooding in Turkey from 1970 to 1996
624 floods recorded during study period, including 83 fatal events with 539 deaths. There was an association between deaths and material losses, close to half of flood events occurred in summer months, and 37% of deaths in the Black Sea region.
Guzzetti, 200557
Review of flood and landslide related deaths, missing persons, injuries and homelessness in Italy from 1279 to 2002
50,593 people died, went missing, or were injured in 2,580 flood and landslide events and over 733,000 were displaced. Floods accounted for 38,242 deaths; fatal events were most frequent in the northern Alpine regions and mortality was highest in autumn. Floods were caused by high-intensity or prolonged rainfall, snow melt, overtopping or failure of levees, embankments, or dams, and reservoir mismanagement. Since World War II, landslide has exceeded flood mortality and is comparable to earthquake mortality.
Jonkman & Kelman, 20051
Examination of the causes and circumstances of 247 flood disaster deaths across 13 flood events in Europe and the US
Two-thirds of deaths were due to drowning. Being male and engaging in high risk behavior during flood events were also linked to increased flood mortality. Findings with respect to age-related vulnerability were inconsistent. Authors call for standardization of data collection methodologies across regions and flood types to improve policies and strategies to reduce flood-related death.
Jonkman, 20053
Review of mortality from river floods, flash floods and drainage problems from 1975 to 2002 using the CRED Database
Of all disaster types, floods affect the most people; there were1816 events with 175,000 deaths and 2.2 billion affected from 1975-2002. The deadliest freshwater flood events were Venezuela (1999, 30,000 deaths), Afghanistan (1998, 6,345 deaths), and China (1980, 6,200 deaths). Flash floods resulted in the highest average mortality per event. Average mortality (# fatalities / # affected) was constant across continents while impact magnitude (#s of dead and affected) varied between continents.
Tarhule, 200532
Review of newspaper accounts of rainfall and rain-induced flooding in the Sahel savanna zone of Niger from 1970 to 2000
53 articles reported 79 damaging rainfall and flood events in 47 communities in the Sahel of Niger during the study period; floods destroyed 5,580 houses, killed 18, left 27,289 homeless, and caused over $4 million in damages. Sahel residents attribute floods to five major causes: hydrologic, extreme/unseasonable rainfall, location of affected area, inadequate drainage, and poor construction; cumulative rainfall in the days preceding a heavy rain event is an important predictor of flooding.
Lastoria, 200658
Review of flood deaths and socioeconomic impacts in Italy,1951 to 2003
During study period, ~50% of the flood events resulted in an average of 5 deaths, and about ~10% had >100 deaths. Investigators recommend creating an integrated database to collect more information about flood events in Europe.
Llewellyn, 200644
Review mortality, injury, illness and infectious disease associated with major, recent floods events
In the US, as much as 90% of natural disaster damage (excluding droughts) is caused by floods which cost $3.7 billion annually from 1988 to 1997. There were an average of 110 flood deaths/yr from Between 1940 to 1999, mostly in flash floods and automobile related. Most flood related injuries are mild, and predominantly consist of cuts, lacerations, puncture wounds, and strains/sprains to extremities.
Ahern, 200530
Review of studies of global flood events and assessment of gaps in knowledge relative to reducing public health impact of flooding
Review of 212 epidemiologic studies with detailed findings reported for 36 studies. The majority of flood deaths were due to drowning; deaths due were diarrhea inconclusive though there is some evidence to support increased risk of fecal-oral disease, vector-borne disease and rodent-borne disease. There is a lack of data on frequency of non-fatal flood injury.
Ashley & Ashley, 20088
Review of flood fatalities in the United States from 1959 to 2005
4,585 fatalities over a 47 year period were reported (97.6 deaths/year). No significant increase in flood mortality over time was observed. The majority of flood-related deaths were in flash floods and were motor-vehicle related (63%). Increased risk of flood-related death was observed in individuals ages 10-29 and >60 years.
Jonkman & Vrijling, 200849
Review of mortality attributed to different flood types and presentation of new method for estimating flood related deaths in low-lying areas
Reports on 1883 coastal flood events between 1975 and 2002 resulting in 176,874 deaths and 2.27 billion affected. Mortality by event type was reported as follows: 70 from drainage floods, 392 from river floods and 234 from flash floods. Flood mortality was affected by severity of flood impacts and warning and evacuation. Primary determinants of flood-related death include: lack of warning, inability to reach shelter, building collapse, water depth, rapid rise in water level, water flow velocity, children, and elderly. Applies a new method for estimating loss of life due to floods based on flood characteristics and numbers exposed and mortality among exposed are introduced.
FitzGerald, 201050
Review of flood fatalities in Australia from 1997 to 2008
Estimated 73 flood-related deaths reported from newspapers and historic accounts from 1997 to 2008 in Australia. Most fatalities occurred in the summer months. Drowning deaths were more likely among individuals between the 10-29 and >70 years of age. No difference decline in deaths over time reported. 49% of deaths were motor-vehicle related and 27% were attributed to high risk behavior.
Results
Historical Event Review
Overall, an average of 131 (range 35-287) floods affected human populations annually with the majority (81%) occurred during or after the 1990s. Part of this increase can be explained by improved reporting and by the DFO reporting beginning in 1985. There was great variation in the number of events reported annually between EM-DAT (range 35-213) and DFO (42-235) (Figure 2). While the frequency of flood events increased gradually over time, their impacts on human populations in terms of mortality and affected populations varied greatly between years and were often concentrated around large-scale events (Figure 3). Using the WHO regions the Americas (AMRO) and Western Pacific (WPRO) regions experienced the most flooding events while the fewest were reported in Europe (EURO) (Figure 4). Deaths were overwhelmingly concentrated in South East Asia (SEARO), which accounted for 69% of global flood mortality, though both the Americas (AMRO) and Western Pacific (WPRO) had significant minorities of flood fatalities. The great majority of the flood affected population was in WPRO (59%) and SEARO (35%) of the global total. Overall, the human impacts of floods in Europe, Africa, and the Eastern Mediterranean regions were limited; together the regions accounted for no more than 8% of flood deaths and 4% flood affected populations, respectively. The overall impact of flooding on human populations is summarized in Table 3.
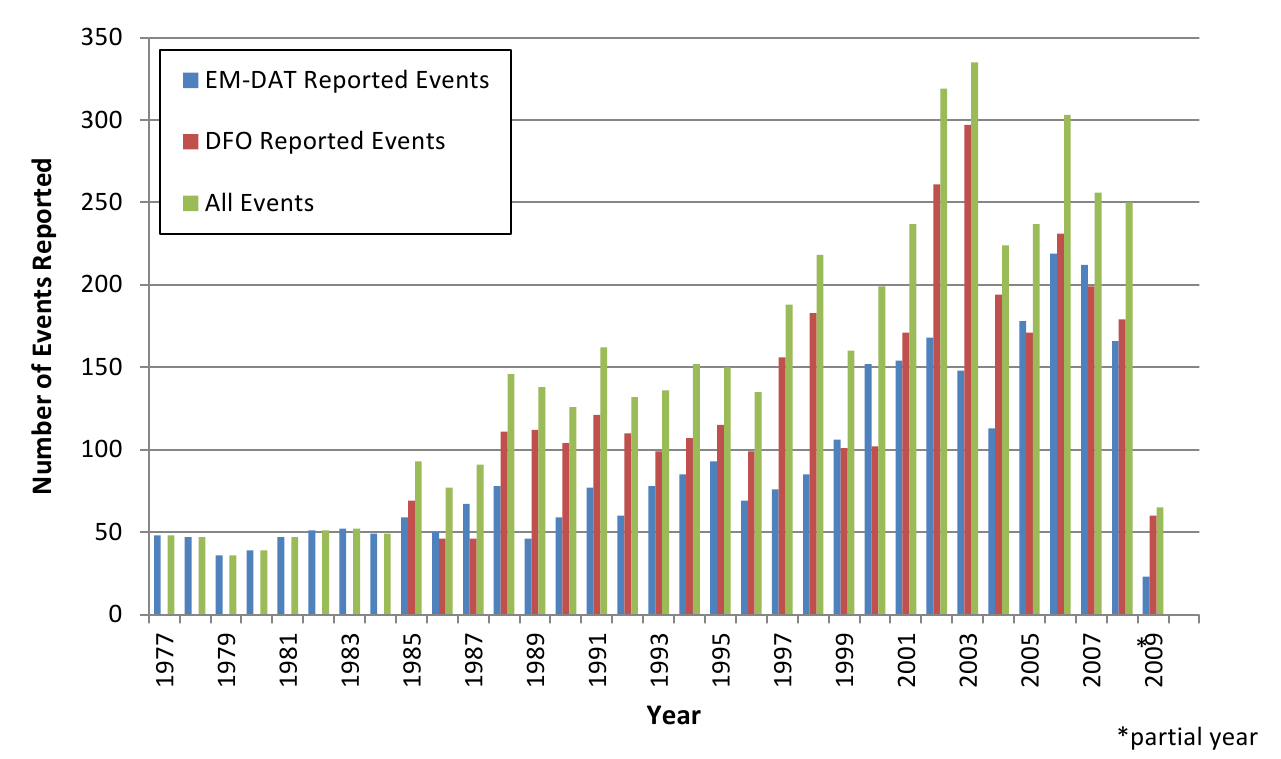
Fig. 2: Reporting of flood events by source and year
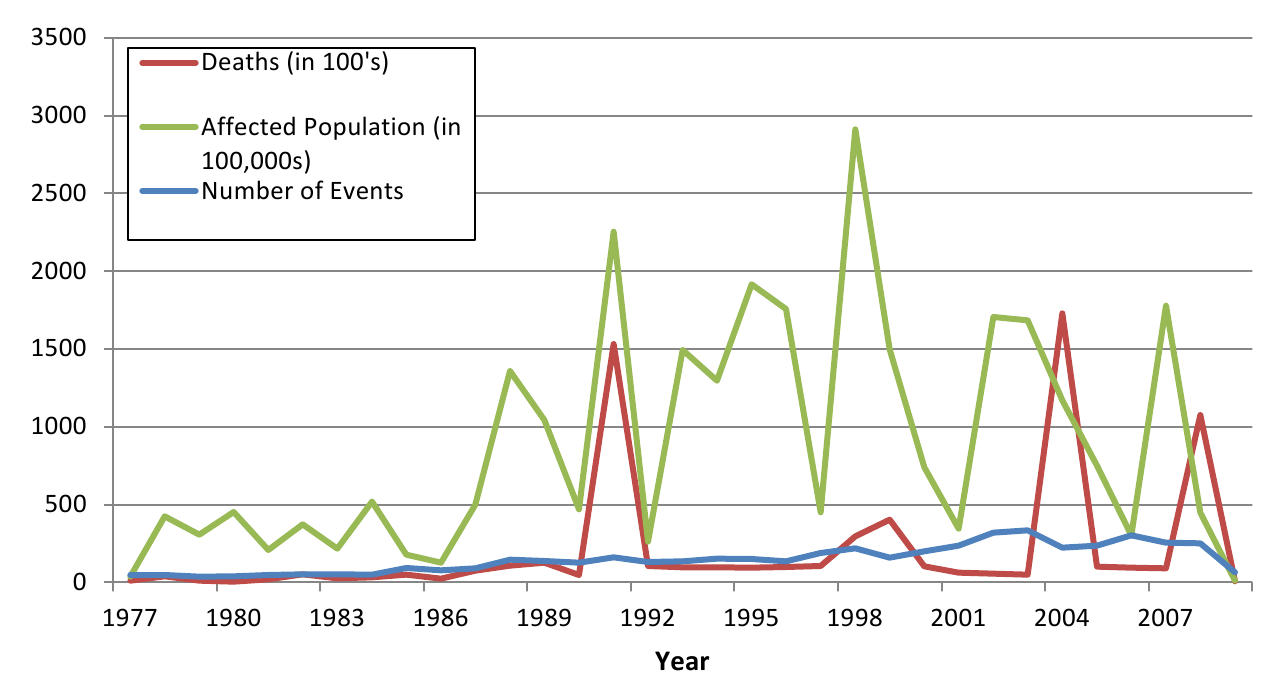
Fig. 3: Flood events affecting human populations by year
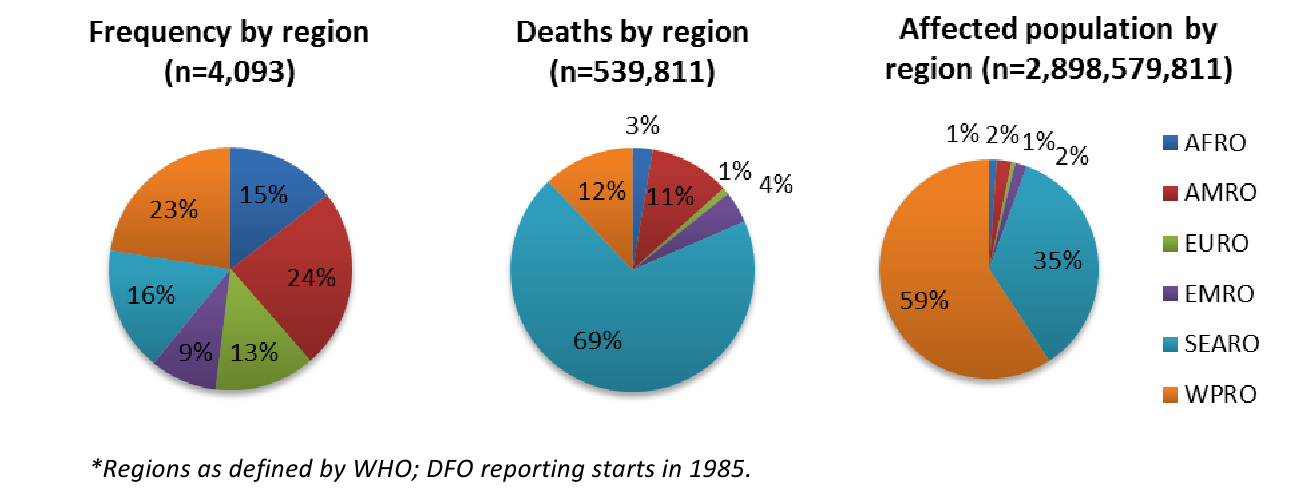
Fig. 4: Regional summary of flood events and their effects on human populations, 1980-2009*
*Figures are based on the highest reported number of deaths or injuries in an event. Deaths were reported in 4,093 events. Homeless, injured, and total affected populations are reported only by EM-DAT, thus ranges are not presented for overall impact estimates.
Reported Overall Impact of Flooding Events
Human Consequence
# of Events
Best Estimate
Range
Deaths
4,093
539,811
510,941-568,680
Injuries
401
362,122
—
Homeless
611
4,580,522
—
Total Affected
2,632
2,898,579,881
—
Event Summary Statistics
Human Consequence
# of Events
Median
Mean
Range
Deaths, all events
3,960
96.8%
9
135
0-138,000
Reported by EM-DAT
2,646
64.6%
10
74
0-30,000
Reported by DFO
2,732
66.75%
11
166
0-138,000
Events with deaths
2,673
65.3%
11
146
1-138,000
Reported by EM-DAT
2,146
52.4%
10
87
1-30,000
Reported by DFO
1,289
31.5%
13
178
1-138,000
Injured, all events
401
9.8%
12.5
904
0-249,378
Homeless, all events
611
14.9%
15
7,506
0-2,951,315
Total Affected, all events
2,632
64.3%
6,000
1,071,829
0-238,973,000
Affected Population. An estimated 2.8 billion people were reported to be affected by flood events between 1980 and 2009, including nearly 4.6 million rendered homeless. However, these figures likely substantially underestimate the true impact of floods on human populations because estimates of the total affected population and the homeless population were reported in only 64.3% (n=2,632) and 14.9% (n=611) of events, respectively. The distribution of the number affected was highly skewed with mean and median affected populations of 1,071,829 and 6,000 per event, respectively, which indicates that the median affected population may better reflect the impact of a typical flood event.
Mortality and Injury. When mortality data from the two sources were combined, deaths were reported in 96.8% (n=3,960) of floods since 1980. This figure excludes 13.9% of floods where no information on mortality was reported; if no deaths are presumed and these events are included, deaths occurred in 65.3% (n=2,673) of floods. 539,811 deaths (range: 510,941-568,680) resulting from flood events were reported. For floods where mortality was reported, there was a median of 9 (mean=135; range 0-138,000) deaths per event when using the highest reported death toll. Mortality exceeded 10,000 in only 4 events and 100,000 in two. The two deadliest events occurred in Bangladesh (138,000 deaths in 1991) and Myanmar (100,000 deaths in 2008). Injuries were reported in 401 (9.8%) events, where a total of 361,974 injuries were documented. In events where injuries were reported, there was a median of 12.5 (mean=904: range 1-249,378) per flood event. To estimate the total number of injuries due to flood events, it was presumed that injuries would occur in events where deaths were reported. There were 2,673 floods with fatalities but only 401 (9.8%) with injuries reported. When the median and mean for injuries were applied to the remaining 3,077 events, it was estimated that between 38,463 and 2,717,681 additional unreported flood related injuries may have occurred between 1980 and 2009.
Bivariate associations between country-level characteristics and flood-related mortality from 1980 through 2009 are presented in Table 4. Findings suggests that the proportion of events with high mortality (>50 deaths) have decreased over time. Income level was also significantly associated with flood mortality, where for both low and lower-middle income countries, a greater proportion of events fell in the medium and high death categories as compared to higher income countries. Higher mortality events were concentrated in the South East Asian and Western Pacific regions.
*GINI coefficient scores for income distribution range from 0 to 100 with 0 representing a perfect equality and 100 perfect inequality.59 ** Magnitude is a composite score of flood severity created by DFO that includes flood duration and affected area size, with the following categories: low magnitude,6.0. Flood magnitude is only available for events from 1985 onward.
Characteristic
No deaths (n=706)
1-9 deaths (n=1,378)
10-49 deaths (n=1,223)
>50 deaths (n=785)
P-value
Decade, N (%)
1980
121 (17%)
149 (11%)
212 (17%)
205 (26%)
<.001
1990
191 (27%)
418 (30%)
437 (35%)
317 (40%)
2000
394 (55%)
811 (58)
574 (45%)
263 (33%)
World Bank Development Level, N (%)
Low income
172(24%)
263 (20%)
370 (30%)
365 (45%)
<.001
Lower Middle income
164 (23%)
395 (29%)
465 (38%)
328 (41%)
Upper-middle income
142 (20%)
276 (21%)
219 (18%)
79 (10%)
High Income
227 (32%)
408 (30%)
176 (14%)
33 (4%)
World Health Organization Region, N (%)
Africa
139 (20%)
228 (17%)
157 (13%)
73 (8%)
<.001
Americas
182 (26%)
387 (29%)
293 (24%)
122(15%)
Eastern Mediterranean
46 (6%)
107 (8%)
147 (12%)
74 (9%)
European
171 (23%)
246 (18%)
104 (9%)
26 (3%)
South East Asian
47 (7%)
137 (10%)
229 (19%)
264 (33%)
Western Pacific
124 (18%)
238 (18%)
299 (24%)
262 (32%)
Gross Domestic Product, per capita, mean (SD), (n=4,089)
14,827 (18,077)
14,330 (17,710)
1,457(12,563)
3,325(6,518)
<.001
GINI,* mean (SD), (n=3,830)
40.2 (7.6)
41.0 (7.7)
41.7 (7.9)
41.3 (7.1)
0.004
Magnitude,** mean (SD), (n=2911)
4.8 (1.2)
4.9 (1.1)
5.3 (1.0)
6.0 (1.1)
<.001
Findings from the adjusted analyses (Table 5) modeling the relative risk of flood related mortality show that all predictors were significantly associated with flood mortality. The relative risk of medium- and high-level mortality events compared to events with no deaths significantly decreased over time. There was also a significant decreased relative risk of mortality in excess of 50 deaths for events in higher income countries compared with lower income country events. Additionally, as magnitude of a flood increased, so did the risk of having high mortality when adjusting for all other predictors. A flood rated as high magnitude as compared to one with low magnitude was associated with an increased relative risk of having high mortality as compared to no mortality (RR=13.20, 95% CI 8.25, 22.11). Caution should be taken when interpreting such findings, however, as magnitude estimates were missing for a large proportion of events, and missing magnitude was associated with the outcome in this study. Regional differences in reported mortality were also supported by the analysis. Higher mortality events were concentrated in the South East Asian and Western Pacific regions, compared to events occurring in the Americas (Southeast Asia RR=3.35, 95 CI: 2.21, 5.72; Western Pacific RR=2.38, 95 CI: 1.62, 3.34).
* Reference is “no deaths” for all categories (n=743) **see Table 4 notes for definition of flood magnitude
Characteristic
1-9 deaths COR (95% CI)
P- value
10-49 deaths COR (95% CI)
P- value
>50 deaths COR (95% CI)
P-value
Decade
1980
Reference
Reference
Reference
1990
1.09 (0.87, 1.37)
.426
1.64 (1.29-2.07)
<.001
2.61 (1.99-3.42)
<.001
2000
0.86 (0.64, 1.15)
.313
1.85 (1.39-2.46)
<.001
4,46 (3.22-6.18)
<.001
World Health Organization Region
AMRO
Reference
Reference
Reference
AFRO
1.09 (0.76-1.55)
.0.62
0.58 (0.41-0.84)
.005
0.35 (0.22-0.56)
<.001
EURO
0.72 (0.54-0.96)
.024
0.45 (0.32-0.63)
<.001
0.31 (0.18-0.52)
<.001
EMRO
1.31 (0.83-2.06)
.240
1.49 (0.95-2.33)
.082
1.31 (0.78-2.21)
.3120
WPRO
0.80(0.59-1.09)
.165
1.22 (0.88-1.67)
.217
2.38(1.62-3.49)
<.001
SEARO
1.61(1.04-2.49)
.032
2.15 (1.40-3.29)
<.001
3.35 (2.21-5.72)
<.001
World Bank Income Level
Low
Reference
Reference
Reference
Lower middle
152 (1.06-1.92)
0.007
0.99 (0.74-1.34)
.992
0.59 (0.43-0.82)
0.002
Upper middle
1.56 (1.05-2.13)
0.014
0.90 (0.62-1.29)
.576
0.39 (0.24-0.61)
<.001
High
1.16 (0.86-1.71)
0.400
0.29 (0.20-0.42)
<.001
0.05 (0.03-0.08)
<.001
Flood Magnitude Category**
Low
Reference
Reference
Reference
Medium Low
1.03 (0.74, 1.44)
.859
1.47 (1.03, 2.10)
.035
1.52 (.95, 2.43)
.0878
Medium High
1.19 (0.85, 1.69)
.310
2.19 (1.50, 3.16)
<.001
3.87 (2.45, 6.10)
<.001
High
0.91 (0.62, 1.35)
.664
2.37 (1.58, 3.55)
<.001
13.20 (8.25, 21.11)
<.001
Missing
0.19 (0.15, 0.25)
<.001
0.32 (0.24, 0.43)
<.001
0.59 (0.40, 0.87)
.007
Systematic Literature Review
Mortality. Fourteen of the reviewed articles reported mortality data including ten that provided information on direct or indirect causes of mortality and/or risk factors for flood-related deaths (Table 6) 15,16,17,18,19,20,21,22,23,24,25,26,27,28 . Most articles provided some information about the distribution of deaths across population subgroups (i.e. gender, age) and/or an individual’s location at the time of the event; seven of these ten articles reported on floods in the United States. Nearly all articles reporting cause of death cited drowning as the most frequent cause of death 1,15,18,19,20,22,29 . Cumulatively, drowning accounted for 75% of deaths; other causes of death included falls, electrocution, heart attack, hypothermia, trauma, snake bites, and carbon monoxide poisoning.
*excludes 1150 deaths from diarrhea and other possibly deaths reported during the 4 month period surrounding the event
Article
Country & Year
Flood Related Deaths
By Cause
By Sex
By Age
Vehicle Related
Total
Direct
Indirect
Drowning
Other Causes
Males
Female
Duclos,1991 16
France, 1988
9
9 (100%)
0 (0%)
9 (100%)
0 (0%)
Not reported
Not reported
Not reported
CDC, 199318
USA, 1993
27
21 (78%)
6 (22%)
21 (78%)
2 (7%) electrocution2 (7%) vehicle accident 2 (7%) cardiac arrest
18 (67%)
9 (33%)
Average age = 38(range 9-88)
13 (48%)
CDC,199419
USA, 1994
28
27 (96%)
1 (4%)
27 (96%)
1 (4%) other
20 (71%)
8 (29%)
Average age = 31(range 2-84)
20 (71%)
Staes,199420
USA, 1992
23
22 (96%)
1 (4%)
22 (96%)
1 (4%) carbon monoxide poisoning
10 (43%)
13 (57%)
16 (70%) ≥ 16 yrs
20 (87%)
Grigg, 199928
USA, 1997
5
5 (100%)
0 (0%)
Not reported
5 (100%)
0 (0%)
All adults
Not reported
CDC, 200021
USA, 1998
31
29 (94%)
2 (6%)
24 (77%)
3 (10%) trauma1 (3%) hypothermia1 (3%) cardiac arrest2 (6%) other
20 (65%)
11 (35%)
Median age = 38(range 2-83)
22 (71%)
Rashid, 200022
Bangladesh, 1998
50*
Not reported
24 (48%)
21 (42%) electrocution 5 (10%) snake bites
Not reported
Children accounted for 92% (22/24) of drownings
Not reported
Yale, 200323
USA, 1999
22
22 (100%)
0 (0%)
22 (100%)
0 (0%)
17 (77%)
5 (23%)
21 (95%) adults
22 (100%)
Pradhan, 200724
Nepal, 1992
302
Not reported
Not reported
126 (42%)
176 (58%)
164 (54%) children138 (46%) adults
Not reported
Jonkman et al., 200929
USA, 2005
853
Not reported
Not reported
432 (51%)
421 (49%)
705 (85%) older than 51 yrs, 60% over 65 yrs
Not reported
Totals
447
135 (93%)
10 (7%)
125 (75%)
42 (25%)
639 (50%)
643 (50%)
—
97 (74%)
All studies in the United States examined mortality related to motor vehicles and found an increased risk of mortality among individuals in motor vehicles during the event, of all deaths 74% were motor vehicle related 17,18,19,20 . This compares to a motor vehicle related death rate of 63% in a recent review of US flood fatalities between 1959 and 2005 7. Higher proportions of deaths among males (64%) were consistently observed in the United States, except for Puerto Rico where 57% (13/23) of flood related fatalities were female and hurricane Katrina where deaths evenly divided between the sexes (51% male, 49% female) 16,18,19,20,28 . In contrast, the one article describing flood mortality in the less developed country of Nepal found that females of all age groups faced increased mortality risk and 58% of all deaths were women 23 Other factors found to be associated with flood-related mortality included storm course/time storm hit landfall 19,22 summer months 17,30, low socioeconomic status 23, poor housing construction 16,23,24,31 and timing of warning messages 19,22.
Injury and Displacement. Injury or morbidity data were reported in ten of the 18 included articles, of which nine provided information on injury type and/or risk factors 15,16,24,32,33,34,35,36,54 . The majority of flood-related injuries are minor. The two studies that captured a large number of injuries, both in the United States, found that musculoskeletal injuries were most common (46% and 34%), followed by lacerations (21% and 24%). Other flood-related injuries included abrasions and contusions, motor vehicle related injuries, and falls 33,34,54. In less developed settings, increased incidence of snake bites and fires were also cited as causes of injury or death 2,36. Among care seekers in flood-affected areas of Bangladesh 5.1% of wounds were infected. Another review suggested that the proportion of survivors requiring medical attention is less than 2% 2. A distribution of injuries across population subgroups was reported by only one study in India which found that injuries were more common in males (67% vs. 33%), that the 11-40 year age group comprised 68% of the injured, and that those age 50 and above accounted for 18% of flood deaths 34. Seven articles reported displacement or evacuation figures however none described risk factors associated with flood-related displacement 15,17,21,24,25,35,37 .
Discussion
Main findings
In the past 30 years approximately 2.8 billion people have been affected by floods with 4.5 million left homeless, at approximately 540,000 deaths and 360,000 injuries, excluding an estimated 38,000 to 2.7 million injuries that went unrecorded. While the mortality estimate presented in this study is consistent with the range of estimates presented in other studies 1,38, approximations of numbers injured and displaced are likely gross underestimates of the true values given the infrequency with which figures are reported. Floods events with high levels of mortality are relatively rare: despite their increasing frequency, there were only four events with >10,000 deaths and 58 events with >1000 deaths between 1977 and 2009. A slight decrease in the average number of fatalities per event was observed which is in keeping with broader natural disaster trends that show an increase in the size of the affected population and a decrease in the average number of deaths per event 4. Higher numbers of fatalities were reported in flash floods than river floods, however, river floods affected larger populations and land areas 3,7. Lower mortality rates in river floods can mostly be attributed to their slower onset allowing for longer time for warning and evacuation 3,39. The widespread use of effective early warning methods for hydrological events has likely contributed declining flood mortality.
Findings from the historical event review are consistent with previous observations that flood mortality varies by region, economic development level, and the severity of the event 12,40. The majority of flood-related deaths are concentrated in less developed and heavily populated countries, with Southeast Asia and the Western Pacific region experiencing the highest risk of flood-related deaths. Flood mortality rates are relatively similar across continents, but Asian floods kill and affect more people because they affect substantially larger areas with larger populations 3. At the country level, lower GDP per capita was linked to higher mortality, which is in keeping with the established relationship between poverty and increased disaster risk 41. Human and social vulnerabilities and inequalities, urbanization, population density, terrain and geo-physical characteristics and variation in the frequency and precipitating causes of floods by region are also factors that contribute flood risk levels 3,6,12,42 . Temporal changes and development trends have also contributed to changing influences of some of these factors over time 42. Economic development increases the risk of disaster-related economic losses however improved emergency preparedness, response, and coping capacity may reduce disaster vulnerability 3. That countries with greater resources are able to better predict and respond to impending flood events suggests that building systems and capacity to detect and respond to floods in less developed countries should be a priority 40.
Causes of and risks for flood-related mortality and injury identified in the systematic literature review are consistent with previous reviews on the human impact of flooding 1,29,43,44 . In comparison, a recent review of 13 flood events in Europe and the United States found that 68% of deaths were due to drowning, 12% trauma, 6% heart attack, 4% fire, 3% electrocution, 1% carbon monoxide poisoning, and 7% other/unknown 1. Studies reporting the gender breakdown for flood-related deaths, most of which are accounts of flood events in the United States, consistently show a greater proportion of males as compared with female deaths. These observations are aligned with previous studies, including a review of flood events in Europe and the US which estimated that males account for 70% of flood related deaths 1,44,45,46 . While limited to only a few countries, these findings suggest there may be increased mortality risk for males in more developed settings and for females in less developed countries 23,47 . An increased risk of death in younger and older populations was also observed which is consistent with broader natural disaster mortality trends 7,45,46,48,49 . In Nepal, children had the highest crude mortality rates of all age groups and were nearly twice as likely to die in the flood as their same-sex parent 23. However, recent reviews of age-specific risk for flood mortality have been inconclusive because attempts to aggregate data were hampered by high proportions of deaths where age is unreported 1. While the prevailing notion is that women and children are more vulnerable in disasters 50, there is a paucity of research in less developed countries where the majority of flood deaths occur. Future research on the human impacts of floods should focus on these less developed settings, most notably Asia where flood deaths are concentrated, with the aim of identifying the most at-risk and vulnerable population sub-groups to better target early warning and preparedness efforts.
The ecological nature of the study of event characteristics did not allow for an examination of specific factors within a country or region that may be associated with increased mortality following a flood event. Population density in coastal regions, which are particularly vulnerable to flooding, is twice of the world’s average population density and many of the world’s coasts are becoming increasingly urbanized 51. Currently, 50.6% of the world’s population lives in urban settings; by 2050 this figure is projected to increase to 70% with the majority of urbanization occurring in less developed regions of Asia and Africa 52. Unabated urbanization and land use changes, high concentrations of poor and marginalized populations, and a lack of regulations and preparedness efforts are factors that will likely contribute to an increasing impact of floods in the future 38. From the natural hazard perspective, climate change is also likely to contribute to future increases in flooding. Increased frequency of intense rainfall, as a result of higher temperatures and intensified convection will likely lead to a rise in extreme rainfall events, more flash floods and urban flooding due to excessive storm water. Additionally, sea level rise and increasing storm frequency will lead to additional storm surges in coastal areas while seasonal changes, notably warmer winters, will contribute more broadly to increased precipitation and flood risk 38. Together, changes in socioeconomic, demographic, physical terrain features and climatologic factors suggests that floods will become more frequent and have greater effects on human populations in the coming decades.
Given that flood losses are likely to increase in future years, increased attention to flood prevention and mitigation strategies is necessary. To date, early warning systems have been an effective mechanism for reducing the impact of floods 38, however, they are not ubiquitous and should be prioritized in less developed countries with large at-risk populations and high frequencies of flooding. It is important that messaging and targeted communication strategies accompany early warnings so that the population understands the impending risk and can respond appropriately. Many flood fatalities are associated with risk-taking behaviors, thus messages to avoid entering flood waters and to curtail risky activities in all stages of the event may be successful in reducing flood fatalities 1. Additional, improved land use planning and regulation of development can mitigate flood impacts. Studies on the relationships between flood losses, natural hazard characteristics, and societal and demographic vulnerability factors can aid in informing and prioritizing flood prevention and mitigation strategies. Finally, comparisons of the effectiveness of different policies and mitigation strategies can inform future strategy and policy actions and ensure they are appropriate in specific contexts.
Limitations
The effects of flood events are the subject of gross approximations and aggregations that have a great deal of imprecision. The availability and quality of data has likely increased and improved over time and the use multiple data sources increased reporting. However, in many events deaths are unknown or unrecorded; for other outcomes such as injured and affected, reporting frequency is even lower which likely contributes to a substantial underestimation of the impacts of flood events on human populations. While available data is sufficient for a cursory analysis of global flood impacts and trends, improved reporting of flood outcomes, including the development of national systems capable of more accurately reporting mortality and injury would be beneficial. Regarding the measures used in this study, our multivariable model included a broad classification of income level according to the World Bank, as opposed to GDP. While we believe GDP to be a more precise measure of wealth, it was nonetheless excluded in the analysis because we did not obtain GDP estimates that were time specific to each event. Inconsistencies and errors were common in data files from different sources, and in some cases inclusion criteria were not ideal for the purposes of this review, which created a challenge in reconciling event lists. For example, the 2004 Asian tsunami was classified as a flood by Dartmouth but not by EM-DAT; this event was ultimately removed from the data set, however, it represented the highest mortality event in the study period, which has potentially important implications for analysis. Consistent definitions and categorization of events across sources such as that initiated by EM-DAT in 2007 would be useful for streamlining future analysis and comparing the impacts of different types of flood events. Other principal limitations of the literature review are 1) that an in-depth quality analysis of all reviewed articles was not undertaken, and 2) the fact that only English language publications were included which likely contributed to incomplete coverage of studies published in other languages originating from low and middle income countries.
Conclusions
Interpretation of flood fatality data is challenging given the occurrence of occasional extreme events, temporal trends and the completeness and accuracy of available data. The continuing evolution of socio-demographic factors such as population growth, urbanization, land use change, and disaster warning systems and response capacities also influences trends. Between 1980 and 2009 there were an estimated 539,811 deaths (range 510,941 -568,584) and 361,974 injuries attributed to floods; a total of nearly 2.8 billion people were affected by floods during this timeframe. The primary cause of flood-related mortality was drowning. In developed countries being in a motor-vehicle at the time of a flood event and male gender were associated with increased mortality risk. Female gender may be linked to higher mortality risk in low-income countries. Both older and younger population sub-groups also face an increased mortality risk. The impact of floods on humans in terms of mortality, injury, and affected populations, presented here is a minimum estimate because information for many flood events is either unknown or unreported.
Data from the past quarter of a century suggest that floods have exacted a significant toll on the human population when compared to other natural disasters, particularly in terms of the size of affected populations. However, human vulnerability to floods is increasing, in large part due to population growth, urbanization, land use change, and climatological factors associated with an increase in extreme rainfall events. In the future, the frequency and impact of floods on human populations can be expected to increase. Additional attention to preparedness and mitigation strategies, particularly in less developed countries, where the majority of floods occur, and in Asia, a region disproportionately affected by floods, can lessen the impact of future flood events.
Competing Interest
The authors have declared that no competing interests exist.
Correspondence
Shannon Doocy, Johns Hopkins Bloomberg School of Public Health, 615 N. Wolfe St, Suite E8132, Baltimore, MD 21230. Tel: 410-502-2628. Fax: 410-614-1419. Email: [email protected].
Introduction
Earthquakes were responsible for an estimated 1.87 million deaths in the 20th century with an average of 2,052 fatalities per event affecting humans between 1990 and 2010 1,2. The magnitude 8.9 Japan earthquake and resulting tsunami in March 2011 was responsible for more than 28,000 deaths; in comparison, the smaller magnitude 7.0 earthquake occurring in Haiti in January 2010 resulted in an estimated 222,500 fatalities 2. In recent history, the Pacific Rim is the most affected by seismic activity, with 81% of the world’s largest earthquakes occurring in this region 3.
Earthquakes result from sudden energy releases in the earth’s crust, which create seismic waves that result in ground shaking. Earthquakes are usually caused by slippage on a fault due to built up friction between tectonic plates but can also be caused by volcanic eruptions or manmade explosions 4. Millions of earthquakes occur each year, though only a small proportion is strong enough to be felt and even fewer cause damage. Earthquakes occur at focal depths of 700 km to just under the earth’s surface, and the strength of shaking diminishes with increasing distance from the earthquake’s source 5. Earthquake magnitude measures the energy released by an earthquake and is described by the moment magnitude scale, which is a logarithmic scale, so that a magnitude 5 earthquake is about 10 times less powerful than a 6, and 100 times less that a magnitude 7. A magnitude 2.5 earthquake is not generally felt by humans, whereas earthquakes with magnitude >7.0 may cause widespread destruction 6. Earthquake impact is assessed by the Modified Mercalli Intensity Scale, which describes the severity of damages from the event on a scale from I to XII, with I being no damage and XII being complete destruction with no surviving structures. Building design, geography and development indicators are important factors in earthquake vulnerability. The objectives of this review were to describe the impact of earthquakes on the human population, in terms of mortality, injury, and displacement and to identify country and event characteristics factors associated with these outcomes. This is one of five reviews on the human impacts of natural disasters, the others being volcanoes, floods, tsunamis, and cyclones.
Methods
The impact of earthquakes events was summarized using two methods, a historical review of earthquake events, and a systematic literature review for publications relating to the human impacts of earthquakes with a focus on mortality, injury, and displacement.
Historical Event Review
A historical database of significant earthquakes between 1980 and 2009 was created. Four publically available data sources were used to create the most complete possible listing of events, allow for inclusion of both human and geophysical factors, and enable cross checking. The two primary sources were the Centre for Research on the Epidemiology of Disasters International Disaster Database (CRED EM-DAT)7 and the National Oceanic and Atmospheric Administration’s National Geophysical Data Center (NOAA-NGDC) Significant Earthquakes Database 8. Earthquakes included in EM-DAT met one or more of the following criteria: ≥10 deaths; ≥ 100 affected; declaration of a state of emergency; or a call for international assistance. Earthquakes included in the NOAA-NGDC database met one of the following criteria: ≥10 deaths; moderate damage (US$ 1 million or more); magnitude ≥7.5; Modified Mercalli Intensity X or greater; or the earthquake generated a tsunami. All events reported by EM-DAT were retained (n=706), and zeroes were converted to missing values for injury, homeless, and affected measures; for deaths and total affected, zeroes were converted to missing values only when no other information was reported. Earthquakes from the NOAA-NGDC database were retained if one of the following criteria were satisfied: magnitude ≥5.5; ≥10 deaths; or ≥100 injured (n=579).
Two additional sources, the United States Geological Survey (USGS) Earthquake Hazards Program Global Database 9 and the Northern California Earthquake Data Center (NCEDC)10 were used to collect information on specific earthquake characteristics (coordinates, magnitude, focal depth, additional information when available). When available data from these sources were added for events reported by EM-DAT and/or NOAA-NGDC; new events were added only when mortality was reported by USGS. Earthquakes occurring in uninhabited areas that did not cause injury or death were removed. The final list comprised 953 earthquakes occurring between 1980 and 2009; information on mortality, injury or displacement was reported by one or more sources in 738 events. See https://www.jhsph.edu/refugee/publications_tools/index.html for the database of earthquake events.
The following outcome categories were used to assess risk factors for earthquake-related mortality: no deaths (0 deaths); low (1-9 deaths); medium (10-99 deaths); and high (≥100 deaths). Bivariate tests for associations between mortality and the following characteristics were performed using χ2 (categorical measures) and ANOVA (continuous measures): decade, World Health Organization (WHO) region, World Bank income level, gross domestic product (GDP), GINI (measure of income inequality), focal depth, and magnitude. All covariates were significantly associated with earthquake mortality in the univariate analysis and were subsequently included in a multinomial logistic regression model to assess the adjusted odds of mortality at a given level as compared to events with no deaths. Analyses were performed using Stata Statistical Software, Version 11.0 11
Systematic Literature Review
Key word searches in MEDLINE (Ovid Technologies, humans), EMBASE (Elsevier, B.V., humans), SCOPUS (Elsevier B.V., humans), and Web of Knowledge, Web of Science (Thomson Reuters) were performed to identify articles published in July 2007 or earlier that described natural hazards and their impact on human populations. Following the systematic review, a hand search was conducted to identify relevant articles published after the initial search thru October 2012. One search was done for all the five natural hazards described in this set of papers. This paper describes the results for earthquakes. The systematic review is reported according to the PRISMA guidelines. The key word search included natural hazard(s), natural disaster(s), volcano(s), volcanic, volcanic eruption, seismic event, earthquake(s), cyclone(s), typhoon(s), hurricane(s), tropical storm(s), flood(s), flooding, mudslide(s), tsunami(s), and tidal wave(s). Key words included for impact on human populations were affected, damage(d), injury, injuries, injured, displaced, displacement, refugees, homeless, wounded, wound(s), death(s), mortality, casualty, casualties, killed, died, fatality, fatalities in either the title, abstract or as a subject heading/key word. The search resulted in 2,747 articles from MEDLINE, 3,763 articles from EMBASE, 5,219 articles from SCOPUS, and 2,285 articles from ISI Web of Knowledge. Results from the four databases were combined and duplicates excluded to yield a total of 9,958 articles.
Title screening was performed to identify articles that were unrelated to natural disasters or human populations. Each title was screened by two reviewers and was retained if either or both reviewers established that inclusion criteria were met. Percent agreement was assessed across reviewers, and title screening began after 80% agreement was achieved. A total of 4,873 articles were retained for abstract review. During abstract screening articles that met one or more of the following criteria were excluded: language other than English; editorial or opinion letter without research-based findings; related to environmental vulnerability or hazard impact but not human populations; individual case report/study; focus on impact/perceptions of responders; and not related to human or environmental vulnerabilities or impacts of hazards. Each abstract was screened by two reviewers and was retained if either or both reviewers established that inclusion criteria were met. Again, 80% agreement between reviewers was achieved prior to screening. During the abstract review, included abstracts were coded for event type, timeframe, region, subject of focus, and vulnerable population focus. A total of 3,687 articles were retained for full article review. Articles discussing the impacts of natural disasters on human populations in terms of mortality, injury, and displacement were prioritized for review. From this general review of 395 articles specific to earthquake events meeting the aforementioned subject focus criteria were identified for full review. Upon full review, 150 articles were retained 143 that underwent standard data abstraction; seven that were identified as review articles (Figure 1). Articles that focused on risk factors for specific types of injuries (primarily crush injuries and renal failure) or deaths were excluded because they did not provide insight on overall risk factors for mortality or injury. In total, 70 articles relating to risk factors for mortality, injury or displacement were identified; summaries of articles with primary data (n=60) and review articles (n=10) are presented in Tables 1 and 2, respectively.

Fig. 1: Overview of the systematic literature review process for earthquakes
* Displacement is excluded from the table because primary data on displacement in earthquake events was collected in only six studies: Daley, 2001; Parasuraman, 1995; Roces, 2002, Chun 2010; Kun 2010; and Milch, 2010. ** Additional articles identified in the hand search conducted through October, 2012.
Publication
Event(s)
Magnitude
Study Summary
Mortality
Injury
Armenian, 199213
Dec 7 1988, Armenia
6.9
Case-control study of injuries from the 1988 earthquake in Armenia
NR
x
Pointer, 199214
Oct 17 1989, Loma Prieta, California
7.1
Retrospective review of medical records after the Loma Prieta earthquake
x
x
Roces, 199215
July 16 1990, Philippines
7.7
Unmatched case-control study of those injured/dead from earthquake vs. those uninjured in same neighborhood
x
x
Bissell, 199416
Apr 22 1991,Limon, Costa Rica
7.4
Assessment of medical aspects of the disaster response following the 1991 Costa Rica Earthquake
x
x
Pretto et al., 199417
Apr 22 1991,Limon, Costa Rica
7.4
Retrospective structured interview to investigate risk injury factors and causes and circumstances of prehospital death after the Costa Rica earthquake in 1991
x
NR
Eberhart-Phillips, 199418
Oct 17 1989, Loma Prieta, California
7.1
Medical record review for all investigated deaths from 7 CA counties for 15 days after the Loma Prieta Earthquake
x
NR
Parasuraman, 199519
Sep 30 1993, Maharashtra India
6.4
Quantitative survey assessment of the loss of life and damage to property from the Latur-Osmanabad earthquake in India
x
x
Tanida, 199620
Jan 17 1995,Kobe, Japan
7.2
Analysis of mortality from the Hanshin-Awaji earthquake focused on the elderly
x
NR
Teeter, 199621
Jan 17 1994, Northridge California
6.8
Evaluation of illnesses and injuries in the aftermath of the Northridge earthquake
NR
x
Angus, 1997 22
Mar 13 1992, Ercinzan, Turkey
6.8
Retrospective medical record review of mortality and its relationship to building collapse patterns and initial medical response following the earthquake
x
x
Armenian, 199723
Dec 7 1988, Armenia
6.9
Cohort study of injuries and deaths caused by the Armenian earthquake
x
x
Kloner, 199724
Jan 17 1994, Northridge, California
6.8
Population-based analysis of the effect of the Northridge Earthquake on Cardiac Death in Los Angeles County, California
x
NR
Kuwagata,199725
Jan 17 1995,Kobe, Japan
7.2
Medical record review of final outcome of patients who suffered trauma in the Hanshin-Awaji earthquake
x
x
Peek-Asa, 199826
Jan 17 1994, Northridge California
6.8
Description of fatalities and hospitalized injuries and risk factors from the Northridge earthquake
x
x
Salinas, 199827
Jan 17 1994, Northridge, California
6.8
Comparison of emergency department admissions before and after the Northridge earthquake
NR
x
Shoaf, 199828
1987, 1989 and 1994 California
5.9, 7.1, 6.8
Household survey of Californians residents about three earthquakes, and analysis of injuries and socio-demographic predictors
NR
x
Tanaka, 199929
Jan 17 1995,Kobe, Japan
7.2
Overview of the morbidity and mortality of hospitalized patients during the 15-day period following the Hanshin-Awaji earthquake
x
x
McArthur, 200030
Jan 17 1994, Northridge California
6.8
Evaluation of the burden of injuries resulting in hospitalization in the Northridge Earthquake and the disruption of the usual pattern of service requirements
NR
x
Peek-Asa, 200031
Jan 17 1994, Northridge California
6.8
Analysis of earthquake-related and geographic data with the spatial and geographical relationships resulting from fatal and hospitalized injuries during the earthquake
x
x
Iskit, 200132
Aug 17 1999, Marmara Turkey
7.6
Retrospective analysis of clinical and laboratory data of pediatric trauma patients referred to a tertiary center after the 1999 Marmara earthquake
NR
x
Liang, 200133
Sep 21 1999, Taiwan
7.3
Analysis of risk factors for morbidity and mortality caused by the 1999 Taiwan earthquake
x
x
Mahue-Giangreco, 200134
Jan 17 1994, Northridge California
6.8
Evaluation of the associations between potential risk factors for earthquake-related injuries and injury severity from emergency department data from the Northridge earthquake
NR
x
Roy, 200235
Jan 26 2001, India
7.7
Survey of victims in a hospital assessing injury and other impacts due to earthquake
NR
x
Chan, 200336
Sep 21 1999, Taiwan
7.3
Investigation of earthquake mortality patterns and post-earthquake mortality changes
x
NR
Jain, 200337
Jan 26 2001,Gujarat, India
7.7
Description of evolution of presenting injuries in types of pediatric surgery required; propose an effective disaster relief team composition and strategy
NR
x
Liao, 200338
Sep 21 1999,Taiwan
7.3
Examination of the association between ground motion and structural destruction that causes fatal injuries from the Taiwan quake.
X
NR
Peek-Asa, 200339
Jan 17 1994 Northridge, California
6.8
Population based case-control study to examine how individual characteristics, building characteristics, and seismic features of the earthquake contribute to physical injury.
NR
x
Aoki, 200440
Jan 17 1995,Kobe, Japan
7.2
Assessment of death patterns, cause, and preventability and estimates costs of enhancing the emergency medical services response to prevent unnecessary deaths
x
NR
Chou, 200441
Sep 21 1999, Taiwan
7.3
Examination of risk factors for mortality from the 1999 Taiwan earthquake
x
NR
Ellidokuz, 200542
Feb 3 2002, Turkey
6.1
Cross-sectional study of survivors focusing on risk factors for deaths and non-fatal injuries
x
x
Emami., 200543
Dec 26 2003,Bam, Iran
6.6
Discussion of strategies used to manage a large number of casualties entering one hospital in a short period of time, both in an earthquake or other situation
NR
x
Pawar, 200544
Jan 26 2001, India
7.7
Examination of casualty rates after the earthquake in the Bhuj block.
X
NR
Uzun, 2005 45
Aug 17 1999, Marmara, Turkey
7.6
Investigation of clinical, demographic, and electromyographic characteristics of 12 pediatric quake victims and compare findings with adults.
NR
x
Hatamizadeh, 200646
Dec 26 2003,Bam, Iran
6.6
Review of Bam earthquake epidemiology from a nephrologic perspective; compares complications and outcomes of victims with and without renal failure
x
x
Sabzehchian, 200647
Dec 26, 2003 Bam, Iran
6.6
Analysis of pediatric trauma at tertiary-level hospitals following the earthquake
NR
x
Dhar et al., 200748**
Oct 8 2005, Pakistan
7.6
Medical record review of injuries and deaths of 468 patients admitted to a hospital following the Pakistan earthquake
x
x
Laverick, 200749**
Oct 8 2005, Pakistan
7.6
Analysis of injuries and deaths among 2721 adults and 1449 children in a hospital after the Pakistan earthquake
x
x
Ganjouei, 200850**
Dec 26 2003,Bam, Iran
6.8
Retrospective review of medical records of 1250 injured hospital patients seen after the earthquake
NR
x
Mohebbi., 200851**
Dec 26, 2003Bam, Iran
6.6
Assessment of demographic characteristics, injury, treatment and outcomes of 854 earthquake victims
NR
x
Mulvey, 200852**
Oct 8 2005, Pakistan
7.6
Retrospective review of medical records to document injury patterns in the first 72 hours after the Kashmir earthquake
x
x
Bai, 200953**
Oct 8 2005, Pakistan
7.8
Retrospective analysis of injuries of 2194 patients from the Pakistan earthquake
NR
x
Doocy, 200954**
Aug 15 2007, Peru
8.0
Population-based cluster survey of households affected by earthquake to assess earthquake-related risk and vulnerability
x
x
Najafi , 200955**
Dec 26 2003,Bam, Iran
6.6
Retrospective analysis of demographic characteristics, biochemical markers and outcomes of individuals referred for medical care after the Bam earthquake
NR
x
Sami, 200956**
Oct 8 2005, Pakistan
7.6
Random sample of 310 hospital patients to assess demographics and injury types
NR
x
Wen, 200957**
May 12 2008, China
7.9
Hospital-based case-control study of deaths due to earthquake injuries to assess the determinants of earthquake-related mortality
x
x
Xiang, 200958**
May 12 2008, China
7.9
Medical record analysis of pediatric victims’ characteristics, injury type, and resuscitation
NR
x
Yang, 200959**
May 12 2008, China
7.9
Retrospective medical record review of injured patients following the China earthquake
NR
x
Yasin, 200960**
Oct 8 2005, Pakistan
7.6
Medical record review of injuries, deaths, complications and procedures
x
x
Zhang, 200961**
May 12 2008, China
7.9
Retrospective record review of demographics and injury from 1170 patients following the China earthquake
NR
x
CDC, 201062**
Jan 12 2010, Haiti
7.0
Medical record review of injuries and patient characteristics at a field hospital in Haiti
NR
x
Jian, 201063**
May 12 2008, Wenchuan China
7.9
Retrospective record review of demographic characteristics and injuries of 196 hospital patients
NR
x
Milch, 201064**
Aug 15 2007, Peru
8.0
Household survey and observational damage assessment to evaluate associations between social and environmental determinants of injury and displacement
NR
x
Qiu, 201065**
May 12 2008, China
7.9
Medical record review of injury cause, type and treatment and patient demographic characteristics from 11 hospitals
NR
x
Sullivan, 201066**
Oct 8 2005, Pakistan
7.6
Cross-sectional surveys to assess risk factors for earthquake related mortality
x
NR
Farfel, 201167**
Jan 12 2010, Haiti
7.0
Analysis of injuries sustained by pediatric patients in a field hospital
NR
X
Zhao, 201168**
May 12 2008, China
8.0
Review of children treated by the relief team.
X
X
Ardagh, 201269**
Feb 22 2011, New Zealand
6.3
Data from Christchurch hospital extracted from an electronic database for review.
NR
X
Kang, 201270**
April 14 2010, China
7.1
Medical records of 3,255 patients from 57 hospitals were analyzed retrospectively.
NR
X
Sudaryo, 201271**
Sept 30 2009, Indonesia
7.6
Prospective cohort study of inured patients over a 6 month period in Padang, Indonesia.
X
X
Tan, 201272**
Sept 30, 2009,Indonesia
7.6
Two Singapore Armed Forces (SAF) primary healthcare clinics prospectively collected patient medical information for comparison..
X
X
* Additional articles identified in the hand search conducted through October 2012
Article
Summary
Key Findings
White & Harlow, 199373
Catalog of human impacts from 51 earthquakes in Central America from 1900-1991
Upper-crust earthquakes (n=51) caused at least 40,500 deaths, 105,000 injuries and made 900,000 homeless in Central America from 1900-1991. Of earthquakes with magnitude >6, 23 of 30 occurred along the Central American volcanic front. Destructive upper-crust earthquakes occurred on average every 2.5 years. Subduction zone earthquakes can have larger magnitudes and produce more widespread damage, but volcanic-front earthquakes are more frequent and pose greater risk because they occur closer to densely populated areas.
Alexander, 199674
Review of 83 earthquakes from 1993-1996
Deaths and injuries occurred in at least 40 and 42 earthquakes, respectively. Most deaths and injuries (86% and 97%, respectively) were caused by earthquakes with 6.5-7.4 magnitude and occurred between midnight and 6 AM (94% and 77%, respectively). Building collapse was the primary cause of death and injury; in 23 earthquakes, running out of doors in panic was mentioned, which can increase risk of injuries and deaths.
Musson, 200375
Review of fatal earthquakes in Britain from 974-2003
Of the ten fatal earthquakes that occurred in Britain from 974 to 2003, only 10 were directly attributable to the earthquake event. Six were due to falling stones/rock and four due to building damage. There was no correlation between magnitude and mortality.
Bird & Bommer, 200476*
Summarizes social and economic losses in 50 earthquakes,1989-2004
Compared to fault rupture, tsunami, liquefaction, and landslide, ground shaking is the principal cause of damage and loss in earthquakes. Land use, land zoning, improper construction on liquefiable soil, and design and construction are risk factors for injury and death.
Srivastava & Gupta, 200477
Review of timing, after-shocks and magnitude of 503 earthquakes >5.5 magnitude in India from 1800-2001
Earthquake timing and aftershocks are important factors related to earthquake mortality. Earthquakes that occur during the night or early morning cause more deaths than earthquakes that occur during the day. In evening/night earthquakes, mitigation efforts are hampered by decreased visibility, falling debris and electricity outages. Some regions of India are more prone to severe earthquakes than others due to geological location.
Fu et al., 200578
Review of characteristics of 420 shallow, strong earthquakes that were associated with fatalities in China from 1901-2001
From 1901 to 2001 the majority of earthquakes that caused harm to humans in China were shallow and strong; these earthquakes (n=420) caused at least 604,677 deaths. Most earthquakes with magnitude >6 occurred in Western China; the two deadliest were in 1920 (246,269 deaths; magnitude 8.6; Haiyuan, Ningxia) and 1976 (250,723 deaths; magnitude 7.8; Tangshan, Hebei). The main cause of death was building collapse; risk factors for death included time of day, building damage levels and population density. A non-linear relationship between magnitude and mortality was also observed.
Gutierrez et al., 200579
Multivariate analysis of mortality using demographic, seismic and geographic parameters in 366 earthquakes, 1980-2001
Between 1980 and 2001, 553,000 injuries and 190,000 deaths were reported in 366 earthquakes. A multivariate mortality prediction method was proposed that includes physical and geographic location, human population, GDP per capita, and magnitude. As magnitude increased mortality increased; and as depth increased, mortality decreased. However, high magnitude may not induce high mortality if it is not combined with key physical and demographic criteria. Rural and semi-rural areas with poorly built environments had higher mortality.
Spence, 200780
Review of earthquakes from 1960-2006 focusing on earthquake mortality and affected countries’ earthquake risk mitigation and prevention strategies
Between 1960 and 2006, the ten most lethal earthquakes caused 80% of the 1 million earthquake deaths and occurred in low- and middle-income countries. The main cause of death was building collapse; unreinforced masonry buildings were associated with higher death tolls. Efforts to control and reduce earthquake mortality have made progress in wealthier earthquake prone countries but little or no progress in low- and middle-income countries. Recent experience of a strong earthquake and availability of resources for mitigation were the two strongest determinants of action for risk mitigation. Growing urbanization and populations in developing countries have increased the risk of human impacts. Establishing and implementing building standards is the most important strategy for mortality and injury reduction.
Gautschi et al., 200881*
Review of individual and population impacts of major earthquakes from the 20th and 21st centuries and mitigation strategies
Reviews earthquakes with the most deaths and injuries from 20th and 21st century and describes common earthquake injuries and effective treatment approaches. In recent earthquakes mortality was significantly higher in intensive care patients treated in local earthquake-affected hospitals then those treated in unaffected hospitals. In order to minimize trauma-related mortality, knowledge of local medical facilities, equipment, capacity, and transportation infrastructure are important as is a medical transport corridor.
Chan et al., 201082*
Review of the human impact of earthquakes in China from 1906-2007
China has had the greatest human impact from earthquakes of any country in the past century. This review summarizes the mortality tolls from earthquakes in China and other major earthquakes from 1906 to 2007 and identifies gaps in the literature including lack of research on mortality and morbidity risk factors and populations with chronic disease.
Results
Historical Event Review
Overall, 74.1% of events in the database were reported by EM-DAT, 60.8% by NOAA and 25.8% by USGS; reporting by USGS improved dramatically from 2000 onwards. An average of 24.6 (range 13-43) earthquakes affected human populations annually between 1980 and 2009 (figure 2). The frequency of events increased over time, which is attributable to improvements in reporting. The average magnitude was 6.2 (range 4-9; n=493, 66.8% reporting) and focal depth 27.1km (median 19.0, range 0-235.8; n=493; 66.8% reporting). Earthquake mortality increased in parallel with the frequency of events from the 1980s onwards (Figure 3). A rapid increase in earthquake-affected populations was observed after 2000, which is likely a result of both improved reporting and population growth (Figure 3). Earthquakes were most frequent in the Americas, South-East Asia and the Eastern Mediterranean with each region accounting for 20-25% of events; however earthquake impact was greatest in the Western Pacific, which accounted for 44% of deaths and Americas, which accounted for 60% of the affected population (Figure 4). The overall impact of earthquakes on human populations is summarized in Table 3. Of the 738 identified events, the databases recorded 687 (96.9%) causing deaths, 420 (56.9%) causing injuries and 359 (51.4%) leading to homelessness.

Fig. 2: Reporting of earthquakes by source and decade (n=953)

Fig. 3: Earthquakes affecting human populations by decade, 1980-2009 (n=738)

Fig. 4: Earthquakes and their impact on human populations by region, 1960-2009*
*Regions as defined by the World Health Organization
Notes: Best estimate figures are based on the average reported number of deaths or injuries in an event; homeless and affected populations were rarely reported by sources other than EM-DAT thus ranges are not presented.
Reported Overall Impact of Earthquakes
Human Consequence
# of Events
Best Estimate
Range
Deaths
687
372,634
314,531-412,599
Injuries
417
995,219
845,345-1,145,093
Homeless
376
16,003,542
—
Affected
688
61,521,492
—
Event Summary Statistics
Human Consequence
# of Events
Median
Mean
Range
Deaths (all sources)
687 (93.1%)
Reported by EM-DAT
686
93.0%
2
554
0-87,476
Reported by NOAA
366
49.6%
9
933
1-87,652
Reported by USGS
127
17.2%
0
1,289
0-87,350
Injuries (all sources)
Reported by EM-DAT
324
43.9%
100
2,593
1-166,812
Reported by NOAA
296
40.1%
60
21,614
1-374,171
Reported by USGS
69
9.4%
100
19,641
0-166,836
Homeless (all sources)
Reported by EM-DAT
372
50.4%
0
297,140
0-5,000,000
Reported by
16
2.2%
46,594
970,495
328-4,000,000
Affected Population (EM-DAT)
677
91.7%
3152
200,783
1-46,000,000
Affected Population and Homelessness. An estimated 61.5 million people were affected by earthquakes between 1980 and 2009, including 16 million rendered homeless. These figures are likely to underestimate the true impact of earthquakes because the total affected and homeless populations were reported in only 95.5% and 51.4% of events, respectively. There were an average of 200,783 affected (median 3,7215, range 1-46,000,000) and 46,594 homeless (median 0, range 0-4,000,000) per event [where data were reported] and distributions were highly skewed.
Mortality and Injury.When mortality data from the three sources were combined, information on deaths (inclusive of events with no reported deaths) was recorded in 93.1% (n=687) of earthquakes, with fatalities occurring in 71.0% (n=524). Overall, an estimated 372,634 total deaths (range: 314,531-412,599) were reported; for events with mortality, there were an average of 604 deaths (median=3, range=0-87,652) per event when using the highest reported death toll. Deaths were concentrated in the Western Pacific (190,955 deaths, 44.6%) and Americas (103,679, 24.2%). When assessed by country, the greatest earthquake mortality was observed in China (n=90,106, 21.0%), Pakistan (n=88,314, 20.6%), and Iran (n=86,254, 20.1%). The two most deadly earthquakes (Sichuan China, 2008 and Kashmir Pakistan, 2005) accounted for 40% of all earthquake mortality.
Injuries were reported in only 56.9% (n=420) of events with estimated total of 995,219 reported injuries (range: 845,345-1,145,093). When injuries were reported, there were an average of 3,499 (median=100, range 1-374,171) injuries per event using the highest reported number for the event. To better estimate the total number of injuries, it was presumed that injuries would occur in events where deaths were reported. Among the 687 earthquakes with fatalities reported, injuries were reported in only 420 (61%) events. When the median and mean for injuries were applied to the remaining 267 events, between 29,392 and 1,267,864 additional unreported earthquake related injuries may have occurred between 1980 and 2009.
Bivariate associations between country-level characteristics and earthquake-related mortality are presented in Table 4. All predictors except for earthquake focal depth were significantly associated with mortality. In the adjusted multinomial logistic regression model (Table 5), only magnitude was significantly associated with earthquake mortality. World Bank development level, the Gini Index coefficient, and focal depth were not statistically associated with earthquake-related mortality. The odds of a high mortality event as compared to an event with no deaths increased by 11.93 (95 CI: 5.35-26.57) per additional point on the magnitude scale.
*GINI coefficient scores for income distribution range from 0 to 100 with 0 representing a perfect equality and 100 perfect inequality.
Characteristic
No deaths (n= 214)
1-9 deaths (n =258)
10-99 deaths (n =144)
>100 deaths (n =122)
p-value
Decade, n (%)
1980-89
50 (23.3%)
69 (26.7%)
42 (29.2%)
33 (27.1%)
0.008
1990-99
71 (33.2%)
82 (32.8%)
57 (39.6%)
58 (47.5%)
2000-09
93 (43.5%)
107 (41.5%)
45 (31.3%)
31 (25.4%)
World Health Organization Region, n (%)
Europe
64 (29.9%)
49 (19.0%)
27 (18.8%)
16 (13.1%)
0.001
Americas
38 (17.8%)
65 (25.2%)
30 (20.8%)
21 (17.2%)
Africa
6 (2.8%)
18 (7.0%)
9 (6.3%)
7 (5.7%)
South-East Asia
25 (11.7%)
31 (12.0%)
19 (13.2%)
27 (22.1%)
Western Pacific
54 (25.2%)
63 (24.4%)
32 (22.2%)
24 (19.7%)
Eastern Mediterranean
27 (12.6%)
32 (12.4%)
27 (18.8%)
27 (22.1%)
World Bank Development Level, n (%)
Low-income
14 (6.5%)
26 (10.1%)
14 (9.7%)
18 (14.8%)
0.026
Lower-middle income
104 (48.6%)
121 (46.9%)
73 (50.7%)
67 (54.9%)
Upper-middle income
47 (22.0%)
69 (26.7%)
38 (26.4%)
26 (21.3%)
High-income
49 (22.9%)
42 (16.3%)
19 (13.2%)
11 (9.0%)
GINI*(n=681)
Mean (SD)
39.3 (6.4)
41.2 (8.0)
41.3 (7.6)
41.0 (7.0)
0.0241
Per Capita GDP (US$) (n=732)
Mean (SD)
11,777.1(14,911.8)
8975.9 (12,854.8)
7387.1 (10969.7)
6,058 (10,487.3)
0.0013
Focal Depth, km (n=493)
Mean (SD)
22.9 (21.1)
30.2 (33.3)
25.5 (25.6)
27.9 (34.1)
0.2228
Magnitude (n=493)
Mean (SD)
5.9 (0.7)
6.3 (0.6)
6.2 (0.8)
6.7 (0.7)
<0.001
*Reference is ‘no deaths’ for all categories (n=55) **Model includes both magnitude and focal depth; focal depth is measured on a log (base 10) scale ***p-values reported for each category with Wald test p-values for the variable.
Characteristic
Low Mortality 1-9 deaths (n =127)
Medium Mortality 10-99 deaths (n =89)
High Mortality 100 deaths (n =72)
RRR (95 CI)
p-value
RRR (95 CI)
p-value
RRR (95 CI)
p-value***
Decade
1980-89
Reference
Reference
Reference
0.027
1990-99
1.03 (0.42, 2.56)
0.947
.98 (.36, 2.42)
0.907
0.52 (0.19, 1.44)
0.21
2000-09
0.98 (.42,2.32)
0.97
0.46 (0.18, 1.16)
0.10
0.19 (0.06, 0.55)
0.002
WHO Region
<0.001
Africa
Reference
Reference
Reference
Europe
<0.001 (0,0)
<0.001
<0.001 (0,0)
<0.001
<0.001 (0,0)
<0.001
Americas
<0.001 (0,0)
<0.001
<0.001 (0,0)
<0.001
<0.001 (0,0)
<0.001
South-East Asia
<0.001 (0,0)
<0.001
<0.001 (0,0)
<0.001
<0.001 (0,0)
<0.001
Western Pacific
<0.001 (0,0)
<0.001
<0.001 (0,0)
<0.001
<0.001 (0,0)
<0.001
E Mediterranean
<0.001 (0,0)
<0.001
<0.001 (0,0)
<0.001
<0.001 (0,0)
<0.001
Gini Coefficient
1.10 (0.99, 1.20)
0.054
1.04 (0.95, 1.15)
0.156
1.11 (0.99, 1.24)
0.058
Per Capita GDP (1000s)
1.01 (.97, 1.05)
0.646
.98 (.93, 1.02)
0.302
1.00 (.95, 1.05)
0.97
Focal Depth km)**
1.82 (.57,5.9)
0.314
.58 (.16, 2.05)
0.394
.38 (0.09, 1.58)
0.184
Magnitude
2.8 (1.39, 5.62)
0.004
3.99 (1.9, 8.3)
<0.001
11.93 (5.35, 26.57)
<0.001
Systematic Literature Review
Mortality. Of the articles reviewed, 27 reported on causes of death (n=17) and/or risk factors including sex (n=8), age (n=15), building or location (n=17) and other risk factors (n=11) (Table 6). The primary cause of death in the majority of studies was building collapse 16–20,22,23,25,29,31,33,36,40,46. Females faced a significantly increased risk of death in three studies 19,36,41 while several others found no significant difference in mortality by sex 18,33,38,66 none reported that males faced a significantly increased mortality. Of the 14,709 earthquake deaths where sex was reported in the articles reviewed, 45% (n=6649) and 55% (n=8,060) of deaths were among males, yielding a ratio of 1.0:1.2 for male to female mortality. Age was a risk factor for mortality in many studies. Older populations consistently had higher rates of death 13,18,20,26,29,33,36,38,41,66 and in several studies children also faced increased mortality 19,29,33,44.
Article
Event
Mortality Rate
Cause
Sex
Age
Building and Other Risk Factors
Angus, 199722
Turkey, 1992
Not reported
48% (n=26) instant/building collapse. Of protracted deaths, 50% (n=13) hemorrhaged and 42% (n=11) asphyxiated.
Not reported
Not reported
92% of indoor deaths occurred in mid-level unreinforced masonry buildings; deaths were more likely among those on the ground floor. Prior first-aid or rescue training of lay, uninjured survivors was associated with a higher likelihood of rescue and resuscitation.
Aoki, 200440
Japan, 1995
Not reported
Asphyxia/pressure, 74% (n=3551); contusion injury, 17% (n= 828); head/neck injury, 8% (n=286); indirect, 3% (n=121).
Not reported
Not reported
Not reported
Armenian, 199713
Armenia, 1988
254/10,000
Trauma due to building collapse.
Not reported
Increased deaths among >60yrs.
Building height and upper floor location were important predictors of death; odds of death were 9.8 times greater for those inside compared witho those outside.
Bisselll, 199416
Costa Rica, 1991
Not reported
Entrapment and crush injury.
Not reported
Not reported
Most fatalities occurred in homes; wood-frame houses with lateral bracing were less likely to collapse than those without bracing.
Chan, 200336
Taiwan, 1999
134/10,000
77% (n=1,441) instant/building collapse; causes asphyxiation (32%), intracranial inj (29%), trauma/ trunk/extremity inj (16%), internal inj (7%), crush inj (6%), and fractures (6%).
Male: 122/10,000; Female: 144/10,000. Ratio: 0.85:1.0
Increased risk w/ age; death ratio of >45yrs to adults <45yrs of 3.3:1.
Complete collapse was a better predictor of death than partial collapse; a 1% increase in completely collapsed home was associated with a 5% increase in the crude death rate.
Chou, 200441
Taiwan, 1999
Not reported
Not reported
Increased female risk: OR 1.2 (CI: 1.1-1.3)
Higher mortality in older age groups.
People with lower socioeconomic status and the physically disabled were at increased risk of mortality.
Doocy, 200954
Peru, 2007
1.4/1000
Not reported
Not reported
Sample size too small for analysis
Not reported
Eberhart-Phillips,199418
California, 1989
Not reported
Elevated freeway collapse; 81% (46/57) of direct deaths vehicle /roadway related. Indirect deaths due to CO poisoning, heart attacks, falls and GI bleeding.
Victims more likely to be female (NS)
Victims more likely to be older (NS)
Elevated freeway collapse
Ellidokuz, 200542
Turkey, 2002
1.6/10,000
Not reported
Not reported
Median age = 51 yrs (range 4-74)
Collapsed (11 deaths) and severely damaged (2 deaths) buildings.
Hatamizadeh, 200646
Iran, 2003
19.7% (41/2086 patients)
Trauma (n=11), cardiac arrest (n=6), septicemia (n=5), DIC (n=3), hypovolemic shock (n=2), and ARDS (n=3)
Not reported
Mean age = 32.3 yrs (SD=16.3)
Patients with acute renal failure were significantly more likely to die than those with other diagnoses.
Kuwagata, 199725
Japan, 1995
6.6%(178 /2702 injuries)
Crush syndrome (n=50, 28%), vital organ injuries (n=36, 20%), 7 (1%); fractures of the pelvis or spine (n=7, 1%); others (n=18, 1.3%); and unknown (n=67, 59%)
Not reported
Not reported
The most life-threatening injuries, crush syndrome and vital organ injuries, occurred indoors.
Laverick, 200749
Pakistan, 2007
Adults: 4.3% (118/ 2721) Children 3.5% (50/ 1449 patients)
Tetanus (n=22) deaths and neonatal causes (n=4); no other causes reported
Not reported
Not reported
Not reported
Liang, 200133
Taiwan, 1999
14.82/100,000
Body compression, including head injury (32%), shock (29%) and asphyxiation (29%). Other causes included organ injury, spinal cord injury, burns and CO poisoning.
Male:14.0/100,000 Female:15.6/100,000 Ratio:1.11 (NS)
>80yrs 80/100,00070-79yrs 50/100,000 20-29yrs 6.9/100,000 0-9yrs 12.7/100,000.
Distance to epicenter; earthquake intensity, age, population density, and physicians and hospital beds per 10,000 population were all significant predictors of mortality.
Liao, 200338
Taiwan, 1999
Not reported
Not reported
Male:10.7/100,000 Female:10.1/100,000 Ratio: 1.05(NS)
<15yr:8.5/100,00015-64:8.4/100,000 65+: 34.8/100,000
Overall building collapse rate was a better predictor of mortality than partial building collapse. Intensity and distance to the epicenter were positively associated with mortality.
Mulvey, 200852
Pakistan, 2008
0.2% (2/1502 patients)
Head injuries
Not reported
Not reported
Not reported
Parasuraman, 199519
India, 1993
Not reported
Building collapse
More females than males died in all adult age groups.
By age grp: <14, 50%; 15-24, 13%; 25-59, 28%; 60+, 11%.
Homes with mud/stone walls suffered the most damage (~90% collapsed); fewer deaths occurred in mud/thatch homes and in stone/mud/concrete homes.
Pawar, 200544
India, 2001
Not reported
Not reported
Not reported
By age group: 0-14, n=171 (62%); 14-19, n=41 (15%), adults, n=45 (16%); older adults, n=19 (7%).
The death rate was significantly associated with distance to epicenter.
Peek-Asa, 199826
California, 1994
19.3% (33/ 171 injured)
Asphyxia and body compression from building collapse (n=22, 71%); vehicle accidents (n=5, 15%); falls (n=4, 12%).
Not reported
31% of the deceased were >65 yrs.
Most fatalities were caused by a structural failure (n=25, 76%); >66% of fatalities involved a structural failure of the home. Earthquake related motor vehicle injuries were 5 times more likely to result in fatality than a hospitalized injury.
Peek-Asa, 200031
California, 1994
22.6% (30/ 133 injured patients)
Not reported
Not reported
Not reported
Fatal injuries were concentrated near the epicenter and in areas with higher peak ground acceleration.
Pointer, 199214
California, 1989
1.3/100,000 (CMR)
Not reported
Not reported
Not reported
Not reported
Pretto,199417
Costa Rica, 1991
4/10,000
92% (n=45) instant deaths due building collapse/crush syndrome
Not reported
Not reported
People inside wood frame buildings had a higher risk of injury and death than people in other building types (OR 22.5, p<.001).
Roces, 199215
Philippines, 1990
19% among the injured (68/363)
Not reported
Not reported
Not reported
Cases were more likely to be inside concrete/mixed materials rather buildings as compared to wood (OR 2.6, CI 1.7-4.1) and on a middle or upper floor (OR 3.4, CI:2.2-5.5 and OR 1.9, CI 1.3-2.9, respectively). Chance of survival decreased as time of rescue increased: 84% of the survivors were rescued within the first hour.
Sullivan, 201066
Pakistan, 2005
1.7-5.4% in camps/ communities (708 deaths)
Not reported
Higher Death rate among females (NS)
Children <5 (1.2-10.6% CMR) and adults >50 (3.2-9.9% CMR) had highest risk
Not reported
Tanaka, 199929
Japan, 1995
8.6% (527/ 6107 patients)
Crush injuries (n=50). Indirect causes included respiratory (n=110) and cardiovascular (n=56).
Not reported
Increased with age in patients with prior injuries and illness.
Not reported
Tanida, 199620
Japan, 1995
Not reported
Crush injuries (77%); also penetrating injuries and burns.
Among those >60yrs, female fatalities were 2 times greater than males.
>50% of deaths among those >60; the death rate of 80+yrs was 6 times that of <50yrs.
Not reported
Wen, 200957
China, 2008
NA – case control study
Not reported
Not reported
Not reported
Traumatic brain injury, multiple system organ failure, prior disease, and infection significantly associated w/ increased death risk
Yasin, 200960
Pakistan, 2005
1.9% (17/862 patients)
Tetanus (n=7), trauma/ sepsis (n=5), spinal injury n=(2), crush syndrome (n=2), head injury (n=1)
Not reported
Not reported
Not reported
Zhao, 201169
China, 2008
7 deaths
4 patients with open-head injury, 3 had severe crush injury.
Not reported
Not reported
Not reported
Kang, 201270
China, 2010
0.2% (7/3255)
Four patients died from earthquake-related injuries and three from other illnesses.
Not reported
Not reported
Not reported
A majority of deaths occurred indoors 13,16,19,22,25,29,42 often at home, and the rate of complete building collapse was a good predictor of crude mortality rates 36,38 Construction materials were associated with increased mortality risk, including unreinforced masonry 22, mud and stone walls19, concrete 15, panel construction 13 and wood construction 16,17,42; however no clear trend was observed across studies. Location on the ground floor 20,22 and upper floors 15,23 of multistory buildings were associated with increased risk of death. Other mortality risk factors included earthquake intensity and distance to epicenter 31,33,38,44 physical disability 41 prior injury or illness 29, low socioeconomic status 41, and being in a car 31. Response and health systems characteristics associated with mortality risk included time to rescue15, per capita availability of physicians and hospital beds 33, and prior first-aid or rescue training of lay, uninjured survivors 22; better availability of rescue and early emergency care could prevent a substantial portion of deaths 17.
Injury. Detailed information on injury was reported in 51 articles among which 42 included data on injury type, 30 on gender risk, and 31 on age risk (Table 7). Soft tissue injuries (including lacerations and contusions) and fractures were the most common types of injury reported 15,16,23,25,27,29,43,47,51,52,53,56,58,60,62,67,69,70,71, and the extremities were the most likely areas of the body to be affected 26,46,50,51,59,61. Crush injuries/syndrome were reported as the most common injury in several in-patient studies, and there was a substantial body of literature on this topic (articles focusing on a specific injury type were not abstracted for this review) 16,32,45,55 . The proportion of injured by sex and, when combined, suggests a similar injury risk among males in females- Males accounted for the majority in eleven studies 13,32,43,46,48,50,51,52,53,71,73 and females in sixteen 23,26,28,32,34,35,39,45,47,54,56,58,59,62,63,65,70,72 . However statistically significant differences were observed in a few cases, all of which suggested increased female risk 28,39,45,55 . Many articles reported descriptive age data, however information on age-related injury risk was reported in fewer articles and included decreased risk among children 30,46, and increased risk among young and/or working age adults 50,52,56,62 , the elderly 30, and with increasing age 26,29,34,39,54, Building characteristics and other related risk factors included being indoors 13,15,16,23,25, or on a middle or upper floor 13,15,23,25, construction type and/or quality 15,16,23,26,34,37,39 and low socioeconomic status 54,56.
Notes: Peek-Asa 2000 and Laverick, 2007 reported detailed information on injury but are excluded from the table because no information was reported on factors included in the table. In many cases reporting by injury type, age, and/or sex was incomplete which is why numbers reported for each outcome may not sum to the total number of deaths reported.
Article
Event
Injuries Reported
Injuries By Type and Cause
By Sex
By Age
Male
Female
N
(%)
N
(%)
Angus, 1997
Turkey, 1992
29
Not reported
NR
NR
NR
NR
Not reported
Armenian, 1992
Armenia, 1988
189
Not reported
120
63%
69
37%
Descriptive only
Armenian, 1997
Armenia, 1988
1454
Fractures/broken bones (37%) and crush injuries (27%) were most common
658
45%
796
55%
Not reported
Bai, 2009
Pakistan, 2005
2194
Open wounds (68%), soft tissue (20%), and fractures (18%), most often in lower extremity; infection was common.
166
60%
109
40%
Descriptive only
Bissell, 1994
Costa Rica, 1991
182
Crush injuries, long bone fractures and soft tissue injuries were most common
NR
NR
NR
NR
Not reported
CDC, 2010
Haiti, 2010
126
Fractures/dislocations, wound infections, and head, face, and brain injuries were most common.
74
46%
85
53%
Descriptive; young adults were most at risk
Dhar, 2007
Pakistan, 2005
468
Fractures/broken bones (58%), soft tissue only (35%), chest trauma (5%), spine injuries (4%), and others (2%).
271
58%
197
42%
Descriptive only
Doocy, 2009
Peru, 2007
92
Crush injuries (31%), fractures (23%), wounds (20%), other types (18%), and blunt force injury (8%) were most common.
2%
3%
Injury risk increased by 3% per additional year of age.
Ellidokuz, 2005
Turkey, 2002
18
18 injured persons, including 4 with fractures/broken bones and 1 burn patient all had lacerations or contusions.
9
50%
9
50%
Descriptive only
Emami, 2005
Iran, 2003
708
Lacerations/contusions (27%), fractures/broken bones (20%), and crush syndrome (4%) were most common.
392
55%
316
45%
Descriptive only
Farfel, 2011
Haiti, 2010
182
Open wounds (29%), fractures (26%), crush injuries (16%), superficial injuries (16%), contusions (4%), dislocations (3%), and head injuries (3%) were most common.
NR
NR
NR
NR
Descriptive only
Ganjouei, 2008
Iran, 2003
1250
Lower limb (41%), pelvis (26%) and head injuries (25%) were most common among hospitalized patients in the study.
223
54%
193
46%
Risk of injury was highest among 19-60yrs of age and very low among children
Hatamizadeh, 2006
Iran, 2003
2086
Trauma to extremities (36%), head/neck (16%), abdomen (16%), and thorax (9%).
1079
52%
966
46%
Significantly lower injury risk for those <15 yrs (p<.001) and higher risk for young/ middle-aged adults (p<.001).
Iskit, 2001
Marmara Turkey, 1999
33
Crush injuries/syndrome (45%), and fractures/broken bones (24%) were most common.
17
52%
16
48%
Not significant
Jain, 2003
India, 2001
62
Orthopedic injury (42%), soft tissue injury (10%), and burns (6%).
NR
NR
NR
NR
Descriptive only
Jian, 2010
China, 2008
196
Multiple trauma (36%), and lower limb injury (34%) were the most common.
88
45%
108
55%
Descriptive only
Kuwagata, 1997
Japan, 1995
2702
Fractures/broken bones (45%), soft tissue injury (33%), crush syndrome (14%), burns (2%), nerve injuries (2%), other (2%) and unknown (4%).
NR
NR
NR
NR
Not reported
Liang, 2001
Taiwan, 1999
8722
90% suffered from head injury, open wounds, contusions or fractures
NR
NR
NR
NR
Not reported
Mahue-Giangreco, 2001
California, 1994
418
Not reported
167
40%
251
60%
Risk of injury increased with age category (NS); risk of injury was 6 times greater in patients 60+yr compared 30-39yr
McArthur, 2000
California, 1994
138
Not reported
NR
NR
NR
NR
Significantly lower risk among children and higher risk among adults >65yrs
Milch, 2010
Peru, 2007
—
Not reported
NR
NR
NR
NR
Not reported
Mohebbi, 2008
Iran, 2003
854
Fractures of the lower extremities most common (25%)
467
55%
387
45%
Descriptive only
Mulvey, 2008
Pakistan, 2005
1502
Lacerations (65%), fractures (22%), and soft tissue (6%).
262
56%
206
44%
Descriptive only; highest among young adults
Nadjafi, 1997
Iran, 1990
495
Crush syndrome 6%
NR
NR
NR
NR
Not reported
Parasuraman, 1995
India, 1993
9082
Minor injuries (47%). Among 4803 in-patients: upper limb (24%), head (18%), spinal (9%), lower limb (14%), paralysis (7%), multiple fractures (3%), eye (3%) and other (23%).
NR
NR
NR
NR
Not reported
Peek-Asa et al, 1998
California, 1994
171
Causes: falls (56%), hit/trapped (23%), burned/electrocuted (7%), cut/pierced (5%), vehicle accidents (3%), other (6%).
78
46%
93
54%
Injury rates increased significantly with age; trend was more pronounced for hospitalized injuries.
Peek-Asa et al, 2003
California, 1994
103
Not reported
36
35%
67
65%
Among adults, risk of injury increased by 1.3 (CI: 1.1-1.6) per every 10yrs in age.
Pocan et al, 2002
Turkey, 1999
630
Crush syndrome (5%), upper extremity (5%), lower extremity (8%), multiple extremities (2%).
NR
NR
NR
NR
Not reported
Pointer et al, 1992
California, 1989
1082
Minor injuries (59%), fractures/broken bones (17%), sprains/dislocations (15%), head injuries 4%.
NR
NR
NR
NR
Not reported
Qui, 2010
3401
Causes: blunt strike (68%), crush/burying (19%) and slip/falling (13%). Extremity injuries (55%) and fractures accounted (53%) were most common.
1684
50%
1713
50%
Descriptive only
Roces et al, 1992
Philippines, 1990
363
Contusions (30%), abrasions (16%), fractures/broken bones (16%), lacerations (12%). 56% had injured extremities. Causes: falling debris (34%), entrapment (30%), falls (16%), and landslides (10%).
NR
NR
NR
NR
Not reported
Roy, 2002
India, 2001
283
Spine/pelvis (17%), upper extremity (13%), chest/abdominal trauma (<4%), crush syndrome (<2%).
125
44%
158
56%
Descriptive only
Sabzehchian, 2006
Iran, 2003
119
Lacerations/contusions (51%), fractures/broken bones (53%), head injuries (31%)
59
50%
60
50%
Descriptive only
Salinas et al, 1998
California, 1994
329
Lacerations/contusions accounted for 50% of injuries.
NR
NR
NR
NR
Descriptive only
Sami, 2009
Pakistan, 2005
298
Bone injuries (41%), soft tissue injuries (36%), mixed injuries (23%).
137
46%
161
54%
Descriptive; injuries concentrated in <30 population but older adults face increased risk
Shoaf et al, 1998
California, 1987, 1989, 1994
183
Falling debris, physical force of earthquake, and falls caused most injuries.
65
36%
118
64%
Mixed: Injured respondents were significantly older in Loma Prieta and significantly younger in Northridge.
Tanaka et al, 1999
Japan, 1995
2718
Fractures/broken bones (55%), lacerations/contusions (35%), crush injury (12%), peripheral nerve injury (5%); and burns (2%).
NR
NR
NR
NR
Morbidity rates increased with age
Teeter, 1996
California, 1994
—
Of all care seekers, 9% reported earthquake-related musculoskeletal injuries, and 3% lacerations/contusions.
NR
NR
NR
NR
Descriptive only
Uzun, 2005
Turkey, 1999
75
Crush injury (19%) and fractures/broken bones (15%)
34
45%
41
55%
Descriptive only
Wen, 2009
China, 2008
36
Not reported
NR
NR
NR
NR
Not reported
Xiang, 2009
China, 2008
119
Fractures were the most common injury type followed by soft tissue injuries.
58
49%
61
51%
Descriptive only
Yang, 2009
China, 2008
533
The most common injuries were limb and pelvis (59%), soft tissue (39%) and chest (21%).
234
44%
299
56%
Descriptive only
Yasin, 2009
Pakistan, 2005
1698
Poly-trauma with the most common major injuries being fracture and soft tissue related.
NR
NR
NR
NR
Not reported
Zhang, 2009
China, 2008
1723
Lower limb (36%) and head injuries (18%) were most common.
848
48%
922
52%
Descriptive only
Zhao, 201169
China, 2008
192`
Distribution of pediatric injuries: limb 106 (55.2%); body surface 67 (34.9%); head 23 (12%); chest 18 (9.4%); spine 17 (8.9%); pelvis 13 (6.8%); abdomen 6 (3.1%); and face/neck 6 (3.1%).
NR
NR
NR
NR
Not reported
Ardagh 201269
New Zealand, 2011
6659
The most common types of injuries included: Lumbar sprain 721, Neck sprain 531, Sprain of shoulder and upper arm 297, Contusion, knee and lower leg 260, Rotator cuff sprain 205, Ankle sprain 204, Thoracic sprain 140, Open leg wound 140, Contusion, shoulder or upper arm 138, Dental injuries 136
2032
31%
4627
69%
Injury rates were highest among middle age adults (40-59 yrs) at 21%. Lower injury rates were observed in children and older adults.
Kang, 201270
China, 2010
2622
Bone fractures were diagnosed in 1,431 (55.1%) patients and crush syndrome was observed in 23 (0.9%).
1330
51%
1268
49%
1,426 (43.8%) were middle-aged (31–50 years)
Sudaryo, 201271
Indonesia, 2009
184
Bruises (41%), bone fracture and/or dislocation (39%) were the most predominant types of injury. The extremities (both upper and lower) were the most affected part of the injured body (81%).
53
29%
131
71%
Not reported
Tan, 201272
Indonesia, 2009
113
55% of emergency department patients had a trauma-related diagnosis.
66
58%
47
42%
Not reported
Discussion
Main findings
In the 30 year period between 1980 and 2009, approximately 372,634 people died and nearly one million were injured as a result of earthquakes, with potentially an additional 29,392 to 1,267,864 unreported injuries. In this same period, 61.5 million people were affected by earthquakes, including at least 16 million left homeless. While mortality estimates in this study are consistent with those reported by other sources 2 the numbers injured and homeless populations are likely gross underestimates given the low frequency with which these figures are reported. Prior review articles either focused on specific regions 69,71,73,74,78, a limited time period 70,74 mitigation strategies 75 mortality only 75, or individual injury and treatment 77. Only one prior review used data from multiple sources 81.
Findings from this review, including descriptive statistics of and factors associated with earthquake mortality, are consistent with previous observations that earthquake mortality varies as a function of severity 74,79, place 12,77,79,80, time 12, and development level of the affected area 79,80. With respect to severity, greater focal depth was inversely associated with mortality, whereas greater magnitude (moment scale) was positively associated with mortality. In terms of place, earthquakes were relatively evenly distributed across the Western Pacific, American and European regions, whereas the plurality of deaths occurred in the Western Pacific, followed by the Eastern Mediterranean region. The largest numbers affected by earthquakes were in the Western Pacific followed by the South East Asia. As observed in previous studies, these findings are skewed by large events, such as the 2005 Pakistan earthquake that resulted in approximately 75,000 deaths 79,80,81. The Haiti earthquake in 2010, one of the deadliest on record, which falls just outside the scope of the review period, is illustrative of how an occasional high-impact event can drastically change regional impact distributions and study conclusions.
In terms of time trends, the number of earthquakes has increased steadily since the 1980s and a greater number of people have been affected over time. While improved reporting may partly explain an increase in the number of earthquake events, the increases in mortality and the size of affected populations may also be attributable to population growth, urbanization and migration 80 and changes in land use patterns 76. Similar to other reviews lower economic development level, measured by per capita GDP, was associated with increased mortality which suggests that poorer countries face increased risk due to a variety of characteristics of the built environment 79,80.
Findings from the systematic literature review of studies examining earthquake-related mortality and injury contribute to an improved understanding of the primary causes of death and types of injury as well as factors that may place certain populations at increased risk. Consistent with prior review articles, this review identified the most common cause of earthquake-related death as building collapse 13,74,75,78,80. In addition, multiple studies highlighted that building type, the rate of collapsed buildings and construction materials were significantly associated with injury and mortality risk. This highlights that building improvements, especially in the design and construction and the enforcement of zoning and building codes, should be central to earthquake prevention and mitigation strategies.
Recurrent characteristics associated with increased risk for both mortality and injury were extremes of age, socioeconomic status and location of individuals at the time of the event. Consistent with the ecological study using the historical event database, individuals and households of lower socioeconomic status were at increased mortality and injury risk. Location, including distance from epicenter, being inside or outside a building, and type of building and location within the building were also strong predictor of earthquake mortality and injury risk. Timing of the event was also associated with mortality and injury risk where earthquakes occurring at night had higher mortality levels than those occurring during the day 74,77 .The relationship between sex and mortality and injury was less straightforward. While it is tempting to draw conclusions from these findings, it is important to highlight that 70% and 44% of the 27 mortality studies did not report deaths by sex and age, respectively. In addition, few studies performed significance tests, and an even smaller number controlled for other risk factors in the analyses. When considering the extent to which age and sex may interact with other important risk factors, such as location during the event or characteristics of the built environment, accurately characterizing factors that contribute to mortality and injury risk becomes especially challenging.
The important role of the emergency response and health care systems in reducing mortality and injury in the immediate aftermath of an earthquake was highlighted in a number of studies 18,22,33,81, it is clear that such systems remain inadequate in many earthquake prone countries that are less developed. Health facilities are especially vulnerable from earthquakes due to direct and indirect damage (losses in utilities and infrastructure) that affect that affect their emergency response capacity. The extensive body of literature on earthquake related mortality and injuries could inform response planning for future earthquakes in high risk areas.
An historical event review such as this can elucidate patterns over place and time as well as factors associated with increased mortality risk, but cannot identify more specific associations. For instance, a number of country-specific studies have highlighted significant differences in mortality risk by population density, rural/urban area and across diverse geographic regions 77,78,79. Particularly in earthquake prone regions or countries, additional research is needed to identify specific characteristics that may place populations at increased risk for mortality or injury during or in the immediate aftermath earthquakes. Nonetheless, statistical models to predict earthquake mortality, can be useful tools for estimating the relative contribution of geographic characteristics and population sociodemographics to earthquake mortality 79. Compared to other natural disasters a wealth of data and peer review articles on earthquakes exists and there is a comparatively strong evidence base for drawing conclusions on earthquake impact at global, regional, and in some cases national levels.
Limitations
The effects of earthquakes are the subject of gross approximations and aggregations with a great deal of imprecision. The availability and quality of data has likely improved over time and the use multiple data sources increased reporting. However, underestimation of the impacts of earthquakes is substantial because in many events outcomes such as injured and affected are unreported. In addition, inconsistencies and errors were common in data files from different sources. Several challenges were encountered when attempting to model earthquake mortality including a non-normal distribution, which necessitated analysis with a categorical outcome. Information on 2007-2009 GDP, 2009 World Bank development classification and 2009 GINI index were used for the analysis regardless of event year, and it is possible that many of these values were substantially different in prior decades and some countries are new or have merged with other nations. Many of the island-countries in the Caribbean are territories of European countries, which necessitated the use of GDP, GINI, and development levels representative of the actual earthquake affected areas. Systematic literature reviews are not without their limitations. The articles identified and included in this review is not an exhaustive list, as articles that were not written in English were excluded, and a number of studies meeting inclusion criteria during the abstract review could not be found. Additionally, findings from the included studies are difficult to aggregate because of differences in design, reporting, and study population. Another important series of articles not included in this review is those which report on specific types of injuries and their outcomes; future reviews with an in-depth focus on injury, and to the extent possible, relationships between built environment, injury and outcomes could make an important contribution to the literature.
Conclusions
In the last 30 years, almost 400,000 deaths and 1 million earthquake-related injuries were reported, with an estimated 61.5 million people affected. Approximations of the numbers injured and those made homeless are likely gross underestimates of the true values given low reporting levels. The distribution of earthquake related deaths and injuries vary greatly by region and economic development level with greater magnitude and lower economic development of affected areas associated with increased mortality. Globally, earthquake impact was concentrated in Asia, which had the greatest number of deaths and the largest affected population.
The primary cause of earthquake-related mortality was building collapse most frequently leading to soft tissue injuries, fractures and crush injuries/syndrome. Risk factors for earthquake-related death and injury included very young and very old age, poor socioeconomic status, being indoors and being in a poorly constructed building during the time of the event. Earthquake losses are likely to increase in future years due to population growth of in high-risk seismic areas and in the case low and medium development areas, inadequate construction quality. Increased attention to earthquake prevention and mitigation strategies, with a focus on the built environment in particular, is necessary. Strategies that are specific to the development level and country context are essential. For instance, improved building construction is not a reasonable short term objective for a country like Haiti. Other interim short term strategies need to be adopted in settings where changes in building codes, their enforcement, construction methods, and other characteristics of the built environment may take decades to achieve.
Competing Interests
The authors have declared that no competing interest exist.
Correspondence
Shannon Doocy, Johns Hopkins Bloomberg School of Public Health, 615 N. Wolfe St, Suite E8132, Baltimore, MD 21230. Tel: 410-502-2628. Fax: 410-614-1419. Email: [email protected].
Introduction
Tropical cyclones, also known as typhoons and hurricanes, have caused an estimated 1.33 million deaths since the beginning of the 20th century and affected more than 629 million people in this timeframe. A tropical cyclone is a non-frontal storm system that is characterized by a low pressure center, spiral rain bands and strong winds. Usually it originates over tropical or sub-tropical waters and rotates clockwise in the southern hemisphere and counter-clockwise in the northern hemisphere. Depending on their location and strength, tropical cyclones are referred to as hurricanes (western Atlantic/eastern Pacific), typhoons (western Pacific), and cyclones (southern Pacific/Indian Ocean) 1. Approximately half of tropical cyclones recorded and more than 90% of cyclone-related deaths originate in Asian waters 1. Cyclones are large organized storms with well-defined cores that begin over tropical or subtropical waters, often as a result of monsoon troughs and easterly waves 2. An average of 37 tropical storms occur each season and they range in size from 100 to more than 1,000km in diameter and are known for strong winds and bands of torrential rain that revolve around the center or eye of the storm 3. In the Eastern Pacific basin the season begins two weeks early on May 15th. The levels of intensity of these storms range from tropical depression (winds <17 meters per second), to tropical storm (winds 18-32 m/s), and cyclone (>33 m/s) 4. Once formed, cyclones maintain strength by pulling heat and moisture from warm ocean waters 3. The damage and deaths related to cyclones are the result of three major forces: winds in excess of 155 miles per hour; storm surge where the level of the sea rises as much as 10 meters and move ashore; and secondarily due to floods resulting from torrential rains. Storm surges and floods are the primary causes of death in cyclones 5.
The impacts from cyclones are concentrated in coastal areas of South and East Asia, Madagascar, the east coast of North and Central America and the Caribbean. Mortality is concentrated in Asia, economic losses follow a similar pattern; however, total economic losses are greatest in affluent countries with developed infrastructure 6. Future vulnerability to cyclones will increase due to factors including population growth, urbanization, increasing coastal settlement and changing weather patterns. The objectives of this review are to describe the impact of cyclones in terms of mortality, injury, and displacement and, to the extent possible, identify risk factors for associated with these outcomes. This is one of five reviews on the human impact of natural disasters, the others being volcanoes, floods, tsunamis, and earthquakes.
Methods
Data on the impact of cyclones were compiled using two methods, a historical review of cyclone events and a systematic literature review of publications relating to the human impacts of cyclones.
Historical Event Review
A historical database of significant cyclones from 1980 to mid-2009 was created from publicly available data. Multiple data sources were sought to ensure a complete listing of events and to allow for cross checking. The two primary data sources were the Centre for Research on the Epidemiology of Disasters (CRED) International Disaster Database (EM-DAT) 7 and the National Hurricane Center (NHC)8 because they included information on human impacts. The events in the EM-DAT database include one or more of the following criteria: 10 or more people killed or injured; 100 people affected; declaration of a state of emergency; or a call for international assistance. The NHC database included information on all cyclones in the Atlantic, Caribbean and Gulf of Mexico.
The EM-DAT event list was downloaded in August 2009 and NHC data downloaded in February 2010. Event lists were reconciled to create a combined list of events from both data sources which were then tabulated and summarized for 1980 through 2009. See https://www.jhsph.edu/refugee/natural_disasters/_Historical_Event_Review_Overview.html for the database of tropical cyclone events. A total of 948 events were retained from EM-DAT and 331 from the NHC. For cyclone impacts reported by EM-DAT, zeroes were treated as missing values because they were used as placeholders and their inclusion in the analysis could contribute to the under estimation of tsunami impacts.
To assess risk factors for cyclone-related mortality the following categories were used: none (0 deaths), low (1-9 deaths), medium (10-99 deaths) and high (≥100 deaths). Bivariate tests for association were performed using chi-square for categorical and ANOVA for continuous measures. All covariates, with the exception of World Bank developmental level which was highly correlated with per capita GDP were subsequently included in a multinomial logistic regression model to assess relative risk of mortality at a given level as compared to events with no deaths. Analyses were performed using Stata Statistical Software, Version 11.0 9.
Systematic Literature Review
Key word searches in MEDLINE (Ovid Technologies, humans), EMBASE (Elsevier, B.V., humans), SCOPUS (Elsevier B.V., humans), and Web of Knowledge/Web of Science (Thomson Reuters) were performed to identify articles published in July 2007 or earlier that described natural hazards and their impact on human populations. Following the systematic review, a further search was conducted to identify relevant articles published through October 2012. One search was done for all the five natural hazards described in this set of papers. This paper describes the results for cyclones. The systematic review is reported according to the PRISMA guidelines. Key words used included natural hazard(s), natural disaster(s), volcano(es), volcanic, volcanic eruption, seismic event, earthquake(s), cyclone(s), typhoon(s), hurricane(s), tropical storm(s), flood(s), flooding, mudslide(s), tsunami(s), and tidal wave(s). Key words included for impact on humans were affected, damage(d), injury, injuries, injured, displaced, displacement, refugees, homeless, wounded, wound(s), death(s), mortality, casualty, casualties, killed, died, fatality, fatalities and had to be used in either the title, abstract or as a subject heading/key word. The search resulted in 2,747 articles from MEDLINE, 3,763 articles from EMBASE, 5,219 articles from SCOPUS, and 2,285 articles from ISI Web of Knowledge. Results from the four databases were combined and duplicates were excluded to yield a total of 9,958 articles.
Title screening was performed to identify articles that were unrelated to natural disasters or human populations. Each title was screened by two independent reviewers and was retained if either or both reviewers established that inclusion criteria were met. To ensure consistent interpretation of inclusion criteria, percent agreement was assessed across reviewers for a small sample of articles, and title screening began after 80% agreement on inclusion was achieved. A total of 4,873 articles were retained for abstract review. Articles were excluded if they met one or more of the following criteria: language other than English; editorial or opinion letter without research; not related to human populations; individual case report/study; focus on responders; and not related to human or environmental vulnerabilities or impacts of hazards. Each abstract was then screened by two reviewers and retained if either or both established that inclusion criteria were met. Included abstracts were coded for event type, timeframe, region, subject of focus, and vulnerable population focus. A total of 558 cyclone articles were retained for article review; 193 articles focusing on the impacts of cyclones on human populations in terms of mortality, injury, and displacement were prioritized for abstraction. Upon full review, 49 articles were retained including 48 that underwent dual review, standard data abstraction and one that was identified as a review article (Figure 1). The additional review then identified eleven articles through October 2012 that met the inclusion criteria for abstraction in the mortality and injury review. A summary of the final 58 abstracted articles is presented in Table 1.
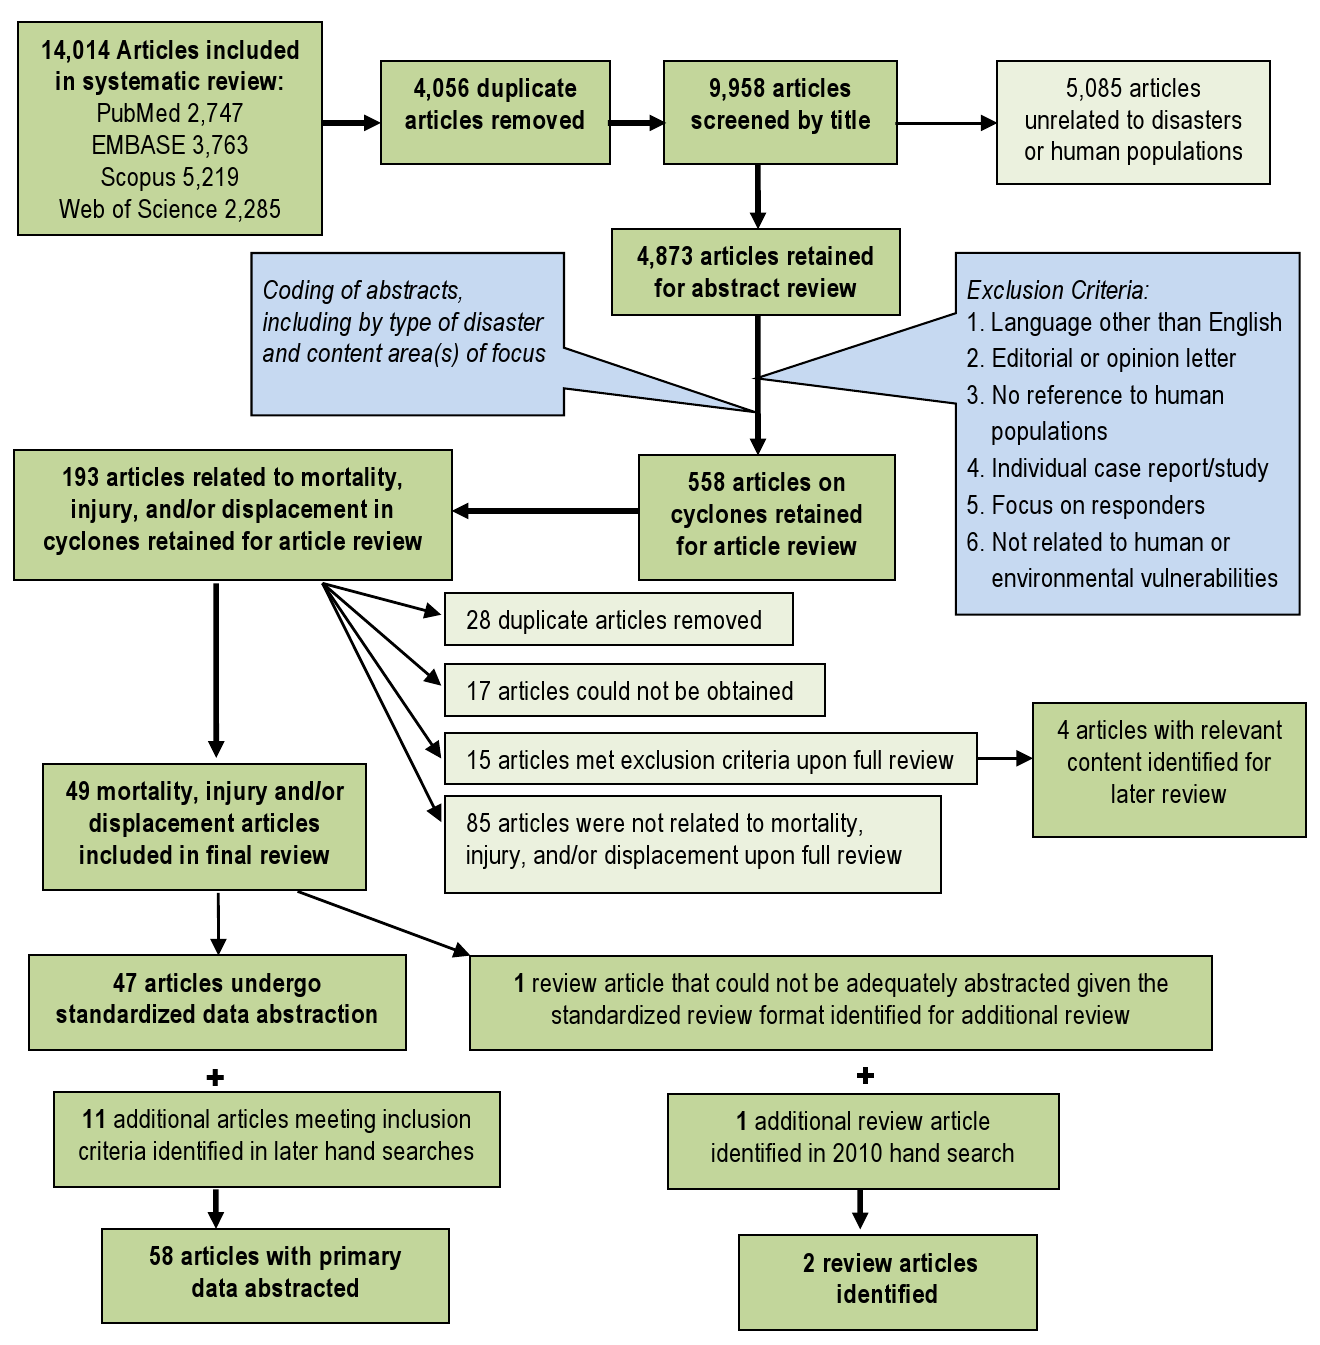
Fig. 1: Overview of the systematic literature review process for cyclones
Publication
Event(s)
Study Summary
Mortality (n=35)
Injury (n=27)
Displacement (n=6)
Mahajani, 197511
Cyclone Tracy, 1974
Post-cyclone Injury management
NR
x
NR
Longmire, 198412
Hurricane Frederic, 1979
Review of injury frequency before and after the hurricane
NR
x
NR
MMWR, 198613
1985Hurricanes Elena & Gloria,
Analysis of hurricane-related emergency room visits resulting in Mississippi, Rhode Island, and Connecticut
x
x
NR
Siddique, 198714
Bangladesh Cyclone, 1985
Examines of risk factors for mortality among island populations
x
NR
x
Longmire, 198815
Hurricane Elena, 1985
Review of injury type and severity
NR
x
NR
MMWR, 198916
Hurricane Hugo, 1989
Assesses cause of death and factors associated with mortality in Puerto Rico.
x
NR
NR
MMWR, 198917
Hurricane Hugo, 1989
Assesses causes of death and factors associated with mortality in South Carolina.
x
NR
NR
Philen, 199018
Hurricane Hugo, 1989
Assesses mortality factors from deaths related to Hurricane Hugo.
x
NR
NR
MMWR, 199219
Hurricane Andrew, 1992
Examines mortality factors in deaths reported by medical examiners in southern Florida
x
NR
NR
Rahman, 199320
Bangladesh Cyclone, 1991
Evaluation of the health effects of the cyclone and tidal wave in Bangladesh.
x
NR
NR
Bern, 199221
Bangladesh Cyclone, 1991
Characterizes factors associated with cyclone-related mortality and identifies prevention strategies
x
NR
NR
Chowdhury, 199322
Bangladesh Cyclone, 1991
Examines mortality following 1991 cyclone and effects of cyclone preparedness
x
NR
NR
Lee, 199323
Hurricane Andrew, 1992
Assesses injuries and illnesses among care seekers at health care facilities
NR
x
NR
Brewer, 199424
Hurricane Hugo, 1989
Describes public health impact on inland areas of North Carolina
x
x
NR
McNabb, 199525
Hurricane Andrew, 1992
Characterizes hurricane related injury and morbidity in Louisiana
x
x
NR
Combs, 199626
Hurricane Andrew, 1992
Describes hurricane related population-based mortality rates
x
NR
NR
Hendrickson, 199627
Hurricane Iniki, 1992
Examines hurricane-related mortality risk
x
NR
NR
Lew, 199628
Hurricane Andrew, 1992
Examines damage, mortality, and displacement in Dade County, Florida
x
NR
NR
MMWR, 199629
Marilyn & Opal, 1995
Injuries and health needs of affected communities in Virgin Islands, Florida, Louisiana and Georgia
NR
x
NR
MMWR, 199630
Marilyn & Opal, 1995
Summarizes and characterizes hurricane-attributed deaths in Florida and US Virgin Islands
x
NR
NR
Smith, 199631
Hurricane Andrew, 1992
Examines demographics effects in Dade County Florida
NR
NR
x
Hendrickson, 199732
Hurricane Iniki, 1992
Uses medical chart data to characterize hurricane related increases in injuries and morbidity
NR
x
NR
MMWR, 199833
Hurricane Georges, 1998
Describe deaths indirectly caused by the hurricane
x
NR
NR
MMWR, 200034
Hurricane Floyd, 1999
Monitoring of illness, injury and death related to the hurricane and subsequent flooding
x
x
NR
Guill, 200135
Hurricane Mitch, 1998
Assesses the impact of Hurricane Mitch on a small Honduran community
x
NR
NR
O’Hare, 200136
Hurricane 07B, India, 1996
Spatial analysis of destruction caused by Hurricane 07B
x
NR
NR
Waring, 200237
Tropical Storm Allison, 2001
Assesses health and medical needs of the affected population
NR
x
NR
Keenan, 200438
Hurricane Hugo, 1999
Assessment of the post-hurricane incidence of traumatic brain injury in children
NR
x
NR
MMWR, 200439
Hurricane Charley, 2004
Assesses causes of and factors with associated with mortality
x
NR
NR
Gagnon, 200540
Hurricane Isabel, 2003
Assesses post-event injuries and injury prevention strategies
NR
x
NR
MMWR, 200541
Hurricane Katrina, 2005
Documents facility-based surveillance efforts of post-hurricane effects
NR
x
NR
MMWR, 200542
2004 Florida hurricanes (4)
Examines demographic and epidemiologic risk factors for hurricane outcomes
NR
x
NR
Smith, 200543
Hurricane Isabel, 2003
Hurricane-related emergency department visits and storm impact on hospital admission rates
NR
x
NR
Waring, 200544
Tropical Storm Allison, 2001
Utility of geographic information systems (GIS) in rapid epidemiological assessments
NR
x
NR
Brodie, 200645
Hurricane Katrina, 2005
Examines demographics and health needs of evacuees in Houston area shelters
NR
x
NR
Jani, 200646
Hurricane Isabel, 2003
Analysis of mortality to identify modifiable risk factors and injury prevention measures.
x
NR
NR
MMWR, 200647
2004-5 Florida hurricanes (8)
Assessment of carbon monoxide poisonings reported to Florida Poison Control
NR
x
NR
MMWR, 200648
Hurricane Katrina, 2005
Review county level mortality data to characterize causes of death and storm impact.
x
NR
NR
MMWR, 200649
Hurricane Katrina, 2005
Describes carbon monoxide incidents and risk factors
x
NR
NR
MMWR, 200650
Hurricane Katrina, 2005
Describes effectiveness of post-hurricane surveillance activities in three counties of Mississippi
x
x
NR
MMWR, 200651
Hurricane Katrina, 2005
Post-hurricane surveillance of patient-specific data on injury and morbidity in greater New Orleans
x
x
NR
MMWR, 200652
Hurricane Katrina, 2005
Rapid assessment of clinical care needs, public health services, and housing assistance for San Antonio evacuees
NR
NR
x
Sullivent, 200653
Hurricane Katrina, 2005
Documents hurricane-related causes of injury using an active surveillance system
NR
x
NR
Vest, 200654
Hurricane Katrina, 2005
Describes the prevalence of acute signs and symptoms, chronic conditions, and risk factors those in shelters
NR
NR
x
DeSalvo, 200755
Hurricane Katrina, 2005
Examine post-Katrina rates and predictors of PTSD symptoms in New Orleans residents
NR
NR
x
Ghosh, 200756
Hurricane Katrina, 2005
Needs assessment of the Katrina-displaced population arriving in Denver
NR
NR
x
Sharkey, 200757
Hurricane Katrina, 2005
Epidemiologic review for risk factors for mortality in Hurricane Katrina
x
NR
NR
Brunkard, 200858
Hurricane Katrina, 2005
Review of Hurricane Katrina deaths and risk factors in Louisiana
x
NR
NR
Eavey, 200859
Hurricane Katrina, 2005
Comparison of pre- and post- Katrina mortality rates and causes
x
NR
NR
Ragan, 200860
Florida, 2004-05
Mortality surveillance for eight Florida hurricanes occurring in 2004 and 2005
x
NR
NR
Das, 200961
1999 cyclone in Orissa, India
Mangrove ecosystems and mortality reduction in cyclones
x
NR
NR
Shen, 200962
China, 2006
Risk factors for injury during Typhoon Saomei
NR
x
NR
Uscher-Pines, 200963
Hurricane Katrina, 2005
Injury and displacement among older adults following Hurricane Katrina
NR
x
x
Kanter, 201064
Hurricane Katrina, 2005
Child mortality following Hurricane Katrina
x
NR
NR
Kim, 201065
Cyclone Nargis, 2008
Injury and illness among Burmese patients presenting for care following Cyclone Nargis
NR
x
NR
Norris, 201066
Hurricane Ike, 2008
Prevalence of disaster related illness and injury related to Hurricane Ike
NR
x
NR
Faul, 201179
Hurricane Katrina 2005
Review of injuries that presented at the Houstan, Texas, Reliant Park clinic.
NR
x
NR
Zane, 201180
Hurricane Ike,Texas, 2008
CDC Surveillance data on mortality in hurricane Ike
x
NR
NR
Results
Historical Event Review
During the 30-year observation period (1980-2009), 1,080 cyclones were recorded with an average of 32 (range 16-66) annually. The number of events reported annually by NHC and EM-DAT increased over time as did the total number of events; NHC reported a lower number of events because their focus area is the Americas (Figure 2). Both the frequency of cyclones and affected population size increased over time; cyclone related mortality did not follow a similar trend and mortality peaks were associated with infrequent high-impact events such as cyclone Gorky (Bangladesh, 1991) and cyclone Nargis (Myanmar, 2008) (Figure 3).
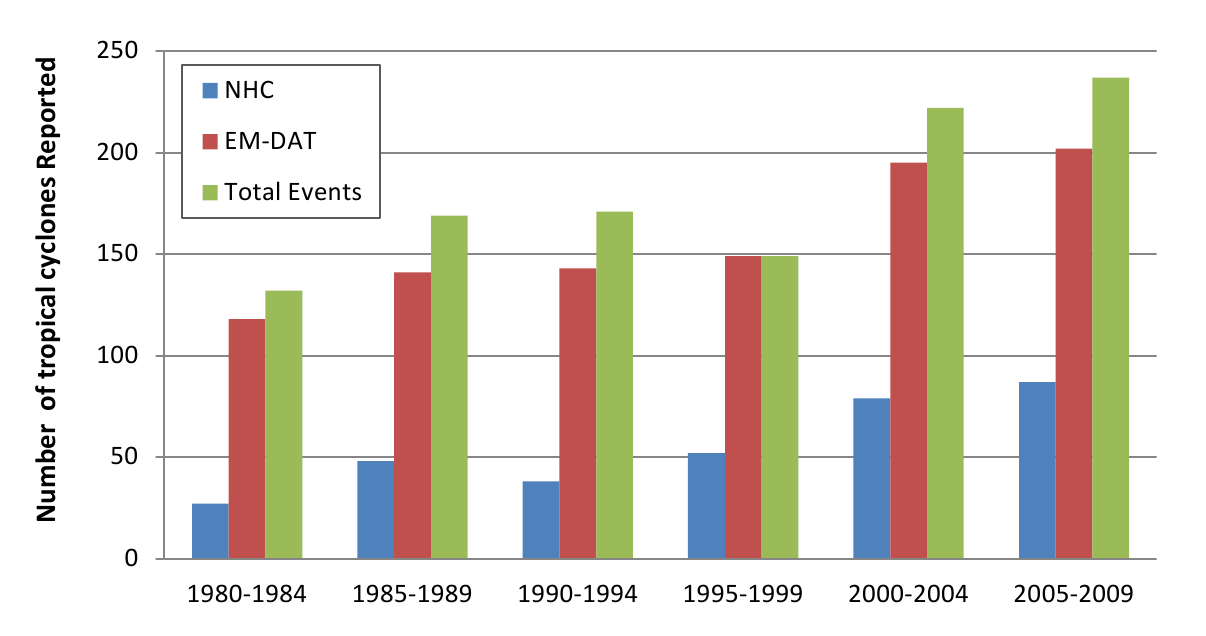
Fig. 2: Tropical cyclone reporting frequency, 1980 -2009 (n=1080)
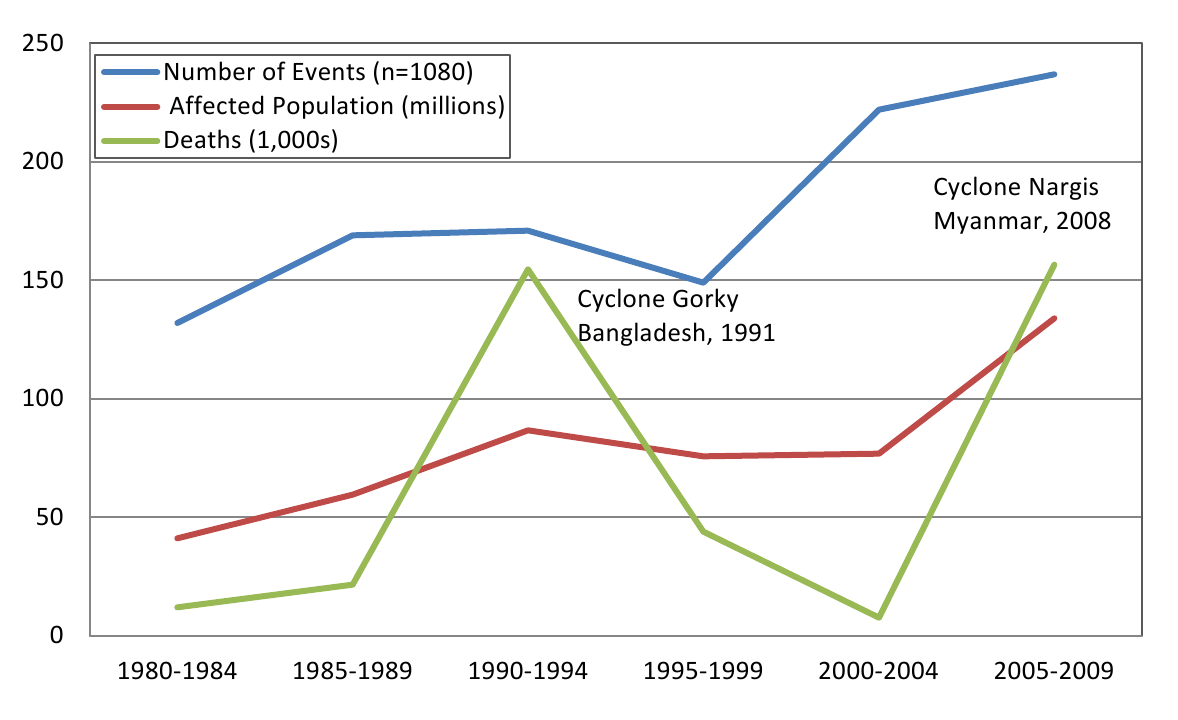
Fig. 3: Tropical cyclones and their affects on human populations
By decade, 42,5% (n=459) of events occurred in the 2000s, 29.6% (n=320) in the 1990s, and 27.9% (n=301) in the 1980s. The impact of cyclone events across regions is summarized in Figure 4. The World Health Organization regions of the Western Pacific (WPRO) and the Americas (AMRO) accounted for more than 80% of all reported events. The mortality was greatest in the SEARO regions while only 8% of deaths occurred in the AMRO region despite accounting for 37% of all events occurring there. Although the SEARO region accounted for only 9% of all events, it had 53% of the affected population and 80% of all deaths.

Fig. 4: Cyclones and their impact on human populations by region, 1980-2009*
*Regions as defined by the World Health Organization
The overall impact of cyclones on human populations is summarized in Table 2. An estimated 466.1 million people were reported to be affected by cyclones between 1980 and 2009, including 20.1 million that were rendered homeless. These figures likely substantially underestimate the true impact because estimates of the total affected population and the homeless population were reported in 78.7% (n=799) and 26.2% (n=283) of events, respectively. The distribution of the affected population was highly skewed: when reported on average 592,830 people affected per storm, but the calculated median was only 20,000 per event. Monetary damages were reported by EM-DAT in 15.4% of events and evacuation was reported by NHC in only 2.3% events so these outcomes were not assessed because of insufficient reporting.
*Best estimate figures are based on the highest reported number of deaths or injuries in an event from either EM-DAT or NHC; homeless and total affected populations are reported only by EM-DAT.
Cumulative Impact of Tropical Cyclones, 1980-2009
Human Consequence
# of Events w/ information reported(%)
Best Estimate *
Deaths
1049** (97.1%)
412,644
Injuries
340 (31.56%)
290,654
Homeless
267 (24.7%)
20,160,878
Total Affected
801 (74.2%)
466,098,192
Reporting by Source and Average Outcomes per Cyclone, 1980-2009
Human Consequence
# of Events** (%)
Median
Mean
Range
Deaths, all events
1049
97.10%
8
346
0-138,866
Reported by EM-DAT
925
85.60%
11
433
0-138,866
Reported by NHC
292
-27.30%
3
69
0-5,677
Events with deaths
965
89.40%
14
430
1-138,866
Reported by EM-DAT
860
79.60%
15
483
1-138,866
Reported by NHC
181
16.80%
5
87
1-5,677
Events with Injuries
397
36.80%
46
775
1-138,849
Reported by EM-DAT
338
33.90%
56
834
1-138,849
Reported by NHC
30
32.40%
3
309
1-7,242
Homeless, all events
283
26.20%
5,000
77,907
25-5,432,375
Total Affected, all events
799
78.70%
20,000
592,830
2-29,622,000
Mortality and Injury. Mortality data had the most complete reporting. When the two sources were combined, information on deaths was reported in 97.1% of events and deaths occurred in 89.4% of cyclones between 1980 and 2009. Overall, 412,644 deaths were reported in the historical event review, the vast majority from EM-DAT. For cyclones where mortality was reported, there was a median of 14 deaths per event (mean = 430, 5% trimmed mean= 41, range 1-138,849) when using the highest reported death toll. The two deadliest storms, Cyclone Gorky (Bangladesh, 1991; 138,866 deaths) and Cyclone Nargis (Myanmar, 2008; 138,366 deaths) accounted for two-thirds of cyclone deaths between 1980 and 2009. The next order of high mortality events with 10,000-15,000 deaths included Hurricane Mitch (Honduras, 1998) and a cyclone in Bangladesh (1985) and there were 16 events with 1,000-9,999 deaths over the 30 years. In total, the 1.9% (n=20) of events with mortality >1000 accounted for 83.9% of all cyclone deaths, suggesting that cyclone mortality is concentrated in infrequent and extreme events.
Injury data were available in 397 (36.8%) events, with a total of 290,654 cyclone-related injuries documented. When reported, there was a median of 46 injuries per storm (mean=775, 5% trimmed mean=200, range 1-138,849) when the highest reported figure was used. To estimate the total number of injuries, it was presumed that injuries occurred in events with reported deaths. There were 965 cyclones with reported fatalities. When the median and 5% trimmed mean for injuries were applied to the remaining 568 events with fatalities but no injury reporting, it was estimated that between 28,400 and 113,600 unreported cyclone related injuries may have occurred between 1980 and 2009.
Ordinal logistic regression was used to assess country-level characteristics associated with storm mortality categories (Table 3). All country-level variables were found to be significantly associated with mortality. The mean GDP per capita was $13,191 (SD 17,709, range 1433-99,383) and the mean Gini index score 10, which is a measure of equality, was 41.3 (SD 7.3, range 24.9-64.3). When assessed by mortality category, the highest per capita GDP occurred in the no deaths category while the lowest was observed in the ≥100 death category (p<.001), suggesting that the cyclone mortality risk is concentrated in lower income countries.
Characteristic
0 deaths (n = 172)
1-9 deaths (n = 383)
10-99 deaths (n = 370)
≥100 deaths (n = 155)
Decade, n (%)
1980
43 (25.0%)
85 (22.2%)
109 (29.5%)
64 (41.3%)
1990
48 (27.9%)
99 (25.8%)
117 (31.6%)
56 (36.1%)
2000
81 (47.1%)
199 (51.9%)
144 (38.9%)
35 (22.6%)
WHO Region, n (%)
Africa
7 (4.1%)
23 (8.2%)
28 (7.6%)
8 (5.2%)
Americas
105 (61.0%)
198 (51.7%)
95 (25.7%)
26 (16.8%)
Europe / E. Mediterranean
6 (3.5%)
10 (2.6%)
6 (1.6%)
4 (2.6%)
South East Asian
8 (4.7%)
13 (4.6%)
46 (12.4%)
34 (21.9%)
Western Pacific
57 (33.1%)
147 (38.4%)
198 (53.5%)
83 (53.5%)
GINI Index, mean (SD)
0 (0)
41.6 (7.7)
40.4 (7.6)
41.2 (6.7)
GDP per capita, mean (SD)
0 (0)
14,612 (16,653)
9,532 (15,012)
15,199 (20,057)
Relative risk ratios for cyclone mortality from the final multinomial logistic regression model, using events with no deaths as the reference category, are presented in Table 4. Per capita GDP, WHO region and event decade were significantly associated with excess mortality, in particular for the mid- and high level mortality categories (10-99 deaths and ≥100 deaths, respectively). The proportion of events with mid- to high mortality levels decreased in the 1980s and 1990s, but during the 2000s, the relative risk ratios of mid- and high level mortality events were statistically similar to the 1970s. The Western Pacific region, where the highest proportion of mid- and high level mortality events occur, was used as the reference category for regional comparisons. Relative risk ratios for mid-level mortality events were significantly lower in the European/Eastern Mediterranean, Americas, and Southeast Asia regions as compared to the Western Pacific. Relative risk ratios for high level mortality events were statistically similar to the Western Pacific for all regions except the Americas with significantly lower risk. No significant relationship between GINI index and mortality risk was observed whereas GDP was inversely associated with risk of high mortality events.
*Model Statistics: N=953, chi-square p-value
1-9 deaths vs. no deaths
10-99 deaths vs. no deaths
≥100 deaths vs. no deaths
RRR (95%CI)
p-value
RRR (95%CI)
p-value
RRR (95% CI)
p-value
Decade
1980
Reference
Reference
Reference
1990
2.15 (0.89-5.18)
0.087
2.89 (1.18-7.03)
0.019
6.06 (1.95-18.72)
0.002
2000
1.93 (0.92-4.27)
0.098
1.31 (0.54-2.66)
0.597
1.03 (0.34-.3.06)
0.937
WHO Region
Western Pacific
Reference
Reference
Reference
Africa
1.04 (.11-1.97))
0.029
0.68 (0.32-1.44)
0.317
1.93 (0.73-5.09)
0.182
Americas
0.59 (.25-1.13)
0.054
0.38 (0.18-.82)
0.991
1.02 (0-1.09)
0.989
Europe / E. Mediterranean
0.67 (.14-1.26)
0.025
.25 (0.05-1.13)
0.073
1.79 (0.41-7.84)
0.437
South East Asia
0.75 (.16-1.19)
0.006
1.41 (0.49-4.04)
0.519
2.13 (0.80-5.66)
0.003
Gini Index
1.01 (.97-1.06)
0.203
0.97 (0.92-1.02)
0.21
0.97 (0.91-1.04)
0.382
GDP per capita
0.999 (.999-1.0)
0.936
0.999 (.999-.999)
<.001
0.999 (.999-.999)
<.001
Systematic Literature Review
Mortality. Among articles meeting inclusion criteria for full review (n=56), 34 reported mortality data including 16 that provided information on direct or indirect causes of death (Table 5) and 10 that reported sex-specific mortality counts or risk (Table 6) 11–66,80. Most articles provided some information about the distribution of deaths across population subgroups or an individual’s location at the time of the event; with one exception, all articles reported on hurricane impact in the United States. When aggregated, 54% of US hurricane deaths were classified as direct deaths and 43% as indirect deaths. Among direct deaths, drowning was the most common cause of death, accounting for 59% of direct deaths followed by trauma, which accounted for 39% of direct deaths. Among indirect deaths cause of death was less frequently reported however trauma was the most common cause of indirect death followed by motor vehicle accidents, carbon monoxide poisoning, fires or burns, and electrocution. When examined by sex, an increased mortality risk among men was observed in the eight of the ten studies that reported deaths by sex; males accounted for 59.4% of US hurricane deaths reported (Table 6). Studies that reported sex-specific mortality in the 1991 Bangladesh cyclone observed a higher mortality rates among females (71/1000) compared to males (15/1000) 20,21,22. Age was associated with increased mortality risk in numerous studies where both children 20,21,22, and older adults 22,57,58,60, experienced disproportionate mortality. Other risk factors for mortality included residence type 22,35, not reaching shelter 14,21, geographic location 20,36, race 57,58, flood level 57, and deforestation 28,61.
*direct deaths were assumed to have occurred during the event; **trauma includes blunt and penetrating trauma, crush injuries, and deaths from falling objects/debris; ***excluded from mortality totals to avoid double counting of deaths report in other sources
Event and Reporting Information
Total Deaths
Direct Deaths
Indirect Deaths
Mortality Timeframe
Publication
Storm
Data Source(s)
N
By Cause
N
By Cause
Pre-
During
Post
NR
MMWR, 198513
Elena, 1985
ER Depts, Mississippi
3
0
3
2 motor vehicle accidents, 1 electrocution
0
0
0
3
MMWR, 198916
Hugo, 1989
Medical Examiner, Puerto Rico
9
2
2 drownings
7
7 electrocutions
0
3
6
0
MMWR, 198917
Hugo, 1989
Medical Examiners and Coroners, S Carolina
35
13
6 drownings, 7 blunt trauma
16
3 trauma, 13 no cause reported
0
13
16
6
Philen, 1990***18
Hugo, 1989
Puerto Rico and S Carolina Medical Examiners & MMWRs
38
15
Not reported
23
Not reported
1
15
22
0
MMWR, 199219
Andrew, 1992
Florida Medical Examiner Offices
19
14
9 trauma, 4 asphyxia, 1 drowning
5
3 blunt trauma, 2 fire
0
14
3
2
Brewer, 1994***24
Hugo, 1989
ER Depts, S Carolina
4
1
1 blunt trauma
3
2 vehicle accidents, 1 intracranial hemorrhage
0
0
0
4
McNabb, 199525
Andrew, 1992
ER Depts and Coroner’s, Louisiana
14
6
6 drownings
8
1 motor vehicle accident, 7 no cause reported
8
6*
0
0
Combs, 199626
Andrew, 1992
Medical examiners and coroners, Florida and Louisiana
36
17
11 blunt trauma, 4 asphyxia, 2 drowning
19
3 falls, 3 fire, 3 vehicle accidents, 3 electrocutions, 2 plane crash, 2 trauma, 1 lightening strike, 1 asphyxia, 1 clean-up
2
17*
1
16
Lew, 1996***28
Andrew, 1992
Medical Examiner, Dade County, Florida
17
15
8 blunt trauma, 4 asphyxiation, 2 drownings, 1 decapitation
2
2 individuals could not be reached by EMS
0
17*
0
0
MMWR, 199648
Marilyn & Opal, 1995
Medical Examiners and Coroner’s, US Virgin Islands & Puerto Rico
34
18
9 blunt trauma, 8 drownings, 1 head trauma
16
7 motor vehicle accidents, 4 falling objects, 3 fires, 1 CO poisoning, 1 fall.
1
18*
7
8
MMWR, 200034
Floyd, 1999
ER Depts, N Carolina
48
36
36 drownings
12
7 motor vehicle accidents, 2 fire, 1 hypothermia, 1 fall, 1 unreported
0
36*
0
12
MMWR, 200439
Charley, 2004
Florida Medical Examiner Offices
25
9
Not reported
16
12 cause unreported, 3 CO poisoning, 1 electrocution
0
9*
0
16
Jani, 200646
Isabel, 2003
Virginia Medical Examiner’s and Health Statistics
30
12
7 drowning, 5 head injuries
18
6 motor vehicle crashes, 3 head/ neck injuries, 1 trauma, 1 heart attack, 7 in power outages
0
12*
0
18
MMWR, 200648
Katrina, 2005
Florida Medical Examiner and Dept. of Forensic Science (Alabama)
19
5
3 drowning, 2 blunt trauma
14
4 vehicle accidents, 2 falling tree, 2 CO poisoning, 1 fall, 1 drowning, 1 sepsis, 1 seizure, 1 traumatic brain injury, 1 asphyxia
0
5*
0
14
Brunkard, 200858
Katrina, 2005
Federal Disaster Mortuary Op. Response Team and Louisiana coroners
986
633
387 drowning, 246 trauma or injury
338
107 heart disease, 46 other illnesses, 185 unspecified Katrina related
7
650
4
325
Ragan, 200860
Florida, 2004-05
Florida Medical Examiners Comm. and Dept. of Health
213
41
27 trauma or injury, 14 drowning
172
86 trauma or injury, 45 non-accidental, 15 CO poisoning, 9 drowning, 7 burns/inhalation
20
66
127
213
Zane, 201180
Texas, 2008
CDC Surveillence data
74
10
8 drowning, 2 Hit by falling tree limb
49
13 carbon monoxide exposure, 8 cardiovascular failure, 28 multiple causes
7
0
67
0
Total Number (Percent)
1545
816
52.8%
693
44.8%
45
746
231
633
Summarized By Cause
Drownings, n=480, 58.8%; Trauma/injury,** n=313, 38.6%; Asphyxia, n=8, 1.0%; Head/ neck injuries, n=6, 0.7%; Other/not reported, n=9, 1.1%.
Trauma/injury,** n=101, 14.6%; Vehicle accidents, n=30, 4.3%; CO poisoning, n=34, 4.9%; Fire/burns, n=17, 2.6%; Electrocution, n=12, 1.7%; Drowning, n=9, 1.3%; Head/neck injuries, n=4, 0.6%; Other, n=250, 36.1%; and Not reported, n=206, 32.0%
2.9%
45.0%
13.9%
38.2%
Source
Storm
Location(s)
Gender most at risk
Deaths by Sex
Summary of gender-related mortality findings
Males
Females
Bern, 199221
Bangladesh, 1991
Bangladesh
Female
Mortality among females was higher than males for all age groups; for females, mortality increased with age.
Chowdury, 199322
Bangladesh, 1991
Bangladesh
Female
The female mortality rate was 71/1000 as compared to 15/1000 among males ages 20-44. Death rates were higher among females, and this was more pronounced in the young and old.
Combs, 199626
Andrew, 1992
Florida and Louisiana
Male
40
15
73% (40/55) of deaths were among males. Male and female mortality rates in Florida were 18.8 and 7.3 per 1,000,000, respectively. Male and female mortality rates in Louisiana were 5.8 and 1.2 per 1,000,000, respectively.
MMWR, 199630
Marilyn and Opal, 1995
Puerto Rico, Florida, N Carolina, Alabama, Georgia
Male
21
6
78% (21/27) of the deceased were male.
MMWR, 200034
Floyd, 1999
North Carolina
Male
38
14
73% (38/52) of the deceased were male.
MMWR, 200439
Charley, 2004
Florida
Male
24
7
77% (24/31) of the deceased were male.
Jani, 200646
Isabel, 2003
Virginia
Male
24
8
77% (24/32) of the deceased were male.
Sharkey, 200757
Katrina, 2005
Louisiana
Male
Males accounted for 65% of non-elderly deaths and 48% of the nonelderly population; 47% of elderly deaths were among males who accounted for 38% of the elderly population
Brunkard, 200858
Katrina, 2005
Louisiana
Male
512
459
53% (512/971) of the deceased were male.
Ragan, 200860
2004 & 2005 hurricanes
Florida
Male
162
51
76% (162/213) of deceased were male.
Zane, 201180
Ike, 2008
Texas
Male
52
22
70% were male.
Total
873
582
60%
40%
Injury. Injury data were reported in 28 of the 58 articles, 15 of which provided information on injury type (Table 7). Most articles reported that the majority of injuries were minor but it was not possible to aggregate injury data due to the different study designs, reporting methods, and data sources. Lacerations, wounds, contusions, blunt trauma, animal/insect bites, and motor vehicle injuries were among the most frequent types of injuries reported. The three population based surveys estimated injury rates between 3.8 and 4.5% 37,62,66. When assessed by age, injury rates were highest among middle age adults in numerous studies 13,25,32,40,53. Males were at higher risk for injury 13,24,25,54; in all studies but one in the studies that reported gender 22. Location was a risk factor for injury in many reports, including administrative unit or location relative to storm path 42, within a city 24,25,44, and being outdoors 25. Race was associated with increased injury risk in several studies, however, the race most at risk for injury varied 24,25,26,56. Only three articles presented injury data on storms outside the United States 11,62,65, reflecting the paucity of information from less developed countries and a need for additional research in cyclone injury epidemiology in these regions.
Publication
Event(s)
Study Type
Injuries Reported
Types of Injuries Reported
Additional Injury Findings
Mahajani, 197511
Cyclone Tracy, 1974
Facility, inpatient only
145
60 lacerations (41%), 50 blunt trauma (34%), 14 spinal cord injuries/ paraplegia (10%), 6 pelvis fractures (4%), 3 penetrating wounds (2%), 3 closed abdominal injuries (2%), 2 head injuries (1%), 1 amputation (<1%).
None
Longmire, 198412
Hurricane Frederic, 1979
Facility, ER visits
Not reported
Not reported
Lacerations, puncture wounds, chain saw injuries, burns, gasoline aspiration, gastrointestinal complaints, stings, and spouse abuse were found to increase following the storm.
MMWR, 198613
Hurricanes Elena & Gloria, 1985
Facility, ER visits
484
Lacerations (22%), abrasion or contusion (20%), sprain (14%) and fractures (12%).
89 records were visits related to the storm, 73 were injuries. 26 of 73 patients had lacerations and 11 had fractures.
Longmire, 198815
Hurricane Elena, 1985
Facility, ER visits
2623
Tables not legible
There was a significant increase in the number of patients treated for blunt trauma, chain saw injuries, and lacerations, following the storm.Top of FormBottom of Form
Lee, 199323
Hurricane Andrew, 1992
Facility, ER and outpatient
Not reported
Not reported
Injuries accounted for 15.7% and 23.7% of visits at civilian and military free care sites; among service members, injuries accounted for 36.2% of visits. During the 5 weeks after the hurricane, proportional morbidity from injury decreased.
Brewer, 199424
Hurricane Hugo, 1989
Facility, ER visits
1911
577 wounds (28%), 428 insect stings (21%) 279 sprains (12%), 241 contusions (12%), 177 fractures (8%), and 131 other injuries (6%), and 78 unknown (4%).
88% if hurricane diagnoses were injury related. Incidence of diagnoses varied by age, sex, race and care seeking location.
McNabb, 199525
Hurricane Andrew, 1992
Facility, ER visits
375
184 cuts/lacerations/puncture wounds (49%), 49 sprain/strain/ fracture (13%), 46 contusion/ impact (12%), 24 animal/insect bite (6%), 23 falls (6%), 23 rashes (6%), 15 crush injuries (4%), 10 burns (3%), 1 electrocution (<1%), and 62 other (17%).
Injuries accounted for 86% of non-fatal events. Injury rates were highest among middle age adults (30-39 yrs) and were concentrated geographically in three parishes.
MMWR, 199629
Hurricanes Marilyn and Opal, 1995
Facility, outpatient visits
234
80 lacerations/wounds (34%), 79 sprain/strain/fracture (34%), 37 motor-vehicle related injuries (16%), 38 other (16%).
Of 3265 facility visits, 1084 (33%) were storm-associated injuries involving minor wounds or musculoskeletal trauma.
Hendrickson, 199732
Hurricane Iniki, 1992
Facility, ER and inpatient
1584 post-storm
865 open wounds (55%), 196 sprains (13%) 148 contusions (9%), 122 superficial wounds (8%), 83 insect/animal bites (5%), 81 fractures (5%), 29 foreign bodies (2%), 23 burns (1%), 10 head injuries (1%), and 5 poisoning (<1%).
The relative risk for injury was 6.86 (95 CI: 5.98–7.87) in the two week period after the storm as compared to the two weeks prior to the event. Injury risk increased for all age and sex groups; open wounds and foreign objects injuries had the greatest increase post-storm.
MMWR, 200034
Hurricane Floyd, 1999
Facility, ER visits
~19780
Not reported
33% of ER visits (n=59,398) were injury related; soft tissue injuries accounted for 28% of ER visits (~16,631) and the majority of injuries.
Waring, 200237
Tropical Storm Allison, 2001
Population based post-disaster assessment
17 households
Not reported
Injury types included abrasion/cut/puncture and animal bites; no significant difference in injury was observed between individuals from flooded and non-flooded homes.
Keenan, 200438
Hurricane Hugo, 1999
Ecological
Not applicable
Not applicable
An increase in inflicted and non-inflicted traumatic brain injury was observed among young child in the 6 months following the storm.
Gagnon, 200540
Hurricane Isabel, 2003
Facility, ER visits
51 attributed to the storm
Most common injuries were lower extremity fractures (21%), abrasions/sprains (16%) and rib fractures (12%).
59% of injuries were tree related; most patients had severe and multiple injuries and one-third were admitted. Males age 50-60 had the highest incidence of injury.
MMWR, 200541
Hurricane Katrina, 2005
Facility, ER and outpatient
2018
716 unintentional injuries including cuts, blunt trauma, burns and environmental exposures (36%), 464 falls (23%), 311 bites/stings (15%), 145 vehicle crash injuries (7%), 42 intentional injuries (2%), 27 other toxic exposure (1%), 14 CO poision (1%) and 299 unknown (15%).
14% of visits were relief workers, 34% were residents, and 52% were unknown; relief workers were 5.8 (CI:5.0-6.8) times more like to be treated in nonhospital facilities than residents.
MMWR, 200542
4 Florida hurricanes in 2004
Telephone survey
1690
Not reported
Physical injuries caused by the hurricanes were reported by 4.6% of persons in the hurricane paths and 3.8% not in the hurricane paths.
Smith, 200543
Hurricane Isabel, 2003
Observational cohort, ER patients
Not reported
Not reported
Cases of major trauma decreased by 50% and minor trauma increased by 57% in the 5 day post-landfall period.
Waring, 200544
Tropical Storm Allison, 2001
GIS based post-disaster assessment
Not reported
Injuries were minor; the most common injury types reported were cuts/scrapes/scratches, animal/insect bites, and blunt trauma/bruising.
Persons in flooded homes were 4.8 (CI:1.9-12.8) times more likely to be injured than those living in non-flooded homes.
Brodie, 200645
Hurricane Katrina, 2005
Post-disaster survey in shelters
Not reported
Not reported
33% of evacuees with children and 29% without children were injured; 13% in each group reported serious injuries. Those who evacuated prior to the storm had a 26% injury rate as compared to 37% of those who did not evacuate.
MMWR, 2006 47
8 Florida hurricanes, 2004-05
Health facility
Not reported
Not reported
Increased number of CO poisonings and hydrocarbon fuel exposures were observed in the post-storm periods.
MMWR, 200650
Hurricane Katrina, 2005
Facility, ER and outpatient
10298
Not reported
Between Sept 5-11, there 4,391 visits for injuries, including 1,324 (30%) for tetanus vaccination with no further injury description. Between Sept 12-Oct 11 (after active surveillance) there were 5,907 visits for injuries including 497 (8%) major and 5,410 (92%) minor injuries.
MMWR, 200651
Hurricane Katrina, 2005
Facility, ER and outpatient
4579
2,411 unintentional injuries including cuts, blunt trauma, burns and environmental exposures (53%), 992 falls (22%), 416 vehicle crash injuries (9%), 339 animal/insect bites (7%), 89 intentional injuries (2%), 34 toxic exposure/poisoning (<1%), and 298 unknown (7%).
Residents had a higher proportion of falls and motor vehicle accidents and a lower proportion of unintentional injuries as compared to relief workers.
Sullivent, 200653
Hurricane Katrina, 2005
Facility, ER and outpatient
7543
Cut/pierce/stab (20%), fall (20%), struck by/against/ crushed (11%), bite/sting (9%), and motor-vehicle crash (8%).
The leading mechanisms of injury were falls and cut/stab/pierce sounds, with a greater proportion of residents being injured as compared to relief workers; clean-up was the most common activity at the time of injury for both groups.
Shen, 200962
Typhoon Saomei, China, 2006
Town census
136
71 cut/stabbed (55%), 41 blunt trauma (32%) 13 falls (10%), 3 crushed (2%) and 1 drowning (<1%).
Injury rate of 4.5%, including 7 deaths resulting from injury. Residences facing the sea, end units, non-reinforced windows/doors, and staying near a window/door or in a damaged room were associated with increased injury risk.
Uscher-Pines, 200963
Hurricane Katrina, 2005
Review of medicare claims (older adults)
3870 in the year following the storm
1678 sprains/strains (43%), 1026 other fractures (27%), 980 lacerations (25%), and 186 hip fractures (5%)
Prevalence of all injury types increased post-storm; displaced storm victims were at increased risk for hip (OR 1.53, CI: 1.10-2.13) and other (OR 1.24, CI: 1.07-1.44) fractures.
Kim, 201065
Cyclone Nargis, 2008
Outpatient medical record review
128
Not reported
5% of patients had trauma/injuries of which 29% were directly related to the cyclone
Norris, 201066
Hurricane Ike, 2008
Population based survey
37
Not reported
Injury rate of 3.8%; risk of injury increased with damage and decreased with evacuation.
Faul, 201179
Hurricane Katrina, 2005
Outpatient medical record review
1130
Injuries to the elbows/wrist/hand/finger (rate = 38.9; 95% CI = 28.3-52.2), face/trunk/shoulder/upper arm (rate = 31.8; 95% CI = 22.3-44.1), and leg/foot/toe (rate =151.2; 95% CI = 129.4-175.7).
Significantly more wound injuries to the lower extremities (rate = 13.7; 95% CI = 11.6-16) and upper limbs (rate = 6.5; 95% CI =5.1-8.2).
Discussion
Main Findings
In the 30 year period between 1977 and 2009, approximately 466 million people were affected by cyclones; 20.1 million left homeless, 412,000 people died and 290,000 were injured, excluding an estimated 28,000 to 114,000 unrecorded injuries. The mortality estimate presented in this study is consistent with recent estimates in other studies 67, but the numbers injured and displaced are likely gross underestimates given the low frequency with which these figures are reported. Findings from the historical event review are also consistent with previous observations that cyclone mortality varies by region, economic development level, and event severity.Cyclone impacts were concentrated in the Asia-Pacific region and the majority of fatalities occurred in developing nations. High mortality events, with death tolls in excess of 1000, occur in less than 2% of events and more than two-thirds of all cyclone deaths between 1980 and 2009 occurred in two events (Cyclone Gorky, Bangladesh 1991 and Cyclone Nargis, Myanmar 2008). The number of cyclones and deaths increased each decade but the average number of deaths per storm decreased. Human vulnerability to cyclones will increase in future years due to population growth, urbanization, increased coastal settlement, poverty, and changing weather patterns which is associated with an increase in the number of high intensity cyclones.
A significant disparity between cyclone mortality in developing and developed nations persists, though apart from simple casualty counts there is little information available on the epidemiology of cyclone morbidity and mortality in less developed countries. This indicates a need for additional research outside of the US. The United Nations Development Program (UNDP) identified 29 developing nations and four developed nations that are at risk for cyclones 67 but 42% and 27% of cyclone deaths in the past two centuries have occurred in Bangladesh and India, respectively 68. Additionally, the majority of high-fatality storms occurred in the latter half of the 20th century though no developed nation sustained more than 1000 deaths from a cyclone in this time period67,69. The leading explanations for regional differences in mortality is the size of the at risk population and the capacity for pre-event evacuation. Higher population densities in the Western Pacific and South East Asia where dense settlements in low lying areas are associated with increased risk of death in from storm surge 70,71. A higher economic development among the countries in the Americas is associated with lower regional mortality rates because of increased capacity to evacuate. Prior to the implementation of early warning, evacuation, and shelter systems an estimated 90% of cyclone mortality was attributed to storm surge drowning 72,73,74,75,76. Improvements in forecasting, and early warning systems and in evacuation and shelter procedures, particularly in developed countries, have reduced storm-surge related mortality and increased proportional morbidity and mortality in the post-impact period 16,19,69.
Comparison with Previous Reviews
Findings of this review were contrary to the conclusions of other recent reviews which concluded that most storm-related mortality in developed countries occurs in the post-impact period 69. In the systematic literature review, 79% of the 946 included deaths where storm phase was reported occurred during the impact period. Direct and indirect deaths, respectively, accounted for 56% and 44% of deaths (n=1450 deaths where cause was reported) and the primary causes of death were drowning (33%), direct injuries or trauma (21%), and indirect injuries or trauma (7%). Studies that included gender breakdown for cyclone-related deaths, most of which are accounts of cyclone events in the United States, consistently reported greater proportion of male as compared to female deaths; when aggregated, males accounted for 59% of reported US hurricane deaths. In less developed countries females face a greater mortality risk 21,22. An increased risk of death in younger 20,21,22, and older populations 22,57,58,60, was also observed which is consistent with broader natural disaster mortality trends. However, it is important to note that primary research on cause and timeframe of death as well as demographic and other factors associated with increased mortality risk is limited almost completely to the United States. Future studies on the human impacts of cyclones should be focused in Southeast Asia and the Western Pacific, the regions where the majority of cyclone impacts occur.
While minimal data on cyclone-related injuries and mortality is available from less developed settings, it can be presumed that developing nations also bear the burden of cyclone-attributable injury where the frequency and severity of injuries are inversely related to degree of physical protection 69. Minor trauma is common among the injured, including lacerations, abrasions and contusions, puncture wounds, and sprains and fractures 11,13,24,25,29,32,40,41,51,53,62,63. The majority of those injured in cyclones can be treated on an outpatient basis and do not require sophisticated surgical or inpatient care 5,77. Reported causes of death and injury in more developed countries during the post-impact phase include blunt trauma, vehicle accidents, carbon monoxide poisoning, burns and fires, electrocution, and chain-saw injuries. As compared to needs for food, water, shelter, and sanitation, injuries are not usually a major public health problem in the post-impact phase 78 This suggests and that mobile field hospitals and specialized surgical teams may be ineffective responses and that non-medical relief may be a more appropriate strategy for morbidity and mortality reduction in the aftermath of cyclones 5.
Limitations
The availability and quality of data has likely increased and improved over time, however, in many events deaths, injuries, and affected population size are unknown or unrecorded. For most events no data were reported for injured, displaced, and affected populations, contributing to underestimation of impacts. Inconsistencies and errors were common in data from different sources that called into question the reliability of available data. In some cases inclusion criteria and definitions were not ideal which created difficulties in reconciling event lists. Challenges were encountered when modeling cyclone mortality including a non-normal distribution, which necessitated analysis with a categorical outcome. Information on 2007-2009 GDP and 2009 GINI index were used for analysis regardless of the event year, but these values may have been different for events in the 1980s. Additionally, some countries did not exist or have merged with other nations since the 1980s and many of the smaller island countries in the Caribbean are territories of European countries which necessitated the use of GDP, GINI, and development levels which may not be representative of realities in the cyclone affected area and/or time period. When combined with uncertainty in the historical record and the relative paucity of primary research focusing on cyclone impacts in heavily affected Asian region, conclusions that can be drawn about cyclones impacts on human populations are limited. Other principal limitations of the literature review are 1) that an in-depth quality analysis of all reviewed articles was not undertaken, and 2) the fact that only English language publications were included which likely contributed to incomplete coverage of studies published in other languages originating from low and middle income countries.
Conclusions
Analysis of the impact of cyclones on human populations is challenging given the paucity of data from the most affected regions, the occasional occurrence of extreme high mortality events, and the reporting inconsistencies including both lack of standardized definitions and temporal changes in collection procedures, completeness and accuracy of data. However, even with this under-representation the impact of cyclones is huge, with 466 million people affected, 412,644 deaths and 290,654 injuries were reported as a result of cyclones between 1980 and 2009. The primary cause of cyclone-related mortality in both developed and less developed countries was storm surge drowning. In more developed countries an increased proportion of deaths and injuries were observed in the aftermath of cyclones as a result of improved early warning systems and evacuation. Male gender was associated with increased mortality risk in developed countries, whereas female gender was linked to higher mortality risk in less developed countries. Both older and younger population sub-groups also face an increased mortality risk.
Cyclones have significantly impacted populations in Southeast Asia, the Western Pacific, and the Americas regions over the past quarter of a century with less developed nations in Asia bearing the majority of the mortality and injury burden. Additional preparedness and mitigation strategies, particularly in less developed countries where the majority of cyclones occur, can lessen the impact of future events. In particular, improvements in forecasting, early warning systems, evacuation and shelter procedures, and public education on safety precautions and post-impact hazards could reduce cyclone-related morbidity and mortality in future decades.
Competing Interests
The authors have no competing interests to declare.
Correspondence
Shannon Doocy, Johns Hopkins Bloomberg School of Public Health, 615 N. Wolfe St, Suite E8132, Baltimore, MD 21230. Tel. 410-502-2628. Fax: 410-614-1419. Email: [email protected].
Introduction
The international risk and disaster community appears to be faced with an increasing number of extreme events, with ever greater numbers of people being affected as a consequence [1] . Moreover, the shift in emphasis within disaster management towards planning and preparedness has exacerbated the need for reliable data on disaster impacts to inform policy-makers and practitioners at all stages. Reliable knowledge about what happened in past disasters may help in the planning for the future.
However, it is often difficult to establish reliably the scale and impact of natural disasters. This is in part due to the large variety of potential data sources available, which can be difficult to navigate effectively and the differences between these sources. This has produced a voluminous yet inconsistent evidence base for policy-makers and practitioners in the field to draw upon and runs the risk of undue emphasis on the output from a single source.
Some of the inconsistencies are due to shortcomings in the disaster data itself and include lack of standardisation in collection methodologies and definitions, as well as the absence of a single reliable source of verified data [2] . Moreover, the databases themselves are hosted by a variety of organisations, with different disciplinary affiliations and scientific traditions. Individual databases are usually set up with distinct objectives, which may be inconsistent with those of other databases. It is not surprising, therefore, that it is often difficult to compare outputs across databases and this has been found in previous comparisons of disaster databases[3][4] . However, this lack of shared focus makes it difficult to come to a consensus on the range and magnitude of disaster impacts and, as a result, to have confidence in the estimates presented.
Recognizing some of these issues, the United Nations International Strategy for Disaster Reduction (UNISDR) identified the need for a closer interface between science and policy at the second session of the Global Platform for Disaster Risk Reduction [5] . In 2011, the Science and Technical Committee of the UNISDR re-iterated the ongoing need for review and consolidation of the various disaster information sources and databases, in order to improve the consistency, comparability, quality assurance and value of the data available to the international risk and disaster community.
Challenges in ‘managing’ data or evidence are not exclusive to the field of disasters. In healthcare, for instance, the volume of research can be overwhelming – as an illustration – the world’s largest repository of reports of studies of healthcare interventions, the Cochrane Central Register of Controlled Trials (CENTRAL), now contains more than 600,000 records and published reports of trials are increasing at the rate of more than 25,000 per year. Similarly, the World Health Organisation (WHO) hosts the International Clinical Trials Registry Platform (ICTRP). Considerable increases are also apparent in the number of reports of other types of health related research.
One of the solutions to this problem in health care has been the increasingly common conduct of systematic reviews, led by the work of The Cochrane Collaboration [6] , but with many others now also working on the more than 2500 systematic reviews produced each year [7] .
The aim of this paper
In the context of the overarching aim of the UNISDR to augment the role of science in disaster risk reduction, and the need for effective management of disaster data, this paper investigates how the systematic review approach might be used to overcome the challenges of using the disaster databases to inform decision making. In presenting the systematic review as a method for managing data or evidence we draw on previous explanations of the systematic review as a method of locating, appraising and synthesising evidence following the formulation of a clearly focused question. This helps to maximise the power of the previous research, avoiding undue emphasis on any single source or opinion, and doing so in a transparent way, which allows users of the review to see and, if they wish, critique the methods adopted. Simply, we aim to demonstrate the applicability of the systematic review as a tool to critically appraise the quality of the data presented in the disaster databases and, if appropriate, to combine their findings to produce a summary estimate which is as unbiased as possible.
Whereas authors in the past have undertaken evaluations of disaster databases against set criteria[3][4] , our aim in using the systematic review was to orientate our evaluation to the perspective of a policy-maker or practitioner with specific questions to answer. Different databases may be set up with different objectives in mind, some of which may be competing e.g. speed or precision. Rather than evaluating how well a database meets the objectives it was set up for, our approach seeks to evaluate how well each database or databases collectively are able to meet the information needs of policy-makers or practitioners by interrogating the databases with specific practice-orientated questions in mind.
Evidence in health – the current role of systematic reviews
Types of evidence
Decision-making in health care uses different types of evidence for resolving uncertainties about, for example, effectiveness and cost effectiveness (of an intervention or a programme), need (e.g. to provide a profile of disease burden in a population), epidemiology and risk factors (for particular illnesses or conditions) and user acceptability (of an intervention or means of delivering a service).
Sources of evidence
The most appropriate source of evidence depends very much on the type of evidence required. For instance, where the effectiveness of an intervention is being considered, the evidence will typically come from research using interventional study designs, such as randomized trials. Whereas, evidence of need may more often come from observational studies, and evidence of acceptability or patient experience is most likely to come from qualitative research.
There are various schemes by which the relevance and value of different ‘sources’ of evidence used in health care are ranked. The hierarchy developed by the Centre for Evidence-Based Medicine at Oxford (CEBM) [8] , is very much grounded in the bio-medical tradition of experimental research, building from expert opinion, through case series, case-control studies, cohort studies and randomized trials, to culminate in systematic reviews. However, this hierarchy is not suited to all types of evidence and is not universally appropriate or practicable, for example, in public health where the question being posed may be about prognosis following an environmental exposure, in clinical policy research, or in exploring patient experiences. Alternative schemes for grading evidence have been proposed for use in these and other contexts [9] . However, there is general agreement around the usefulness and position of systematic reviews within each hierarchy, in that this form of research should be at or near the top.
The role of systematic reviews
Systematic reviews help people to overcome the ever increasing “information overload”, by providing summaries of the body of research relevant to a particular topic. Their structured approach, transparency of methods and detailed reporting also allow systematic reviews to minimise the impact that bias might have on their findings and conclusions.
Systematic reviews also provide a means by which the quality of the constituent studies can be appraised in a standard way, allowing the authors to compare, contrast and, if appropriate, combine the findings of the individual studies to provide an overall summary of the topic being investigated, be it the reduction in blood pressure following an anti-hypertensive drug, the increased incidence of cancer following radiation exposure, or the number of people who are likely to develop pressure ulcers while in hospital. Systematic reviews differ from traditional review articles in that they avoid selective emphasis on individual studies or reliance on the personal knowledge of research by the authors of the review.
Systematic reviews are a recognised form of research and involve a well-developed series of steps to minimise bias and to maximise their relevance and reliability [10] . Key steps include the formulation of a clear question and the associated eligibility criteria for the review, a rigorous and wide-ranging search for the evidence, its appraisal, synthesis and summary (including statistical analyses, or meta-analyses, where appropriate), and the interpretation of the findings, which might include implications for practice[7][11][12] . As a result, systematic reviews have become a key bridge between individual research studies and decision-making in healthcare [13] . Although the majority of systematic reviews in health care relate to questions about the effectiveness of interventions, many also exist in other areas noted above [7] .
Another key outcome of the systematic review process is that it can highlight an absence of evidence and suggest areas for further research.
Evidence in disasters – the proposed role for systematic reviews
Types of evidence
The disaster community is pluralistic with a range of disciplines contributing, with different traditions of enquiry, different epistemological leanings, languages and tools. From a health sector perspective, the types of evidence that are useful to practitioners and policy-makers in planning for and responding to disasters is the same as the types of evidence they would find useful in any other setting.
Sources of evidence
The relative contributions, however, from different sources to the overall evidence base is quite different to the non-disaster setting. This is in part a result of feasibility, with interventional studies such as randomized trials often felt to be impossible, unethical or, simply, not feasible[14][15][16] . In such circumstances, evidence on the relative effectiveness of different interventions to guide policy and practice will usually need to come from systematic reviews of research in non-disaster settings. Some efforts are already underway to bring together these resources, so that practitioners can more easily access this knowledge and use it to inform practice in the field. For example, Evidence Aid [17] began as an initiative by The Cochrane Collaboration to provide summaries of evidence on the effects of healthcare interventions for use by the disaster community. Although this is able, to some extent, to draw on the thousands of systematic reviews that exist in health care, other areas of disaster planning and response lack such a large and comprehensive body of systematic reviews. For example, areas such as engineering, communication, shelter and security do not have resources such as those created in health.
There is also a need for the other types of evidence mentioned above, including evidence of need, which may come through observational epidemiological studies, field data or needs assessments [18] , and evidence of impact and consequences, which is also most likely to come from observational epidemiology in the post-disaster setting. As with the need for evidence on the effects of interventions, the requirement for other types of evidence exists in health, and also across all of the other disciplines that make up the disaster community.
The role of disaster databases: contribution to the evidence base
There are various definitions of the term “database”[19][20][21] (but, at a minimum, it is a collection of data, organized with a regular structure that, today, is usually in an electronic format). The disaster databases include information on, for example, the number of people affected, damage to property and infrastructure and the use of resources. However, the scope of what is collected, how it is presented, the validation processes used, accessibility and other such features of the database depend upon the people responsible for the database, and in turn upon their objectives when creating the databases.
Systematic review of disaster databases
Disaster databases record outcomes such as ‘number of people affected’ or ‘economic losses’. These data might include absolute numbers or frequencies – incidence or prevalence – and are, therefore, similar to the types of information gathered in other health contexts. Estimates of absolute numbers or of frequency may come from observational epidemiological studies; or through case registration in clinical databases or disease registries (such as cancer registries or registers of congenital anomalies). Therefore, the format and concept for the disaster databases most closely resemble clinical databases or disease registries and they would be placed alongside other observational methods in the traditional bio-medical evidence hierarchies. This makes them amenable to the systematic review process, and the process has previously been applied to disease registers in other contexts [22] . The key steps of a systematic review are: (i) the systematic identification of all evidence relevant to the question being posed; (ii) critical appraisal of all sources and (iii) synthesis of a summary.
The primary objective of the systematic review is to provide a summary of the evidence relating to a particular question by combining evidence from multiple sources; systematic reviews may also identify a lack of consistency and be used to explore the sources of any heterogeneity. The database is evaluated in the context of its usefulness in answering the question posed.
The questions that might be addressed through a systematic review of the disaster databases include health-related issues such as burden of infectious disease or psychological illness following a disaster, but systematic reviews of the databases could be applied within any domain. Examples of non-health related questions in the disaster setting might be how many bridges were destroyed or how many schools need to be rebuilt.
The step-wise process for applying systematic review methods to a disaster related question can be illustrated by the following outline. This follows the structure used for Cochrane reviews [11] , which are widely regarded as the gold standard for systematic reviews in health care.
The first step is to choose and state a clear question for the review. This might be broad, such as “How many people are affected by disasters?” Alternatively the question may be narrowed down to “How many people will develop gastrointestinal disease following a disaster?” Or even further to “How many young children will develop gastrointestinal disease in the four-week period following flooding in affected regions in low-income countries?” Defining the question sets the scope for the systematic review, and this can then be used to create a structure for the eligibility criteria for the review, which can be categorized as follows: (1) the types of participants (for example, children aged between 3 months and 5 years); (2) the types of impact (flooding in low-income countries); (3) outcome measures of interest (gastrointestinal disease within 4 weeks of the onset of flooding) and (4) the types of database to use (for example those with a focus on health-related outcomes and a reliable means for gathering data on illness in children). The review should then seek to be as comprehensive as possible in identifying relevant evidence. This should include compilation of a list of all disaster databases that are currently available, which contain data that are relevant to the question being asked. Resources such as the disaster data portal (DisDAT) [23] , which indexes 66 registered databases: 15 global; 43 national; 2 supra-national and 4 sub-national) may help with this. These searches might be supplemented by searches using internet search engines and by access to internal databases such as those within Ministries of Health, hospitals, etc.
Having identified the potentially eligible sources of evidence for the systematic review, the quality of these sources is assessed. For the disaster databases, this might include consideration of the precision of the data, an evaluation of which would include
The accuracy of the data should also be considered, along with its timeliness (i.e. whether all the relevant data have been gathered and included in the database, and whether some data are still being processed) and reliability (i.e. the quality of the sources of the data and the methods used to arrive at any approximations.)
The methods for the review will also need to describe how data will be extracted from the databases. This might rely on integrated search tools, but, even so, the interrogation terms used should be explicitly stated (including the use of any drop-down menus if these exist within the particular database) and any assumptions made in extracting the data need to be described clearly.
The analysis plan for the review should include details of the types of statistical analyses performed, along with information on any subgroup or sensitivity analyses (for example, analysis focused on data from databases that were assessed to be of the highest quality).
The findings of this quality assessment, extraction and analyses should be presented clearly in the systematic review. The contribution of each database and any other sources of evidence should be described, so that readers can see where the evidence comes from, and the numerical basis of any analyses should also be transparent. The conclusions of the review should address the applicability of the findings to other scenarios or situations by identifying contextual characteristics of the included data, for example, the area or people affected, which may support the use of the findings when planning for, or responding to, similar events in other settings which share contextual features.
Two case studies – exploratory systematic reviews using disaster databases
To illustrate how systematic reviews might be used in the analysis of disaster databases, we undertook two abridged systematic reviews as case studies. The rationale for undertaking abridged, rather than complete, systematic reviews was the time required. Since our main purpose was to demonstrate proof of concept (i.e. the applicability and feasibility of systematic review to disaster databases as a method), rather than seeking to reach conclusive answers to either of the questions posed as case studies, the time needed to conduct a full review was not justified.
Case study 1: What was the level of homelessness due to the earthquake in Pakistan in 2005?
Information on the human and economic costs of natural disasters, such as earthquakes, is critical in informing the immediate response as well as the process for long-term recovery, and future preparedness. It is particularly useful when the data are broken apart to allow an understanding of how people are affected by, for example, trauma, homelessness and psychosocial effects. This enables responders to tailor the delivery of resources according to need and may be used to guide response in future events. Therefore, we sought to examine one aspect of the consequences of the earthquake in Pakistan in 2005: the number of people left homeless in that country. We defined homeless as people whose homes were destroyed and who required alternative accommodation and limited this to those who were made homeless as an immediate and direct consequence of the earthquake. We did not wish the estimate to include people who were homeless before the event.
We set the following eligibility criteria for the review:
We used the search engine on the Disaster Data Portal (DisDAT) to identify suitable databases from amongst its 66 indexed databases. The search limits used in DisDAT were selected from the integrated drop down menus, and are restricted to one of the following four criteria at a time:
It is not possible to search using search parameters for time period or outcome.
If we had progressed to a full review, we would have also conducted searches for potentially eligible databases through internet search engines, such as Google; searches of electronic, bibliographic databases including EM-BIB, MEDLINE, EMBASE, and Web of Science for literature to supplement the database review; and consultation with experts in this area.
The potentially eligible databases identified in DisDAT were assessed by one author (IK-P) according to the following criteria.
The search of DisDAT identified nine potentially eligible databases: The Disaster Database Project, EM-DAT, SIGMA (SwissRe), ADRC Disaster Information for Member Countries, USGS Earthquake Database (USGS), The NGCD Natural Hazard Data, The NGCD Significant Earthquake Database, GLIDE and NGCD Natural Hazards Data Resource Directory. However, detailed assessment of these revealed that it was not possible to use them to provide a reliable answer to our question about the number of people made homeless by the Pakistan earthquake. None of the databases met the inclusion criteria for this review. There was a lack of good quality data, insufficient information on the sources of the data and how it had been collected, lack of transparency for the reporting methods, uncertainty about data validation, poor consistency across the estimates that were available and insufficient detail for the proposed sub-group analyses. Three databases did report the number of homeless people, and the values reported were 5 million, 3.3 million and a range of 2.8 to 3.3 million. However, there was no indication of the level of homelessness in the region before the earthquake and there was insufficient information to identify the number made homeless within 48 hours of the earthquake. A fourth database put the number of homes destroyed in the range 101 to 1000 which, if we were to assume 10 people per household, would equate to only 10,000 people.
Case study 2: Burden of ill-health due to gastrointestinal caused by flooding in India during 1999 to 2008
This systematic review set out to summarise the evidence on the burden of ill-health caused by gastrointestinal illness following flooding events in India over ten years (1999 to 2008). This would be useful for planning the deployment of healthcare resources in the event of future flooding. The objective was to assess how many people in India experienced symptoms of gastrointestinal illness (vomiting and diarrhoea only) or had a diagnosis of gastrointestinal illness as a result of flooding events. We defined gastrointestinal illness as a diagnosis by a clinician of gastrointestinal illness, or someone reporting symptoms of diarrhoea or vomiting, and wished to include only those cases that had been caused by flooding.
We set the following eligibility criteria for the review:
We searched DisDAT and identified two databases with coverage of India, and 47 (including those two) for flooding. A preliminary search using the internet search engine Google identified 110,000 pages using the key words “disaster database India flood gastrointestinal”, in October 2009 but these hits were not assessed. We contacted experts in the area for suggestions for additional databases. As with the first case study, a full systematic review would have also included searches of electronic, bibliographic databases including EM-BIB, MEDLINE, EMBASE and Web of Science.
The potentially eligible databases identified in DisDAT were assessed by one author (IK-P) according to the following criteria.
The search of DisDAT identified eight potentially eligible databases: The Disaster Database Project, EM-DAT, SIGMA (SwissRe), ADRC Disaster Information for Member Countries, India national disaster database – InDisDATA, The Dartmouth Flood Observatory (DFO) database, NGCD Natural Hazards Data Resource Directory and Orissa, India database – DesInventar (duplicate). The experts who were contacted suggested two more: GDACS and ReliefWeb. However, as with the abridged systematic review of homelessness following the Pakistan earthquake, assessment of the databases revealed that it was not possible to use them to provide a reliable estimate of the number of people having gastrointestinal illness following flooding events in India in the ten years from 1999. The problems with the databases were similar but were compounded by incomplete information across the time period of interest. Furthermore, we were not able to find data in any of the databases on the number of people affected by gastrointestinal illness following a flooding event in India. This was reported by some media on an ad hoc basis, such as a BBC report of 120 deaths due to leptospirosis in 2005 and the deaths of 76 people in Bihar in 2002 due to water-borne illness, but these numbers are large underestimates of the morbidity and mortality caused by gastrointestinal illness in a decade of flooding in India.
Discussion
Systematic reviews have helped to make the vast amount of research evidence in health care more manageable to policy makers, practitioners, patients and the public and this is also becoming the case in the social sciences [13][24] . The reviews also provide a means for minimizing bias in the interpretation of findings from individual studies, avoiding undue emphasis on individual studies [25] and improving the design of future research. We believe that these benefits could also be achieved within disaster planning, and that the application of systematic reviews to disaster databases is feasible and would enhance their contribution to the evidence base.
Although the main applied benefit of systematic reviews is their ability to synthesise and summarise evidence across disparate sources, the methodology has value in itself on account of the procedural rigour used to minimise bias and to critically appraise the included research.
An important difference between evaluation of databases using measures of concordance or against specified criteria and the systematic review approach is that, in the latter, the critical appraisal of the evidence is focused around questions of relevance to practitioners and policy-makers, rather than on the database or databases per se . Therefore, implicit within the process of systematic review is an assessment of the practical utility of current evidence to the needs of key stakeholders. Consequently, even when the results of a systematic review are inconclusive, gaps will have been identified to inform future research, in a procedurally rigorous way which adds to weight to calls for further research in those specific areas.
That said, application of systematic review to disaster databases whilst technically straightforward, may in practice prove to be problematic. There is a wealth of information available in disaster databases; but, the content – extent and quality – of the data collected depends very much on the respective objectives of the producers of these databases; the methods used for data collection and case definitions, which may vary depending on disciplinary affiliations; and the quality and timeliness of the data, which may vary depending on resources and the interests of the producers. For example, if the objective is to provide a rough estimate quickly to allow prompt action in the early hours of disasters, this will be of less value to a systematic review that seeks a more validated and accurate estimate of an impact at a much later date. These and other characteristics of the databases themselves can limit comparability and provide examples of the types of heterogeneity that should be explored within a systematic review.
A second, perhaps more fundamental issue lies with the quality and relevance of the primary data being collected and made available within the databases. Databases, like any secondary source of information, are limited by the primary data on which they draw. The difficulties surrounding the collection of primary data have been commented on previously and include lack of standardized case definitions, difficulty defining population denominators, attributing causality, and lack of comparability between sources, to name just a few[2][26][27] . At the same time, there is often a large amount of activity in the aftermath of a disaster, with many agencies intervening and collecting data for their own internal use. Data collection requires resource and, particularly in resource-stretched settings such as in the aftermath of a disaster, there is an ethical imperative to ensure that all data collected is of good quality, and is useful and relevant to as many users as possible.
The challenges we encountered in using the disaster databases as a source of evidence for these two abridged systematic reviews are akin to those faced by reviewers of clinical trials in health care in the 1980s. The raw material for their work – the reports of the original research – did not contain sufficient information. There were shortcomings in descriptions of the methods of the trials, in the reporting of the results, and in the comprehensiveness of those results. There was a potentially high risk of bias due to how the data had been collected and reported, and the details to assess this risk were not available because of incomplete reporting. Some of these problems persist in health care but they are being tackled by initiatives such as the CONSORT reporting guidelines for randomised trials [28] . Similar work is also being done for other types of study, including observational studies (STROBE) [29] , diagnostic studies (STARD) [30] , qualitative research (COREQ) [31] and systematic reviews themselves (PRISMA) [12] . There is accumulating evidence that these initiatives have led to improvements in the quality of reporting of research [32] .
There are also ongoing efforts in health care to establish consensus and standardise the ways that outcomes are measured, collected and reported in research. The aim being to reach agreement on a minimum set of standard outcomes that would be collected in all relevant research. Some existing examples of this are in rheumatology [33] , maternity care [34] and child health [35] . These “core outcome sets” will make it easier to compare, contrast and combine the findings of research in systematic reviews.
Although efforts are underway within the disaster community to standardize data collection, without firm international consensus on priorities and methods, the creation of a common core dataset, which in turn may facilitate cross-validation between sources and greater data credibility, remains a nebulous goal.
We support the call for a common approach to data management in disasters and propose the systematic review as a method for critically summarizing evidence, but perhaps more crucially, given the findings from our case studies, as a tool by which to identify gaps in the data in a procedurally rigorous and objective way, which may help focus international efforts to fill these gaps and resolve the accompanying uncertainties.
In order to maximise the usefulness of disaster databases, we suggest a much greater focus on the information needs of policy-makers and practitioners in the disaster community, possibly with database set-up being informed directly by regular evaluation of these information needs. In the disaster context, where there is still so much heterogeneity in the data, perhaps the most pragmatic and instrumental way in which systematic reviews can be used would be to navigate these heterogeneities and through a process of iteration and negotiation between different stakeholders help in the development of a common core dataset. Finally, without buy-in from partners, no data set, however well constructed will not succeed. CONSORT, STROBE and other reporting standards in health were developed by large mullti-party international working groups which developed a consensus that was then accepted widely. Perhaps, a similar process is needed to ensure that candidate core datasets actually achieve the universal (or at least widespread) usage needed in order to make any difference to data quality.
Conclusions
In this paper, we have shown how the systematic review process may be applied to disaster databases to strengthen the role that they can play in planning for, and responding to, disasters. We outline the benefits of doing so and discuss some of the obstacles that we anticipate. We demonstrate proof of concept by applying systematic review methods within two ‘case studies’ and recommend that the role of systematic reviews as a source of reliable information for policy makers and practitioners should be recognized as strongly across the disaster community as it has been in health care. Bearing in mind the current variability across the disaster databases, we also recommend that reporting standards should be established for disaster databases to make it easier for users to identify the particular advantages and disadvantages of each database with regard to specific policy or practice questions and suggest carrying out systematic reviews as an integral part of this development process. If a standardized, minimum dataset could be agreed for routine collection and storage in all databases, this would also go a long way towards increasing the value of these databases for decision makers.
Analogous to the experience of developing reporting guidelines for clinical studies, the development and acceptance of a core outcome set or sets in the disaster field is likely to be achieved only through an iterative process which will require international co-operation and consensus. Efforts in this direction are already underway [36] . Systematic reviews should also be able to help because in addition to their well recognized role as a process for critical review of existing scientific evidence with the objective of arriving at a concise summary, they are also useful for the systematic identification of knowledge gaps. Given the findings from our case studies, we propose that this benefit of the systematic review will, at least at the outset, be of greatest use in defining a core outcome set for disaster data, as the gaps will have been identified through a transparent, reproducible, objective process and not predicated on the experiences of individuals or organisations. In the longer term, we expect that the strength of systematic reviews as a means of providing answers to key questions for disaster risk reduction and response will come to the fore, as the quality of disaster data improves.
The disaster databases represent a tremendous investment of resources, effort and good will. At the moment, however, the collective resource of these databases is not realizing its full potential to influence policy and practice for the better. The suggestions outlined in this paper would harness the power of the databases by valuing their diversity and recognizing their different roles whilst at the same time making it easier for users to synthesize evidence from multiple sources and having assurance in choosing the ones most appropriate to their purposes. This, in turn, would help resolve the uncertainties of policy makers, organisations, practitioners and the public, and would lead to reductions in the damaging effects of disasters on populations and societies. The disaster community has an opportunity to benefit from many decades of experience of the conduct of systematic reviews and the implementation of evidence based health care. We hope that this paper will stimulate discussion and the actions needed to grasp this opportunity.
Acknowledgements
The authors would like to thank the help and advice provided by the sub-committee on databases of the UNISDR Science and Technical Committee, specifically Dr Walter Ammann; Prof Gordon McBean; Prof Moshen Ghafory-Ashtiany; Prof Laban Ogallo; Dr Kaoru Takara; Prof Dennis Wenger; Dr Reid Basher; as well as Mr Jonathan Abrahams.
Funding information
None to declare.
Competing interests
The authors have declared that no competing interests exist.