Notice of Correction
7 January 2016: PLOS Currents -. Correction: Thiol-disulfide Oxidoreductases TRX1 and TMX3 Decrease Neuronal Atrophy in a Lentiviral Mouse Model of Huntington’s Disease. PLOS Currents Huntington Disease. 2016 Jan 7 . Edition 1. doi: 10.1371/currents.hd.30bdfed3d88457fd605cb8f95fba29b5. View Correction.
Introduction
Huntington’s disease (HD) is a progressive autosomal dominant neurodegenerative disorder caused by a trinucleotide CAG repeat expansion in exon-1 of the huntingtin gene (HTT)1. Disease onset is typically in early to mid-adult life with a range from childhood to advanced age. Clinical signs of HD include involuntary movements, psychiatric problems and cognitive decline. Motor signs of HD result largely from dysfunction and loss of neurons in striatum and cerebral cortex2,3. Treatments that delay onset or progression of human HD have yet to be developed.
Trinucleotide-repeat expansion within the HTT gene results in expression of a polyglutamine-expanded mutant huntingtin protein (mHTT). Full-length soluble mHTT undergoes enzymatic cleavage to generate soluble N-terminal mHTT polyglutamine containing fragments4,5. Mutant huntingtin N-terminal fragments exist as monomers, soluble oligomers and larger insoluble aggregates6. Soluble N-terminal mHTT fragments are thought to be the main drivers of disease progression7 and mouse models of HD that express these fragments have a rapidly progressive phenotype8. N-terminal mHTT results in HD through accumulation in cells and aberrant interactions with numerous proteins9,10 and possibly direct production of reactive oxygen species11. Genetic therapeutic approaches that decrease mHTT levels offer the possibility of inhibiting downstream disease pathways, reversing the disease process, and are a promising approach for future treatment of human HD12,13,14,15 .
We have previously reported that the toxic N-terminal 171 fragment of mHTT is prone to thiol oxidation resulting in the formation of soluble oligomeric mHTT; furthermore, these oligomers are degraded more slowly than monomeric mHTT6. Therefore, thiol oxidation within mHTT may contribute to cellular accumulation and toxicity. There is accumulating evidence for the dysregulation of thiol homeostasis in HD. For example, S-nitrosylation of dynamin-related protein 1, a GTPase that mediates mitochondria fission, has been shown to promote degeneration in HD models16. Another study in cultured HD cells showed increased thiol oxidation of peroxiredoxin 1, a protein involved in removal of hydrogen and lipid peroxides17. Furthermore, there are increased levels of copper and iron in mouse HD brain, which in unbound form, can promote thiol oxidation1819,20.
Thiol-disulfide oxidoreductase enzymes mediate protein repair and folding processes. They share a common C-X-X-C catalytic sequence within a thioredoxin-type domain that is required for enzymatic activity and they reduce disulfides by forming a catalytic-site disulfide which is then reduced by an external electron donor21. These enzymes differ in cell location, protein substrates and mechanism of reactivation. Thioredoxins are small thiol-disulfide oxidoreductases involved in repair of oxidatively damaged thiols and redox regulation of cell-signaling pathways via thiol switches22,23. Glutaredoxins have thiol reductase and deglutathioylation activity; they are required for normal mitochondrial function and protection against neurodegenerative processes24,25,26. Protein-disulfide isomerases are another group of enzymes with a thioredoxin domain; they are located in the endoplasmic reticulum (ER) and other compartments where they regulate a large number of processes via disulfide exchange reactions27. Collectively, these oxidoreductases regulate protein folding in the cell secretory pathway, modulation of activity within cell signaling pathways, and repair of oxidatively-damaged nuclear, cytoplasmic and mitochondrial proteins (reviewed24,28).
Mutant huntingtin undergoes a number of post-translational modifications. Phosphorylation status of serine 13 and 16 within the N-terminus of huntingtin protein is a critical determinant of HD29. Furthermore, acetylation of mHTT lysine 444, down-stream of the glutamine expansion, promotes mHTT clearance by increasing trafficking to the autophagosome30. These post-translational modifications suggest potential therapeutic approaches for modifying HD proximally at the level of mHTT. We have reasoned that there may be a thiol-disulfide oxidoreductase that has protective effects by decreasing levels of N171 mHTT, possibly by direct activity on mHTT protein. We therefore undertook a study to seek a thiol-disulfide oxidoreductase with mHTT lowering effects in HD cells that we could test in HD mice. We found that thioredoxin 1 (TRX1) and thioredoxin-related transmembrane protein 3 (TMX3) both decreased levels of mHTT in cells but did not find evidence for a direct interaction with mHTT. Using a lentiviral mouse model expressing N171 mHTT31, we found that TRX1 and TMX3 decreased striatal neuronal atrophy. Findings support a modulatory role of TRX1 and TMX3 in these HD model systems.
Materials and Methods
Materials: Mouse anti-huntingtin (HTT) (MAB5374) was from Chemicon, and mouse monoclonal anti-β-actin antibody (AC40) from Sigma. Unless otherwise stated all chemicals were from Sigma.
Primary screen for mutant HTT protein lowering thiol-disulfide oxidoreductases: COS-1 cells were grown in DMEM supplemented with 10% fetal bovine serum (FBS), 1% L-glutamine and 1% penicillin and streptomycin at 37⁰C and 5% CO2. For experiments cells were grown in 12-well plates and transfected with plasmid(s) using lipofectamine 2000 (Life Technologies) and reduced serum medium (OPTI-MEM®-1; Life Technologies) at 70-80% confluency using standard procedures. N171-40Q was in pcDNA1 vector and those encoding thiol-disulfide oxidoreductases were in pQE-TRiSystem vector (Qiagen) and expressed with a polyhistidine tag. Gene accession numbers are: NM_001118890.1, NM_016066.4, NM_006541.4, NM_016417.2, NM_001080476.2, NM_001080516.1, NM_001164478.1, NM_003329.1, NM_012473.3, NM_019022.3, NM_021156.3, NM_005742.3, NM_015051.2, NM_004261.3 and NM_080430.2. For plasmids encoding N171-40Q and the thiol-disulfide oxidoreductases 830 ng of each plasmid DNA was used. We co-transfected with plasmids encoding N171-40Q and GFP as a control. Cells were lysed 48 hours after transfection and levels of soluble N171-40Q and actin were measured by Western blot analysis (see below). Actin normalized values were then determined.
Secondary screen for mutant HTT protein lowering thiol-disulfide oxidoreductase: To provide a robust control for each candidate proteins enzymatic activity, we expressed as a control the same protein but with mutation of active-site residues that blocks activity. Thiol-disulfide oxidoreducases have a C-X-X-C active-site and share a common catalytic mechanism. PDIA6 has two C-X-X-C motifs while the others have one. In one study mutation of the N-terminal cysteine within this motif completely blocked enzymatic activity while mutation of the lower cysteine inhibited activity by 90% [32]. Therefore, we replaced the N-terminal active-site cysteine with serine to generate enzymatically inactive control proteins. We generated constructs expressing enzymatically inactive TRX1, TMX3, GLRX1, PDIA6 and FLJ44606 using QuikChange® site-directed mutagenesis kit (Stratagene) for use as a specific control for each candidate test protein. Constructs were verified by DNA sequencing. COS1 cells were transfected with plasmids encoding active or inactive thiol-disulfide oxidoreductase, and then N171-40Q levels determined by Western blot analysis.
Western blot analysis: For cell culture experiments, cells were washed in cold PBS then lysed directly in lysis buffer [20 mM TRIS (pH 7.4), 1 mM EDTA, 0.15 M NaCl, 0.1% Triton-x100 and protease inhibitor cocktail]. Thirty µg protein samples were resolved by reducing SDS-PAGE. Proteins were transferred to PVDF, blocked with 5% non-fat milk in Tris-buffered saline containing 0.1% Tween (TBS-T) at room temperature for 1 hour then incubated with anti-HTT (MAB5492 – 1:2000 dilution) and anti-actin (AC40 – 1:2000) overnight at 4⁰C. After the primary incubation, membranes were washed 4 times for 10 minutes in TBS-T and incubated with goat polyclonal to mouse IgG HRP (Abcam, 1:2000 dilution) at room temperature for an hour. Then membranes were washed again and placed in Western Blotting Luminol Reagent (Santa Cruz Biotechnology, Inc.) before imaging with a CP1000 Film Processor (AGFA). Image J software (NIH) was used to quantify band density. Total HTT protein levels were determined by the ratios of the values for HTT and β-actin. For mouse studies, mice were anesthetized and perfused with cold-heparinized 0.9% (w/v) saline. Brains were sectioned frontally at a 1 mm interval then two sections were taken at the level of the injection site, striatum dissected and then frozen on dry ice before storing at -80C. Brains were homogenized in lysis buffer which were then incubated on ice for 5 minutes then centrifuged for 10 minutes at 16 000 x g and 4⁰C. Protein concentrations were determined then Western blot analysis performed as described above.
N171 HTT protein TRX1 interaction experiment: We used a previously described approach to test whether N171 mHTT is a direct substrate of TRX133,34. In brief, a variant of TRX1 with a mutation of the lower cysteine residue within the CXXC active-site motif is used to trap the catalytic disulfide-linked heterodimer with the substrate protein. Heterodimers can be detected by non-reducing Western blot analysis. DNA encoding N171-40Q, TRX1 and mutant TRX1 (mTRX1) was sub-cloned into the bacterial expression vector pGEX-6P-1 (GE Healthcare). Proteins were expressed in bacteria, purified using a GST column, then GST removed by cleavage with PreScission Protease (GE Healthcare) as previously described6 . The purified protein was buffer exchanged into 50 mM Tris (pH 7.0) and 150 mM NaCl. N171-40Q was incubated with TXN or mutant TXN at room temperature for one hour; 50 mM N-ethylmaleimide was then added to block free thiols and the samples were then resolved by reducing or non-reducing SDS-PAGE and proteins detected by western blot analysis.
Mouse husbandry: All procedures and euthanasia methods were approved by the University of Wyoming Institutional Animal Care and Use Committee and were also in accordance with NIH guidelines. We used female B6/C3H F1 mice purchased from the Jackson Laboratory. Mice were maintained under standard conditions of housing and lighting. They were fed a standard cereal-based rodent chow and had ad-libitum access to acidified water (pH 3-4).
Mouse study experimental design: C57BL/6 x C3H F1 female mice were purchased at 5-6 weeks of age. Pre-treatment wheel analysis was at 7 weeks of age. Surgeries were at ~8 weeks of age and mice were sacrificed 6-weeks later based on the studies of de Almeida et al31.
Lentiviral synthesis: We utilized a four-plasmid system for generation of lentivirus expressing N171-18Q and N171-82Q (kindly provided by Dr. Deglon). We subcloned DNA encoding functionally active and inactive versions of TRX1 and TMX3 from pQE-Tri plasmids into the SIN-pGK which uses the phosphoglycerate kinase promoter to drive gene expression. For each virus, the four plasmids were transfected in the molar ratio of 1:1:1:3 for pMDG, CMVΔ8.92, pRSV-Rev and SIN-pGK, respectively. For each T-150 sized flask we used 3.3, 7.2, 2.2 and 7.2 µg plasmid. 293T cells were grown to ~60% confluency in 10% FBS-DMEM and 2 mM glutamine. They were then transfected using jetPrime transfection reagent (Polyplus 114-07) according to the manufacturer’s instructions. For each T-150 flask we used 1 ml of jetPrime buffer, 20 µg combined plasmids, 50 jetPrime reagent and 36 mls of cell culture medium. Cells were transfected for four hours, washed twice in PBS then the medium replaced. Cells were incubated for a further 72 hours prior to virus purification. Medium was harvested and placed into sterile tubes on wet ice then filtered using a 0.22 µm filter. The filtered supernatant was centrifuged in a SW28 swinging bucket rotor on a Beckman L8-80 centrifuge at 141k x g for 2 hours at 4 degrees C. Supernatant was decanted then tubes were inverted for 4 minutes. The pellet was re-suspended in 300-500 µl of sterile PBS then transferred to a siliconized tube. Samples were then centrifuged at 19000 x g for 60 min at 4 degrees C to concentrate then the pellet resuspended in 50-150 µl PBS by gentle pipetting. The samples were then mixed gently overnight using a tilted horizontal shaker at 4 degrees C. Lentiviruses were quantified in duplicate using a p24 ELISA (Zeptometrix) according to the manufacturer’s instructions. Lentiviral samples were diluted to 4.0 ng p24 / µl in PBS, stored at 4 degrees C in siliconized tubes and used within 2 weeks of preparation.
Stereotaxic surgery: Mice were anesthetized with 1.75 mg ketamine and 0.25 mg xylazine per 20 grams body weight. After mounting in a stereotaxic frame they were injected at the following coordinates: AP =+0.4; DV= -3.9, then pull up to -3.7 before injection; ML= (all to right), +2.0 if body weight ≥22.5 g, 1.95 if body weight = 20.5-22.4 g, 1.85 if body weight = 19.0-20.4 g, and 1.75 if body weight = 17.5-18.9 g. The needle size used was ½ inch, 31 gauge, and with a 30 degree bevel. Virus was delivered with a peristaltic pump at a rate of 200 nl per minute (2.5 µl over 12.5 minutes). The needle was then left in place an additional 10 minutes before slow removal. Each mouse was injected with 10 ng of p24 equivalents of virus. For testing paired viral injections, different combinations of virus were injected; we used 5 ng of p24 equivalents of each virus which were pre-mixed prior to injection.
Wheel activity analysis: Spontaneous wheel activity was measured before and after surgery. Mice were placed individually in cages containing running wheels for 4 days, running times in both light and dark cycles (12 hours each) were recorded. The first day was used to familiarize mice with the instrument. Data from days 2-4 were used for analysis.
Immunofluorescence staining and brain stereology: Mice were sacrificed by an intra-peritoneal overdose of phenytoin and pentobarbital solution. This was followed by a 2 minute perfusion in heparinized 0.9% saline immediately followed by perfusion of 200 mls of freshly prepared 4% paraformaldehyde (in 0.1 M phosphate buffer, pH 7.5). Brains were removed 1-4 hours later and immersion fixed for a further 24 hours before being transferred to cryo-preservant (10% glycerol in 0.1 M phosphate buffer, pH 7.5). Brains were sectioned frontally at 40 μm and stored in 0.1 M phosphate buffer (pH 7.5) containing 0.05% azide at 4°C. Striatal sections at the level of the anterior commissure were incubated with primary anti-huntingtin antibody EM48 (Chemicon) at 1:1000 dilution in PBS-0.1% tween-10% goat serum for 3 days at 4C, then followed by a 24 hour incubation with Alexa-fluor 488 labeled secondary antibody at 1:500 dilution (Life Technologies). Sections were washed in PBS three times for 10 minutes and stained with fluorescent Nissl (Life Technologies) for 1 hour at room temperature (1:100 dilution in PBS), followed by washing in PBS twice for 15 minutes and mounting on slides using Fluoromount G (Southern Biotech). Slides were air-dried overnight in the dark and then stored at 4C. Nissl stain was used to detect neuronal cell bodies at 640/660 nm. Images were captured using a Zeiss 710 confocal microscope. We stained several striatal sections per mouse to identify sections containing expressed protein. Within each region of positive mHTT staining 2-3 image stacks were obtained using a 60x objective (z-stack interval = 0.46 µm). Within these images we quantified all striatal neurons regardless of whether there was mHTT staining as suppression of mHTT levels by TRX1 or TMX3 could result in loss of detectable staining. Striatal neuronal volumes were estimated using the confocal module in Stereoinvestigator software (MicroBrightField, Williston, VT) and the five-ray nucleator method.
Quantitative PCR for TMX3 and TXN1 in N171-82Q HD mice: We used essentially the same method as previously described35.
Statistical analyses: Data was analyzed with SAS software version 9. Student’s t-test were used for the analysis of the secondary screens. One-way ANOVA was used for the analysis striatal neuronal volumes. Repeated-measures ANOVA was used to analyze spontaneous wheel-running data. P-values less than 0.05 were considered significant.
Results
Identification of TRX1 and TMX3 as candidate mHTT decreasing proteins in HD
We studied a broad range of human thiol-disulfide oxidoreductase genes. This group includes all the well-studied thiol-disulfide oxidoreductases to include the glutaredoxin, thioredoxin and thioredoxin reductase gene families. There are a growing number of poorly characterized proteins considered to have a thioredoxin-like domain and probable thiol-disulfide oxidoreductase activity. We studied several of these proteins to include the thioredoxin-related transmembrane proteins and thioredoxin-like proteins. COS1 cells were co-transfected with plasmids encoding the N171-40Q fragment of mHTT protein together with a plasmid encoding the test thiol-disulfide oxidoreductase. Co-transfection with plasmids encoding N171-40Q mHTT and GFP were used as controls. Cells were lysed 24 hours post-transfection and analyzed for soluble mHTT levels. For each gene studied, N171-40Q expression was normalized to actin then the result normalized to the N171-40Q/GFP control (100%). As shown in Fig. 1A, we found markedly different effects of test thiol-disulfide oxidoreductases on soluble N171-40Q mHTT levels. However, we subsequently found that co-transfection with GFP significantly suppressed N171-40Q protein levels (not shown). Therefore, rather than comparing test genes with the N171-40Q/GFP baseline, we qualitatively selected genes for more detailed testing based on them resulting in low or high N171-40Q expression levels, compared to other candidates. Thioredoxin 1 (TRX1) and thioredoxin-related transmembrane protein 3 (TMX3) were chosen as candidates that may decrease N171-40Q levels. Glutaredoxin 1 (GLX1), protein disulfide isomerase family A, member 6 (PDIA6) and FLJ44606 were chosen as candidates that may increase mHTT. Sel-M and Sel-15 are selenoproteins that were also mHTT decreasing candidates; they were not included in subsequent investigations. To provide a more rigorous assessment of the selected candidates we developed a secondary screening assay to further validate results. The candidate proteins share a common thioredoxin-domain structure with the same catalytic mechanism that involves a C-X-X-C motif. Further, mutation of the first cysteine residue of this site blocks enzymatic activity32. To specifically assess the effect of thiol-disulfide oxidoreductase enzymatic activity on mHTT levels in our secondary screen we compared the effect of active protein with protein in which enzymatic activity had been blocked by replacement of the critical cysteine with serine (see methods). As shown in Fig. 1B-D GLX1 (1B) increased mHTT (p<0.05); TRX1 (1C) decreased mHTT (p<0.05); and TMX3 (1D) decreased mHTT (p<0.01) consistent with the findings from the primary screen (Fig. 1A). However, active LJ44606 (1E) and PDIA6 (1F) had no effect on mHTT levels (p>0.05). GLX1 increased N171-40Q protein levels (1B) suggesting that GLX1 inhibitors may decrease mHTT. However, while GLX1 knockout is not lethal in mice36 the protein is required for normal mitochondrial function26. As GLX1 inhibitors would be predicted to be toxic, we excluded it from further investigation.
To further elucidate mechanisms for decreasing mHTT levels in cells we used two approaches. First, we tested to determine if TRX1 and TMX3 can decrease levels of a N171-40Q variant that lacks thiol-containing cysteine residues and does not form reduction-sensitive oligomers. We used a plasmid encoding N171-40Q-4CA in which all four cysteine residues are mutated to block formation of thiol-dependent oligomers6. In co-transfection experiments there was no effect of TRX1 and TMX3 on decreasing N171-40Q-4CA as compared to mutant TRX1 and mutant TMX3 controls (Fig. 2A-B). Infact, functional TMX3 increased N171-40Q-4CA compared to mutant TMX3 control (p<0.05) (Fig. 2B). The reason for this is unclear. However, the lack of decrease of N171-40Q-4CA by active TXN1 and TMX3 suggests that the decreasing effects of these thiol-disulfide oxidoreductase on N171-40Q levels depends on the presence of N171 HTT thiols. TRX1 is a cytosolic and nuclear protein and could therefore have direct contact with HTT37,38. We therefore addressed if N171-40Q mHTT is a direct substrate of TRX1. We used a previously described method that can trap TRX1 with its substrate in a catalytic intermediate state [34] . As shown in Fig. 3 we found no evidence that N171-40Q mHTT is a direct substrate of TRX1 under cell-free conditions. Similar experiments using transfected COS cells also failed to find evidence of a direct interaction between N171 HTT and TRX1 (not shown). TMX3 is a transmembrane protein with its active site within the endoplasmic reticulum39. As there is no evidence that HTT is an endoplasmic reticulum luminal protein we did not test for a direct TMX3 HTT interaction. However, as both TRX1 and TMX3 could be protective by effects on non-HTT targets we tested them in mouse HD.
Validation of a lentiviral mouse model of HD
Lentiviral vectors have been used to model HD in rats and macaques40. We used a four plasmid lentiviral system previously described by de Almeida et al in rats31 to model HD in wild-type mice. This system drives expression of the N171 HTT fragment under the control of the phosphoglycerate kinase promoter providing neuronal expression at physiologically relevant protein levels. Mice were injected with virus at ~8 weeks and sacrificed as ~14 weeks of age. Lentiviral-mediated expression of N171-18Q and 82Q HTT resulted in detectable expression by immunofluorescence staining of brain sections (Fig. 4A). However, neuronal expression was only found immediately around the needle tract. Western blot analysis failed to detect N171-18Q but detected N171-82Q (Fig. 4B). Therefore, both wild-type and mutant N171 protein were expressed in brain; higher expression of mHTT may be related to its accumulation as part of the disease process41. We chose to use striatal neuronal cell body volume as our main outcome as cell atrophy is a consistent manifestation of mHTT expression in neurons42. In this preliminary study, while differences were not statistically significant (p=0.2202) striatal neuronal cell body volume means were lower in the N171-82Q (n=11) versus N171-18Q (n=5) group (520 ± 53 and 639 ± 78 µm3, respectively).
TRX1 and TMX3 decrease neuronal atrophy in mouse HD
We sub-cloned cDNA-encoding TMX3 and TRX1 into the same lentiviral expression system used for N171 expression31 then generated enzymatically inactive variants by point mutagenesis for use as gene-specific controls for enzymatic activity of the test protein. We removed the histidine tags during the sub-cloning process. While we did not attempt to show protein expression in brain, we did demonstrate in-vivo transcript expression of TMX3 and TRX1 in liver 6 weeks after intra-venous injection of neonatal mice (not shown). We then undertook experiments in which we compared the effects of N171-18Q, N171-82Q, and N171-82Q with TMX3 or TRX1 following mouse striatal injection. To control for the total level of lentiviral delivery to striatum we co-injected virus encoding mutant (inactive) TMX3 or TRX1 in the N171-18Q and N171-82Q treatment groups. Striatal injections were at ~8 weeks and mice were sacrificed at ~14 weeks of age. We completed confocal stereology to quantify striatal neuronal cell body volume. As our candidate treatments were chosen based on their ability to decrease mHTT it is possible that mHTT would not be detected in an infected cell by immunofluorescence and that the transduced cell would not be quantified. Therefore, we changed our methodologic approach. We stained brain sections for mHTT then captured confocal images in regions where there was some neuronal mHTT staining. We then quantified cell body volume for all neurons within an image stack. As shown in Fig. 5 (TMX3 experiment) and Fig. 6 (TRX1 experiment) we found that striatal neuronal cell body volumes were significantly decreased in N171-82Q versus N171-18Q expressing mice (p-values: 0.0350 and 0.0035, respectively). Functionally active TMX3 and TRX1 both decreased this effect of mHTT on striatal neuronal atrophy (p-values: 0.0387 and 0.0046, respectively). Due to the presence of detectable mHTT staining only around the needle tract quantification of soluble mHTT levels by Western blot analysis following brain dissection would not have been reliable therefore we did not attempt this. Finally, we studied TRX1 and TMX3 transcript levels by qPCR in 14-week old N171-82Q transgenic HD mice (equivalent to early-advanced disease35); these mice express the N171-82Q HTT fragment under the control of the prion promoter8 (Fig. 7). There was no evidence of decreased expression of both genes in striatum and cerebral cortex; in fact, in striatal TRX1 transcript expression was significantly increased in HD mice (p<0.01) (Fig. 7A). We additionally completed searches of publically available HD micro-array data sets using GeoProfiles. In the R6/1 mouse model of HD there was an increase in cerebral TXN1 transcript from 22-27 weeks of age with 1 of 2 probes; TMX3 transcript changes were not found43. Micro-array analysis in 12 and 24 month old full-length mHTT expressing YAC128 HD and wild-type litter-mate striata did not reveal expression differences for TXN1 or TMX344.
Discussion
Abnormal redox homeostasis and oxidative stress are consistent features of human HD and cell-based and animal models45,46. Identification of appropriate targets for modulation of redox homeostasis could provide novel therapeutic approaches for treating HD. Protein thiols are an important site of post-translational modification involved in the regulation of redox responsive cell signaling processes24. Oxidative stress can result in increased protein thiol oxidation and disruption of these homeostatic processes, potentially contributing to cell dysfunction and degeneration. Transgenic mice expressing the N171 mHTT protein fragment develop a phenotype similar to human HD including striatal atrophy47. We have shown that the N171 fragment of HTT can form thiol-dependent oligomers which are degraded more slowly than a N171 protein variant that lacks thiols and is unable to oligomerize6. Numerous proteins with thiol-disulfide oxidoreductase activity exist that facilitate the reduction of oxidized protein thiols in cells24. Here we sought to identify if there are thiol-disulfide oxidoreductase enzymes that can decrease mHTT levels in cells and provide protection against neuronal atrophy in HD mice. We tested a representative set of thiol-disulfide oxidoreductases for mHTT decreasing effects. We used primary and secondary cell-based screens to identify candidate genes for testing in HD mice (Fig. 1). Based on our previous findings6 enzymatic conversion of mHTT oligomer to monomer by a thiol-disulfide oxidoreductase is expected to result in increased monomer degradation and potentially no change in monomer to oligomer ratio; we therefore quantified total soluble mHTT levels by reducing SDS-PAGE in our cell-based studies. To enable timely progression to in-vivo testing we utilized a lentiviral system to drive expression of N171 mHTT and test our candidate genes in mouse brain (Figs. 5-6).
Consistent with reports of lentivirus-induced HD in rats showing no behavioral changes31, effects of striatal expression of N171-82Q mHTT in mice on spontaneous wheel running activity were not found (Figs. 5-6). N171 HTT expression was found mainly around the needle tract suggesting transduction of a small percentage of the overall striatal volume potentially explaining the lack of a behavioral phenotype. However, by characterizing somal volume of neurons we were able to obtain a measure of the effect of mHTT and test proteins TRX1 and TMX3. Neuronal atrophy is a consistent morphologic feature of HD and is frequently used as a marker of therapeutic effect 42. Based on this outcome, we provide evidence that both TRX1 and TMX3 have protective effects in the lentiviral mouse HD system tested (Figs. 5-6).
TRX1 is a well-characterized cytoplasmic and nuclear thiol-disulfide oxidoreductase that has previously been demonstrated to have protective effects in models of acute and chronic neurodegeneration. TRX1 transgenic mice demonstrate increased resistance to neuronal degeneration induced by transient focal ischemia48. TRX1 interacting protein (TXNIP) is an endogenous inhibitor of TRX1 and is expressed in brain49. Furthermore, TXNIP inhibitors provide protection in a rodent model of thromboembolic stroke50. TRX1 has also been shown to promote neurogenesis and cognitive recovery following cerebral ischemia in mice51. DJ-1 is an anti-oxidant protein; mutations in DJ-1 cause autosomal recessive early-onset Parkinson’s disease52. In one study, it was shown that DJ-1 mediates its neuroprotective effects by stimulating Nrf2-mediated upregulation of TRX153. The protective effect of 17β-estradiol in the tumor necrosis factor model of optic neuropathy is also mediated by TRX154. Protective effects of TRX1 in disparate models of neuronal degeneration are consistent with its key role in redox regulation of signaling pathways and repair of oxidatively-modified thiols within diverse proteins. The current findings demonstrate that protective effects of TRX1 also extend to a model of mouse HD.
To determine if the effect of TRX1 on decreasing N171 mHTT (Fig. 1) is the result of a direct effect of TRX1 on N171-40Q we used a previously reported approach that utilizes a TRX1 variant to trap the intermediate catalytic state of TRX1 di-sulfide linked to its substrate protein as a heterodimer34. We used purified N171-40Q HTT and TRX1 or mutant TRX1 in a cell-free assay to maximize the chances of finding an interaction. Despite this, we found no evidence that N171-40Q HTT is a direct substrate of TRX1 (Fig. 3). As this result could be because the proteins expressed in bacteria failed to fold properly, we undertook similar experiments in transfected COS cells but also failed to find evidence for a disulfide-linked heterodimer species (not shown). Therefore, while we cannot fully exclude the possibility, we have no data to indicate that N171 HTT disulfides55 may be a direct substrate of TXN1.
TRX1 has many substrate proteins23,56. Therefore, the neuronal atrophy decreasing effect of TRX1 that we observed (Fig. 6) may be the result of effects on non-HTT targets. Peroxiredoxins are a family of redox proteins that regulate hydrogen and lipid peroxide levels by oxidation of catalytic cysteine thiols then subsequent reductive re-activation. Thioredoxins activate oxidized peroxiredoxins57. Importantly, it has been shown in a rat cell model of HD that there is increased thiol oxidization of peroxiredoxins 1, 2 and 4 implying a functionally inactive state. Further, treatment of this cell line with a dithiol compound protected against mHTT-induced toxicity and decreased the level of peroxiredoxin 1 oxidation17. Apoptosis signal-regulating kinase (ASK1) is a mitogen-activated protein kinase kinase kinase and an important regulator of oxidative and ER stress-induced apoptosis58. Inhibition of ASK1 using intra-cerebral infusion of an antibody has protective effects in mouse HD, decreasing ER stress and resulting in behavioral improvements59. TRX1 is a negative regulator of ASK160; therefore, this is another potential mechanism of protection in our model. Therefore, while a weakness of this study is that the mechanism of protection by TRX1 in our HD mouse model is undetermined, there are several substrate proteins that are in HD-associated pathways and that could be mediating protective effects.
TMX3, in contrast to TRX1, has not previously been linked to neuroprotection for any brain disorder. However, mutations in the TMX3 gene have been linked with microphthalmia and retinal developmental anomalies61. TMX3 is a single domain transmembrane protein. It is primarily located in the endoplasmic reticulum (ER), with its catalytic domain in the ER lumen62 but is also present in the mitochondrial-associated membrane63. Protein substrates of TMX3 have not been reported. Huntingtin protein is associated with ER membranes and has a role in intra-cellular trafficking between the Golgi and extracellular space64; however, it has not been shown to be present within the ER lumen. As the TMX3 catalytic domain and N171-40Q mHTT would not be expected to be present within the same cell compartment it is improbable that the N171 fragment is a direct substrate of TMX3. However, mHTT expression does induce ER stress65. Increased expression of TMX3 in striatum may protect against mHTT-induced ER pathology.
In summary, we have identified TRX1 and TMX3 as proteins that decrease both mHTT levels in cultured cells and mHTT-induced striatal neuronal atrophy in HD mice. These findings support a role of thiol stress in the pathogenesis of HD. While the findings of this study are novel there are some limitations. First, lentiviral protein expression in brain was only found surrounding the needle tract with less spread than has been reported previously in rats31. While the findings from the morphometric analysis of neuronal cell-body size indicate protective effects, selection bias in sampling offsets the strengths of the stereologic method used. Second, while neuronal atrophy is an important feature of HD neurodegeneration42 this was the only outcome for which we found an effect of mHTT expression in our lentiviral model. Despite the weaknesses, the findings suggest that specific modulation of thiol homeostasis has beneficial effects in HD models. Future studies could address if increased expression of TRX1 and TMX3 globally in mouse HD brain provides protection against multiple measures of neurodegeneration.
COS1 cells were transfected with plasmids encoding human thiol-disulfide oxidoreductase proteins and N171-40Q mutant huntingtin protein (mhtt). Twenty-four hours later cells were lysed and analyzed by reducing SDS-PAGE and Western blot analysis to quantify total soluble N171 mhtt. N171-40Q mutant huntingtin levels (MAB5492 – Millipore) were normalized to actin then to co-transfection control. TRX1 and TMX3 were chosen as targets that may decrease mhtt levels; glutaredoxin 1 (GLX1), PDIA6 and FLJ44606 were chosen as targets that may increase mhtt. See results for more details. Shown are mean ± SEM. n=3, B-F. Secondary screen. COS1 cells were co-transfected with plasmids encoding N171-40Q and wild-type or enzymatically non-functional (control) human thiol-disulfide oxidoreductases. Twenty-four hours later cells were lysed for reducing SDS-PAGE and western blot analysis. Candidate gene expression was confirmed by PCR. The letter/number codes above the right western blot lanes are the substitution of the mutant inactive protein. n=3-5, B. Glutaredoxin 1 (GLX1) increases soluble N171-40Q mhtt levels. n=5, C. Thioredoxin 1 (TRX1) decreases soluble N171-40Q mhtt levels. n=5, D. TMX3 decreases soluble N171-40Q mhtt levels. n=4, E. FLJ44606 has no effect on N171-40Q mhtt levels. n=4, F. Protein disulfide isomerase A6 (PDIA6) has no effect on N171-40Q mhtt levels. n=5. P-values: *<0.05 and **<0.01.
Fig. 1: Primary and secondary screens for thiol-disulfide oxidoreductases that change total soluble mutant huntingtin protein levels
A-B. COS1 cells were co-transfected with plasmids encoding mhtt with cysteines mutated to alanines (N171-40Q-4CA) and TRX1 / TMX3. The letter/number codes above the right western blot lanes are the substitution of the mutant inactive protein. A. TRX1 does not decrease soluble N171-40Q-4CA levels. B. TMX3 increases N171-40Q-4CA levels. n=4. P-values: *<0.05.
Fig. 2: TRX1 and TMX3 do not decrease levels of thiol-blocked N171-40Q mutant huntingtin
TRX1, mutant TRX1 (C35S) and N171-40Q were expressed and purified from bacteria. N171-40Q was incubated with TRX1 or mTRX1 at 250 C for 1 hour then free thiols blocked with 50 mM N-ethylmaleimide. Samples were then analyzed by SDS-PAGE (see methods). Lanes: 1=N171-40Q htt alone; 2=TRX1 alone; 3=mTRX1 alone; 4-5=N171-40Q and TRX1; and 6-7= N171-40Q and mTRX1. Mutant TRX1 (C35S) is predicted to trap substrate proteins as heterodimers [33]. There is no evidence of a heterodimer band (estimated mass = 46 kDa) in the non-reduced N171-40Q and mTRX1 group (lane 6). The band migrating at ~65 kDa (most prominent in lanes 4 and 6) is dimeric N171-40Q as previously reported6.
Fig. 3: TRX1 does not interact directly with N171-40Q mutant huntingtin in a cell-free assay
A-B. Lentivirus encoding N171 htt fragments was injected intra-striatally into 8-week-old mice; sacrifice was at 14-weeks of age. A. Detection of N171 htt in mouse striata following stereotaxic injection. Brains sections at the level of the stereotaxic injections were stained for N171 htt using MAB5492 (Chemicon) and with a fluorescent Nissl staining. Top left shows detection of 171-18Q; top right shows detection of N171-82Q; bottom show fluorescent Nissl staining. B. Detection of htt expression by Western blot analysis. Striata were dissected then homogenized to extract protein for Western blot analysis using MAB5492. N171-18Q is not detected. N171-82Q is detected.
Fig. 4: Characterization of huntingtin expression in mouse brain following lentiviral delivery
A-B. Mice were injected with lentiviral combinations (methods) at 8-weeks of age and sacrificed at 14-weeks. Brain sections were stained for Nissl substance and mhtt. Confocal images were collected in the region where htt staining was detected. Neuronal cell body volumes were determined using the nucleator method on confocal z-stack images (methods). A. Representative images of fluorescent Nissl stained neurons in the region of the striatal injection site. Numbers below images represent the number of mice per treatment group; numbers in parenthesis represent the minimum and maximum number of neurons counted per mouse within the group. B. Striatal neuronal cell body volume. Mice expressing N171-82Q and mutant (inactive) TMX3 (mTMX3) have significantly smaller neuronal cell bodies than mice expressing N171-82Q and active TMX3. The main effect p-value is 0.0346; pair-wise comparison p-values are on graph. n=9-10. C. Spontaneous wheel running activity is not altered by N171-18/82Q and / or TMX3 expression. See methods for experimental details. n=10.
Fig. 5: TMX3 expression decreases striatal neuronal atrophy in HD mice
A-B. Experimental design was as described for figure 5. A. Representative images of fluorescent Nissl stained neurons in the region of the striatal injection site. Numbers below images represent the number of mice per treatment group; numbers in parenthesis represent the minimum and maximum number of neurons counted per mouse within the group. B. Striatal neuronal cell body volume. Mice expressing N171-82Q and mutant (inactive) TRX1 (mTRX1) have significantly smaller neuronal cell bodies than mice expressing N171-82Q and active TRX1. The main effect p-value is 0.0545; pair-wise comparison p-values are on graph. n=5-7, C. Spontaneous wheel running activity is not altered by N171-18/82Q and / or TXN1 expression. See methods for experimental details. n=7-9.
Fig. 6: TRX1 expression decreases striatal neuronal atrophy in HD mice
A. Transcript-encoding TRX1 in HD mice is significant higher than WT littermates in striatum, but not cortex. B. Transcript-encoding TMX3 in HD mice is not altered compared to WT littermates in striatum and cortex. All analyses were in 14-week-old mice corresponding to early-advanced disease. Values are normalized to actin. Shown are means ± 95% confidence interval. n=9-10, p=value: **<0.01.
Fig. 7: TRX1 and TMX3 transcript levels in transgenic N171-82Q HD mouse brain
List of abbreviations
Mutant huntingtin protein, mhtt; Huntington’s disease, HD; endoplasmic reticulum, ER; sodium dodecyl sulfate, SDS; thioredoxin-related transmembrane protein 3, TMX3; thioredoxin 1, TRX1; protein disulfide isomerase family A, member 6, PDIA6.
Competing interest statement
I have read the journal’s policy and have the following conflict. Application serial number 13/854,809 filed with US patent office.
Author contributions
ZL carried out cell culture studies, synthesized plasmid constructs, and assisted with the mouse experiments and writing of the paper. LB carried out the viral synthesis and mouse experiments. JF conceived, designed and coordinated the study and wrote the paper. All authors read and approved the final manuscript.
Introduction
Huntington disease (HD) is an autosomal dominant, neurodegenerative disorder caused by an expanded trinucleotide (CAG) repeat sequence in the first exon of the HD (HTT) gene, leading to an enlarged polyglutamine tract in the encoded protein huntingtin.1 Unwanted choreiform movements, psychiatric and behavioural disturbances and cognitive impairment characterize the disease. Other less well-known, but debilitating manifestations of HD include weight loss, sleep disturbances and autonomic nervous system (ANS) dysfunction.2 Unfortunately, there are no disease-modifying therapies available, although a number of potential disease-modifying drugs are currently in development.2 In order to rapidly assess these drugs in clinical trials there is a pressing need for reliable biomarkers with a high sensitivity to disease progression.3 As HD is a slowly progressive disease such biomarkers could initially be applied as surrogate trial end-points to allow rapid prioritization of potentially effective drugs. Subsequently, promising candidate drugs could be tested further for clinical efficacy in randomized trials using suitable clinical end-points.3
Recently a substantial depletion of cystathionine γ-lyase (CSE), the principal enzyme involved in the generation of cysteine from cystathionine, was shown in HD.4,5 The levels of this enzyme were profoundly decreased in HD striatal cell lines containing 111 glutamine residues, in brains of two transgenic HD mouse models (i.e. R6/2 and Q175 mice) as well as in post-mortem brain samples of HD patients.4 Importantly, the levels of CSE in liver and pancreatic lysates of R6/2 mice were decreased to a similar extent as those in the brain, purportedly due to an aberrant interaction of the mutant huntingtin protein with specificity protein-1, a transcriptional activator of CSE.4 Paralleling findings in individuals with inactivating mutations of the cystathionine γ-lyase (CTH) gene which encodes CSE, a depletion of CSE might result in elevated levels of cystathionine in both blood and urine.6 Therefore, we hypothesized that the levels of cystathionine in both blood and urine may be increased in patients with HD compared to matched controls and that this increase might correlate with disease progression.
Methods
Clinical protocol
We used data and plasma/urine samples collected in our earlier studies, the protocols of which have been described previously.7,8 In brief, nine early-stage HD patients and nine healthy control subjects, matched for age, sex, and body mass index (BMI), were enrolled.7,8 In the patient group, mutant CAG repeat size ranged between 41 and 50. The clinical diagnosis of HD was made by a neurologist specialized in movement disorders (R.A.C.R.). The Unified Huntington Disease Rating Scale (UHDRS) was used to assess HD symptoms and signs. All subjects were free of medication. Subjects were eligible for participation after exclusion of hypertension, any known (history of) pituitary disease, recent intentional weight change (>3 kg weight gain or loss within the last 3 months), and any other chronic conditions except HD. Written informed consent was obtained from all subjects. The study was approved by the ethics committee of the Leiden University Medical Centre. Subjects were admitted to the Clinical Research Center for blood sampling. A cannula was inserted into an antecubital vein and 2-3 mL blood samples were collected with S-monovetten (Sarstedt, Etten-Leur, The Netherlands). Sampling started at 16:30 and continued for 24 hours at 10-min intervals. EDTA tubes were put immediately on ice and centrifuged within an hour at 1610 g at 4 ºC for 20 min, and plasma was stored at -80 ºC. Three standardized meals were served at 09:00, 13:00, and 19:00 h (Nutridrink, 1.5 kcal/ml, 1500–1800 kcal/d; macronutrient composition per 100 ml: protein, 5 g; fat, 6.5 g; carbohydrate, 17.9 g; Nutricia, Zoetermeer, The Netherlands). Subjects remained sedentary except for bathroom visits. Furthermore, twenty-four hour urine was collected and stored at -80 ºC. No daytime naps were allowed. Lights were switched off at 23:00 h and, the next morning, subjects were awakened at 07:30 h. Bioelectrical impedance analysis was used to assess lean body mass and fat percentage at 08:00 h.
Assays
Concentrations of cystathionine as well as 22 other amino acids (alanine, arginine, asparagine, aspartic acid, citrulline, glutamine, glutamic acid, glycine, histidine, isoleucine, leucine, lysine, methionine, ornithine, phenylalanine, proline, serine, taurine, threonine, tryptophan, tyrosine and valine) were determined in fasting plasma samples obtained at 08:30 h and samples from 24-hour urine. Additionally, cystine levels were determined in urine samples only as the levels of this amino acid could not be reliably quantified in stored plasma samples. All samples were analysed once according to a procedure described before9 with minor modifications, on a Biochrom 30 automated amino acid analyser (Biochrom, Cambridge, UK) using standard conditions for physiological amino acid separation. The minor modifications were: 250 µL of plasma (and urine) were used instead of 400 µL, 40 µL of the plasma supernatant (and 20 µL of the urine supernatant) was injected instead of 60 µL and a 13 mm membrane filter was used instead of a 25 mm membrane filter. The detection limits of the assays were 1 μmol/L for plasma and 1 μmol/mmol creatinine for urine and total analysis time was 173 min.
Statistical analysis
Results are presented as medians and interquartile ranges unless otherwise specified. Because of small group sizes the non-parametric Mann-Whitney U-test was applied to assess intergroup differences, while Spearman’s correlation coefficient was used to assess all correlations. All tests were two-tailed and significance level was set at p < 0.05.
Results
Subjects
The HD and the control group did not differ with respect to age, sex, body mass index, body fat or lean body mass (all p ≥ 0.27 , Table 1).
Characteristics of the study population
HD patients*
Controls*
p-value
Male/female
6/3
6/3
–
Age [y]
47.1 (3.4)
48.6 (3.3)
0.691
BMI
24.1 (1.0)
24.3 (0.6)
0.691
Fat [%]
25.5 (2.4)
25.6 (2.4)
0.825
Lean body mass [kg]
57.3 (3.2)
56.2 (3.0)
0.691
Waist-to-hip ratio
0.89 (0.03)
0.94 (0.02)
0.270
Mutant CAG repeat size
44.4 (1.0)
–
–
Age of onset [y]
41.4 (3.0)
–
–
Disease duration [y]
5.7 (1.1)
–
–
UHDRS motor score
22.2 (6.0)
–
–
TFC score
11.7 (0.7)
–
–
*) Values are indicated as mean (SE).
Abbreviations: BMI = Body Mass Index; TFC = Total Functional Capacity; UHDRS = Unified Huntington’s Disease Rating Scale.
Amino acid concentrations
There were no significant differences in plasma or urine concentrations of cystathionine between HD patients and controls (all p ≥ 0.102, Table 2). Neither did the levels of the other amino acids differ between HD patients and controls (all p ≥ 0.102, Table 2).
Amino acid concentrations
Plasmaa
Urineb
HD patients
Controls
HD patients
Controls
Alanine
256 (235-393)
288 (236-444)
37.0 (21.5-43.2)
28.5 (27.6-39.1)
Arginine
99 (69-107)
102 (71-109)
2.2 (1.5-2.7)
2.0 (1.7-2.9)
Asparagine
42 (34-51)
52 (37-58)
13.6 (8.8-23.2)
14.8 (10.7-16.0)
Aspartic acid
9 (8-13)
11 (11-13)
12.6 (11.3-14.2)
11.6 (10.7-12.5)
Citrulline
38 (32-47)
42 (39-45)
0.5 (0.5-2.0)c
0.5 (0.5-0.8)c
Cystathionine
2 (2-3)
2 (2-3)
2.3 (0.9-2.7)c
1.1 (0.5-2.5)c
Cystine
–
–
7.1 (5.8-9.7)
5.6 (4.8-6.5)
Glutamine
626 (530-685)
611 (550-692)
59.3 (35.9-84.0)
45.3 (43.0-57.8)
Glutamic acid
40 (32-67)
40 (34-52)
2.9 (2.3-4.0)
2.7 (2.0-3.3)
Glycine
223 (158-282)
256 (209-307)
129.1 (105.2-286.0)
136.1 (118.5-197.7)
Histidine
75 (63-92)
82 (74-88)
78.1 (46.6-139.7)
79.3 (59.0-94.7)
Isoleucine
60 (53-80)
68 (57-82)
1.5 (0.5-1.7)c
1.1 (0.5-1.6)c
Leucine
133 (104-149)
140 (101-164)
2.9 (2.0-4.1)
3.0 (2.2-3.4)
Lysine
183 (141-218)
187 (176-213)
24.6 (20.9-49.0)
23.4 (20.6-30.9)
Methionine
24 (20-32)
24 (22-34)
2.3 (1.7-2.5)
1.8 (1.4-2.4)
Ornithine
47 (42-58)
47 (39-59)
2.6 (1.3-3.1)
3.0 (1.7-3.9)
Phenylalanine
62 (51-76)
61 (53-73)
6.8 (5.3-8.7)
5.6 (4.1-6.7)
Proline
191 (154-247)
190 (168-264)
ND
ND
Serine
105 (77-125)
111 (107-122)
43.8 (24.0-65.0)
41.4 (35.9-44.6)
Taurine
33 (29-43)
34 (32-43)
84.2 (33.5-100.7)
64.3 (22.9-95.9)
Threonine
113 (95-161)
123 (113-146)
19.1 (10.9-25.6)
15.9 (11.2-18.1)
Tryptophan
59 (36-72)
56 (50-67)
ND
ND
Tyrosine
55 (42-64)
55 (49-66)
10.1 (7.3-16.8)
9.8(6.6-12.1)
Valine
246 (202-257)
247 (203-261)
4.4 (3.2-6.9)
3.9 (3.3-5.0)
Results are presented as medians (interquartile range). ND: not detectable. There were no significant intergroup differences for any amino acid either in plasma or in urine (all p ≥ 0.102).
a) Plasma concentrations are in μmol/L.
b) Urine concentrations are in μmol/mmol creatinine.
c) In some participants amino acid concentrations were below the limit of detection of the assay. In order to calculate summary measures, the expected amino acid concentrations in these subjects were assumed to be half of the detection limit.
Association with clinical features
In HD patients plasma cystathionine levels did not correlate with any UHDRS domain score (all p ≥ 0.33). Conversely, urine cystathionine levels were significantly correlated with the total functional capacity score (r = -0.75, p = 0.020), but not with total motor score (r = +0.44, p = 0.242). Urine cystine levels were associated with both total motor score (r = +0.67, p = 0.050) and total functional capacity score (r = -0.71, p = 0.032). There were no significant associations between cystathionine levels in either plasma or urine and total behavioural score, CAG repeat size or body mass index (all p ≥ 0.71). Of the other amino acids studied urine levels of arginine, aspartic acid, citrulline, isoleucine, leucine and taurine were significantly associated with either total motor score or total functional capacity score (all p < 0.050). Plasma levels of none of these and other amino acids were associated with either total motor score or total functional capacity (all p ≥ 0.092).
Discussion
As recently reported45, a major decrease of CSE, which is the main generator of cysteine from cystathionine, would be expected to result in increased levels of cystathionine in HD patients. However, in this pilot study we found similar concentrations of cystathionine in both fasting plasma samples and samples from 24-hours urine in early-stage HD patients and matched controls. There are several likely explanations for this apparent discrepancy. First, although Paul et. al demonstrated significantly decreased levels of CSE in brains of HD patients, they did not study levels of CSE in peripheral tissues of these patients. Moreover, the depletion of CSE levels in hepatic and pancreatic tissue of R6/2 mice was less pronounced than in their brain tissue.4 Therefore, it could be that CSE depletion only leads to detectable changes in cystathionine levels in brain and/or cerebrospinal fluid, but not peripheral tissues, of HD patients. Second, the post-mortem patient material studied by Paul et al. likely originated from end-stage HD patients, whereas we studied early-stage patients. Thus, given the significant associations between cystathionine levels and disease severity in our small group of patients, it is conceivable that in more advanced HD patients levels of cystathionine will indeed become abnormal.
We neither found any evidence for decreased levels of other amino acids including alanine or the branched chain amino acids isoleucine, leucine and valine in HD patients as reported earlier.11,12,13 We did find an association between urine levels of, among others, isoleucine and leucine and disease severity in our group of early-stage HD patients suggesting that the levels of some amino acids might become abnormal with disease progression, although these associations should be interpreted cautiously given the low amino acid concentrations. Another possible explanation for the lack of differences in amino acid levels between our patient and control group could be that in contrast to previous studies we also accounted for dietary intake by providing the same standardized meals to all participants thereby decreasing confounding effects mediated through differences in dietary composition.10 However, in any case our study does not suggest large changes in any amino acid in early-stage HD patients.
In conclusion, we found no evidence for changes in plasma or urine concentrations of cystathionine or any other amino acid in early-stage HD patients. Although we found associations between cystathionine, as well as several other amino acids, and disease severity, the potential of these amino acids to serve as state biomarkers in HD needs further validation in larger groups of patients.
Competing Interest statement
The authors have declared that no competing interests exist.
Methods: Premanifest HD (n=24), manifest HD (n=27) and control (n=32) participants were asked to screw a nut onto a bolt in one direction, using three different sized bolts with their left and right hand in turn.
Results: We identified some impairments at all stages of HD and in the premanifest individuals, deficits in the non-dominant hand correlated with disease burden scores.
Conclusion: This simple, cheap motor task was able to detect motor impairments in both premanifest and manifest HD and as such might be a useful quantifiable measure of motor function for use in clinical studies.
]]>INTRODUCTION
Huntington’s disease (HD) is an autosomal dominant condition causing neurodegeneration of the cortex1 white matter2,3 and basal ganglia4,5. This leads clinically to motor deficits including chorea, bradykinesia, and dystonia as well as cognitive deficits, circadian rhythm disturbances and psychiatric problems6,7. The ability to robustly detect early motor impairments in HD using a simple cheap test is needed to provide an objective quantifiable measure of motor performance that is useful both clinically and as an endpoint in therapeutic trials, and which can be followed over time. Also more tests that measure everyday motor tasks that impact on functional independence as the disease progresses are required. As such, many groups, including our own, have sought to develop motor tasks to detect and track early changes in premanifest HD (preHD)8,9 including both the finger8,9 and hand tapping tests 10,11,12,13 Motor differences are not just seen in tapping tasks, as other studies have shown that there are changes in the variability of grip force in a grasping task in HD patients 14; a reduction in tongue force in preHD patients 15; a reduction of speech rate in motor speech tasks 16 and impairments in saccade latency and velocity in HD 12,17. Furthermore these simple tasks have been correlated to structural brain changes in HD and preHD 18 as well as cognitive deficits 19. Other more complex motor tasks such as those involving diadochokinetic movements 20 and peg insertions, whilst able to detect impairments in manifest disease are insensitive during preHD 21. Many of these tasks described require specialized equipment and complicated analysis. In this paper we have assessed participants with manifest HD and preHD using a very simple and cheap nut and bolt test which has previously been used to look at the effects of extravehicular activity (EVA) gloves on dexterity, grip force and coordination in healthy participants 22. This new test is ideal for use in HD given its ecological validity, its ease of administration and the fact that it is so inexpensive; this makes it accessible for use in any population of HD patients and it doesn’t require any specialised custom computer software to interpret the results collected. To examine the validity of this new motor task, we tested a large group of individuals at pre-manifest and manifest stages of HD compared to healthy controls. Finally, we examined whether performance on this timed nut and bolt test was related to disease burden score (DBS). We now report for the first time that this simple inexpensive test can detect the earliest motor abnormalities in HD and performance correlates with disease burden scores across the entire disease, and so could be used to target those patients on the cusp of developing overt disease and as such may be suitable for use in new trials of disease modifying therapy.
METHODS
Participants
Participants were recruited from the regional NHS HD clinic at the John Van Geest Centre for Brain Repair between 2012 and 2014. Control subjects with no known neurological disease were recruited from friends or relatives accompanying patients to the clinic. Written informed consent was taken and the nut and bolt data was collected under ethical approval [Reference number:09/H0308/2] approved by Cambridgeshire 2 Research Ethics Committee. To collect additional data the task was also expanded to include patients seen in clinic as part of their routine clinical assessment and the collection of this data was classified as a service evaluation with the Patient Safety Unit at Addenbrooke’s Hospital (Project Register Number: 4256). The work was carried out in accordance with the World Medical Association Declaration of Helsinki 23. All preHD and HD participants had a positive genetic test for the HD mutation and were assessed using the UHDRS motor examination along with their total functional capacity (TFC) sub-section 24. PreHD participants were defined by having a diagnostic confidence level on the UHDRS of less than 4. Disease burden score was calculated using the CAG-Age Product Scale (CAPS) 25,26.
Nut and bolt task
The nut and bolt task was designed as a simple test to examine dexterity of the hands and fingers. The participants were asked to screw a nut onto a bolt in one direction using either the left or right hand; participants were not allowed to flick the nut and the hand holding the bolt had to remain static/stationary. The task consisted of 3 different sized nuts and bolts and was timed for both hands for all conditions. The task was performed using two test conditions; while the hands were supported resting on a table or unsupported, with the hands held in mid air. The task was timed using a standard stopwatch, the timer was started when the participant began screwing the nut onto the bolt and the timer was stopped when the nut reached the top of the bolt and could go no further. All those administering this test were instructed in how to carry out the test, but the simplicity of the task and the use of a simple stopwatch meant that no extensive training was needed.
Statistics
Statistical analysis was performed using IBM SPSS software version 21.0. The main outcome for the task was the time it took for each participant to screw the nut onto the bolt using the left and right hand sequentially, both supported and unsupported. The independent variables were the three groups (Controls, PreHD, HD). Normality for all the dependent variables was tested using one-sample Kolmogorov-Smirnov tests. Group effects for variables that were normally distributed, such as age, CAG repeat, and UHDRS motor score were analysed using parametric tests (ANOVA) followed by post-hoc comparisons (T-test) with Bonferroni corrections where significance was present, all p values reported in the manuscript are already corrected. The group main effect was found to be significant. Variables with a skewed distribution, including data obtained from the nut and bolt assessments were first logarithmically transformed to obtain normality and analysed as above with the exception of the total functional capacity scores which were analysed using Mann-Whitney U tests. Partial Spearman correlations were performed using age as a covariate.
RESULTS
Participant demographics
A total of 83 participants were tested on this task and were divided into 3 groups: healthy controls, preHD and manifest HD participants (See table 1). As would be expected, manifest HD participants had a higher UHDRS total score [p < 0.001] and a lower TFC score [p < 0.001] than preHD participants. Healthy controls and preHD participants displayed similar baseline demographics (age) [p = 0.863], while participants with manifest HD were slightly older than control participants [p = 0.004] (Table 1).
Group
Age
CAG
UHDRS
TFC
Premanifest (n=24)
47.47 ± 2.66
41.73 ± 0.662
3.87 ± 0.975
12.26 ± 0.492
Manifest (n=27)
56.30 ± 2.62*
43.74 ± 0.796
24.07 ± 2.28#
8.78 ± 2.28#
Controls (n=32)
43.08 ± 3.18
–
–
–
Table 1. Table shows mean ± S.E.M. UHDRS: Unified Huntington’s Disease Rating Scale: total motor score, TFC: total functional capacity. *indicates statistically significant difference when compared to controls whereas # indicates statistically significant difference when compared to preHD.PreHD participants show impaired performance in their performance with the non-dominant hand compared to controls.
PreHD participants show impairments in their performance with the non-dominant hand compared to controls.
PreHD participants were impaired on several aspects of the nut and bolt task when compared to the healthy controls, particularly when the non-dominant hand was being tested. Significant changes were observed with all sizes of the nut and bolt when the non-dominant hand was in the unsupported condition [small: p = 0.036. medium: p = 0.006 large: p = 0.001, table 2] and the large nut and bolt when the non-dominant hand was supported [p = 0.034]. In contrast, only one measurement was significantly different when testing the dominant hand [medium, unsupported: p = 0.009] indicating that dominant hand function is relatively well preserved at this stage of the condition (Table 2).
Anti-dopaminergic medication has no effect on performance on the nut and bolt task.
Anti-dopaminergic medications such as sulpiride and olanzapine are commonly used for treating the motor features of HD and hence may have an effect on performance in the nut and bolt task. In order to analyse the effect of such medications, we divided the preHD and HD participants into those who were receiving anti-dopaminergic medications and those who were not. Due to the nature of prescribing such medication for symptomatic relief of the motor features of HD, patients who were receiving such medication were in a more advanced stage of disease and hence were significantly older and a higher total motor score on the UHDRS [TMS: t = 3.29, p = 0.002, Age: t = 2.85, p = 0.006]. Therefore in order to minimise such confounding facts we included age and the total motor score as covariates in our analysis. Our results showed that there was no statistically significant difference in motor performance between those receiving anti-dopaminergic medication and those who were not [F = 1.75, p > 0.111].
Median (Seconds)
p values
Controls
PreHD
HD
Control-PreHD
PreHD-HD
Controls-HD
Non Dominant
Supported
Small
24
29
37
0.435
0.024
<0.001
Medium
19
25
31
0.076
0.04
<0.001
Large
14.5
24
21
0.034
0.093
<0.001
Unsupported
Small
19
25
36
0.036
0.032
<0.001
Medium
14.5
23
30
0.006
0.198
<0.001
Large
10
19
23.5
0.001
0.235
<0.001
Dominant
Supported
Small
23
25
43.5
0.152
0.002
<0.001
Medium
19.6
23
35.5
0.122
0.021
<0.001
Large
17.5
20
29
0.559
0.084
<0.01
Unsupported
Small
21
22
36.5
0.239
0.02
<0.001
Medium
16.5
21
32
0.009
0.052
<0.001
Large
13
15
26.5
0.14
0.006
<0.001
Manifest HD patients are significantly impaired in all domains of the nut and bolt task
Compared to controls the manifest group performed worse on all conditions tested while the preHD group appeared to demonstrate deficits under specific conditions (Table 2). In particular, whereas dominant hand function was not significantly different when comparing preHD to controls, manifest HD participants showed impairments compared to preHD when the dominant hand was tested with the small and medium nut and bolts whilst supported [small: p = 0.002, medium: p = 0.021] and the small and large nut and bolts whilst unsupported [small: p = 0.02, large: p = 0.006]. Performance with the small nut and bolt using the unsupported non dominant hand is significantly impaired at all stages of disease [preHD compared to controls: p = 0.036, HD compared to preHD: p = 0.032] (Figure 1) and correlates significantly with disease burden score (r=0.374), even when controlled for age [p = 0.021] (Figure 2). Finally all components of the nut and bolt task correlated with the patients UHDRS score in both preHD and manifest patients [small non-dominant unsupported nut and bolt: r = 0.494, p = 0.001].
Unsupported small nut and bolt in the non dominant hand in each group. Significance is denoted by asterisks, preHD compared to controls: p = 0.036, HD compared to preHD: p = 0.032.
Fig. 1: Non dominant unsupported hand measurements of time to complete small nut and bolt test for each group.
The time taken for the non dominant unsupported hand to complete the small nut and bolt task correlates with disease burden score [r = 0.374, p = 0.021]. Correlation is significant at the 0.05 level (2-tailed).![The time taken for the non dominant unsupported hand to complete the small nut and bolt task correlates with disease burden score [r = 0.374, p = 0.021]. Correlation is significant at the 0.05 level (2-tailed).](https://currents.plos.org/hd/files/2015/06/Slide12.jpg)
Fig. 2: Small nut and bolt measurement correlates with Disease Burden Score.
Discussion
The ability to detect, quantify and follow the loss of hand dexterity in HD is of importance for diagnosing patients at the earliest stages of disease, monitoring disease progression and evaluating the efficacy of novel treatments. Previous tests that have been proposed to be useful in this regard include finger 8,9 and hand tapping 10,11,12,13 with both tasks tracking disease course over time 10,27,28. However, while they capture changes in motor speed they do not measure changes in dexterity. In our new study, we introduced a novel task: the nut and bolt test, which we have now shown to be a useful way of measuring the impact of HD on fine motor coordination in a large group of patients. In particular, we have found significant differences in performance between preHD and controls in their non dominant hand with the dominant hand function remaining intact until later in the disease course. Furthermore the non dominant nut and bolt performance correlated with disease burden scores suggesting a relationship with proximity to disease onset. Therefore, the nut and bolt task may be both diagnostically useful and helpful for identifying premanifest patients at immediate risk of developing manifest disease who may also therefore be suitable for future trials of disease modifying therapy.
This finding of decreased performance in the non dominant hand is in agreement with the existing literature; specifically the TRACK-HD study that showed that there is a reduction in finger tapping in the non dominant hand over time 28. In the cohort of premanifest and early HD patients, it was found that tapping was one of the few functional measurements that had significant differences in preHD participants compared to controls and also progressed over time 28. Previously, differences in performance on simple speed tapping tasks in preHD and early stage HD cohorts have been correlated with cortical thickness, disease burden scores and motor scores 18 and in another study manifest and early HD patients tapping scores correlated with cognitive test scores, regional brain atrophy and UHDRS scores 19. All of which highlights that these simple motor measures are useful measures of disease stage with a pathology that can also be quantified.
Other motor tasks that have also be used in a similar way in HD include saccadic eye movements in which it has been shown that preHD patients can have a number of abnormalities that seem to track disease course over time 17. Quantitative measurements of tongue protrusion force in preHD and HD have also detected deficits in motor force 15 and in motor speech timing tasks in manifest HD patients showing impaired speech rhythm with defects in speech rate, increased pauses, impaired syllable repetition all of which correlated with motor tapping assessments 16. Other studies have shown slowing of rapid alternating movements in HD patients, as well as deficits in tapping and on peg insertion tasks 20. This confirms earlier findings where the peg insertion task was significantly different in HD patients compared to controls but failed to detect early changes in preHD groups 21. These tasks along with our simple task may suggest that the combination of speed and simple movements may highlight early deficits in HD, especially in the less dextrous non dominant hand. Indeed our nut and bolt task is unique in that is takes into account speed, dexterity, hand movements and motivation and as such may be more sensitive to the very earliest problems in HD which effects all of these functions. This would fit with imaging and post mortem data showing that those brain regions involved in these motor and affective activities are known to be abnormal in preHD and early HD including the striatum 28,29,30 the nucleus accumbens, pallidum 31 precentral and postcentral gyri as well as the supplementary motor area 32. Thus the clinical data sits well with the known neuropathology of premanifest and early HD.
Although, our test has many advantages including its cost and ease of administration and simple interpretation of results there are also some limitations with our study . This includes the absence of longitudinal data, and the need to trial it in larger numbers of patients and the problems of employing it in very advanced patients. However, this latter group are unlikely to be the target of new therapeutic interventions in the first instance, so this is less of an issue. Furthermore the nut and bolt task was timed manually using a standard stop watch and although the timing was not automated, each individual was trained in the same way and thus is unlikely to have contributed to any significant issues on the accuracy of the data collection. However using an automated timer may be a useful addition to our task. Finally our study captured a selection of un-medicated and medicated preHD and HD patients seen in our regional clinic, including HD patients on anti-dopaminergic medication such as sulpiride and olanzapine. Although we found no significant difference in our task in those patients on anti-dopaminergic medications compared to those who were not, we cannot rule out that this may effect their performance. In the future longitudinal studies that specifically address this issue are needed.
In summary, we describe a simple, inexpensive and robust task that is useful in defining disease onset as well as being of possible value in therapeutic trials of disease modifying therapies in both manifest patients and pre-HD patients approaching the time of phenoconversion. Furthermore it can be used in any clinic on its own or as part of a battery of tests to assess dexterity across all stages of HD given its simplicity and low cost.
Competing Interests
The authors have declared that no competing interests exist.
Author Information
Lucy M. Collins and Faye Begeti contributed equally to this work.
Introduction
Most studies into the pathology of Huntington’s disease (HD) focus on the basal ganglia and cerebral cortex1. However, mutant huntingtin is expressed throughout the body and abnormalities have been noted in peripheral tissues, not considered secondary to neuronal damage2,3,4.
Weight loss is one of the most common peripheral features of HD5,6. The underlying mechanisms are not, however, entirely known. Studies have indicated that weight loss is not secondary to inadequate nutrition, nor to hyperactivity5. Studies have instead suggested that loss of body weight results from changes in metabolism7 and also that reduced absorption of nutrients along the intestinal tract may play a role8. Work mostly performed in HD mouse models has demonstrated that tissues and organs that are involved in nutrient absorption are affected8.
In HD mouse models, huntingtin aggregates are abundantly present along the gastrointestinal tract9. The R6/2 mouse, the most widely studied transgenic animal model of HD, exhibits loss of enteric neuropeptides and altered gut motility8. Gastrointestinal function has never been investigated in HD patients, but there are indications that it may be affected. Patients are prone to suffer from gastritis and esophagitis10.
We therefore set out to study the gastric mucosa, using gastric mucosal biopsies as a tool, to look for abnormalities of enteric neurons and mucosal cells.
Materials and methods
Patient demographics
Patients with HD lose weight and have feeding difficulties. In some cases, this is managed by the insertion of a percutaneous endoscopic gastrostomy (PEG) feeding tube. Ethical approval (MREC No. 08/WSE02/66) was given to approach patients after a clinical decision to insert a PEG. Gastric biopsies (from antrum and fundus/gastric body) were obtained from twelve HD subjects during the procedure to insert the PEG. Using the total functional capacity (TFC) rating scale11: 9 patients were at stage 5 (TFC = 0), one patient was at stage 4 (TFC = 1-2) and one patient was at stage 2 of the disease (TFC = 7-10) and had a TFC of 7. The patients were in long-term care and the formal CAG length report was not available for 8 patients (Table 1).
Control samples were obtained from 10 patients; 9 were being investigated for possible coeliac disease, one for altered bowel habit; the gastric mucosa was considered normal by the endoscopist. Ethical approval, covering England and Wales, was granted by the South East Wales Research Ethics Committee (08/WSE02/66) and confirmed in Scotland by the Scottish A Research Ethics Committee (08/MRE00/85). Written informed consent was obtained from all participants in this study.
Patient demographics
Group
N (M/F)
Mean Age (Range)
Control
10 (8/2)
55.5 (41-71)
HD
12 (6/6)
55.8 (25-73)
Immunohistochemistry
The gastric biopsies were fixed in formaldehyde and embedded in paraffin wax according to routine procedures.
Antrum and fundus (gastric body) were cut into 7 μm thick sections using a microtome (Leica SM2010R, Leica Biosystems Nussloch GmbH, Nussloch, Germany).
The different cell types were identified using immunohistochemistry; antrum sections – D-cells (anti-somatostatin antibody raised in rabbit; 1:3000 dilution, kind gift from Prof. J.J. Holst, Copenhagen University, Denmark), G cells (anti-gastrin; 1:2000 dilution raised in rabbit, kind gift from Prof. J.E. Rehfeld, Copenhagen University, Denmark) and fundus (gastric body) sections – parietal cells (anti-H+/K+ ATPase antibody raised in mouse; 1:1000 dilution, kind gift from Prof. A.J. Smolka, UCLA, USA), chief cells (anti-pepsinogen antibody raised in swine, 1:1000 dilution, kind gift from Prof. P.T. Sangild, Copenhagen University, Denmark), endocrine cells (polyclonal anti-chromogranin A raised in goat; 1:1000 dilution, Santa Cruz Biotechnology Inc., Santa Cruz, CA, USA). Antibodies were diluted in PBS containing 0.25% Triton X-100 and 0.25% bovine serum albumin. Prior to immunostaining, sections underwent antigen retrieval by boiling in citrate buffer using a microwave. Sections were incubated with primary antibodies overnight at 4°C in the dark in a humid chamber. The next day, sections were incubated with the appropriate secondary antibodies for 1h at room temperature, followed by DAPI (1:2000, Sigma-Aldrich, Stockholm, Sweden) for 10 minutes: DyLightTM 488-conjugated AffiniPure donkey anti-mouse, 1:1000, Jackson ImmunoResearch Laboratories Inc., PA, USA; FITC-conjugated AffiniPure goat anti-swine, 1:100, BioNordika, Stockholm, Sweden; Cy2-conjugated AffiniPure donkey anti-rabbit, 1:300, Jackson ImmunoResearch; Cy2-conjugated AffiniPure donkey anti-goat, 1:500, Jackson ImmunoResearch. Control incubations were also included without the use of primary antibody; no staining was observed in these sections.
Immunofluorescence was examined using an epi-fluorescence microscope (Olympus BX53, Olympus, Tokyo, Japan) and digital images were acquired using a digital camera (Olympus DP73, Olympus, Tokyo, Japan). Section areas in the antrum with immunostaining against G cells were measured in digitized images using cellSens Dimensions 1.11 software (Olympus, Tokyo, Japan).
Cells were counted upon staining and expressed as total number of positive cells within the whole section (G cells) and related to area of section, or total number of cells per visual field (parietal cells, chief cells and endocrine cells, 400 μm2 and D cells, 100 μm2).
Statistical analysis
All data were analysed using GraphPad Prism 6 (GraphPad Software Inc., San Diego, CA, USA). Data are presented as mean ± SEM, with p < 0.05, one-tailed t-test considered as statistically significant.
Results and discussion
Autolysis prevents the use of human post mortem tissue, therefore in this study, gastric biopsies were obtained upon a clinical decision to insert a feeding tube. Control samples were obtained from patients being investigated for a possible diagnosis of coeliac disease, however, these patients were not considered to have any gastric abnormality. This group of controls were chosen because it was unlikely that they would have any neurodegenerative disease, although one patient had cerebellar ataxia and was being investigated for a possible gluten enteropathy; his problems were eventually considered to be due to an excess intake of alcohol. One of the control patients was being investigated for altered bowel habit and found to have an oesophageal adenocarcinoma arising from a Barrett’s mucosa. Only one patient was established to have coeliac disease.
In order to investigate possible histological differences related to gastric function, we used immunohistochemistry to evaluate the expression of cell specific markers of 2 exocrine cell types in fundus (gastric body) sections, acid-producing parietal cells and pepsinogen producing chief cells as well as markers of 2 endocrine cell types in antrum sections, gastrin producing cells and somatostatin producing cells. We also stained fundus (gastric body) sections with chromogranin A, a protein found in secretory vesicles of endocrine cells and neurons.
In line with previous HD mouse studies showing reduction of GI tract neuropeptides8, using immunohistochemistry, we detected a reduction in the cell density of G-cells in antrum biopsies from HD subjects compared to the control group (Figure 1). We also observed an increase in the cell density of pepsinogen-producing chief cells of the fundus (gastric body) (Figure 1). Possibly, the latter could play a role in the increased risk of gastritis/esophagitis in HD6 since increased levels of pepsin (the active form of pepsinogen) are associated with formation of peptic ulcers12,13,14. There was no change seen in the cell density of gastric acid producing parietal cells. Similarly, there was no change in the cell density of somatostatin-producing D cells, nor in the total number of endocrine cells (as revealed by their chromogranin A expression) in the fundus (gastric body) (Table 2). Interestingly, gastrin is the hormone that upon food intake evokes acid secretion from the parietal cell, mediated by the subsequent histamine release from the ECL cell, indicating that there might possibly be an alteration in parietal cell stimulation in HD subjects.
A, B, D, E, G, H, J, K, M and N show representative fluorescence microscope images of human stomach sections stained for various cell types. A, D, G, J and M are from control subjects, while B, E, H, K and N are from HD patients. Panels C, F, I, L and O show cell counts for HD patients vs. control as indicated. Bars represent mean ± SEM. Scale bars: A, B, J, K – 50 µm; G, H, M, N – 20 µm; D, E – 10 µm. Visual field areas analysed were 400 μm2 for parietal cells, chief cells and endocrine cells, and 100 μm2 for D cells. No significant differences were found between HD patients and controls in fundus (gastric body) sections stained for the presence of parietal cells (A, B and C) or endocrine cells (G, H and I), nor antrum sections for the presence of D cells (M, N and O). Significant differences were observed in fundus (gastric body) sections stained for chief cells (D, E and F), where HD patients had a greater cell density of positive cells, and antrum sections stained for gastrin producing G cells (J, K and L), with HD patients having fewer counts than controls.
Fig. 1: Representative images and cell counts
Cell counts
Cell type
Stomach region
Group
Mean ± SEM
N
P value
Parietal cells
Fundus (gastric body)
Control
243.9 ± 26.78
9
HD
215.7 ± 26.33
10
> 0.05
Chief cells
Fundus (gastric body)
Control
136.8 ± 28.14
9
HD
203.2 ± 16.79
9
0.0298
Endocrine cells
Fundus (gastric body)
Control
279.0 ± 32.32
6
HD
204.2 ± 41.88
5
> 0.05
G cells
Antrum
Control
16.68 ± 3.994
8
HD
8.884 ± 1.845
8
0.0490
D cells
Antrum
Control
43.10 ± 5.496
10
HD
35.43 ± 9.068
7
> 0.05
In summary, our results indicate that in late stage HD, alterations in mucosal cells exist, however, further studies are needed in order to evaluate whether these alterations lead to functional consequences.
Introduction
There has been a growing interest in studying effects of rehabilitation in patients with Huntington’s disease (HD). Several studies of treatment with physiotherapy suggest beneficial effects when using sensitive standard physiotherapy outcome measures1,2,3,4. Observational studies suggest beneficial effects of an intensive rehabilitation approach on symptom development of early to middle stage HD, though there is still a lack of randomized controlled studies in this field5,6,7,8,9.
Zinzi et al [5] described that early to mid-stage HD patients were able to preserve or improve cognitive and motor function after participating in a two year intensive multidisciplinary rehabilitation program that included six in-patient stays, of three weeks each, in a rehabilitation center5. Participants and their caregivers reported improvement in physical function, swallowing, balance, increased independence, mood, less apathy and improvement in social relations6. Piira et al. replicated Zinzi’s study, and found improved balance, gait function, physical quality of life and reduced depressive and anxiety symptoms in patients with early to middle stage HD who participated in a one year multidisciplinary rehabilitation program7. Another study of the effects of a three week long intensive multifunctional neurorehabiliation program in symptomatic HD patients found improvement in ADL- and motor functions8. The authors concluded that rehabilitation of patients with HD should be multifunctional and continuous in order to improve or maintain motor function and functional independence8. Finally, a pilot study of a nine months multidisciplinary rehabilitation program, consisting of weekly training sessions, home-based exercises and occupational therapy, compared with a control group of early to middle-stage HD patients, suggest that multidisciplinary rehabilitation has therapeutic benefits and is well tolerated9.
In 2009, The Norwegian Directorate of Health funded a pilot project to investigate effects of an intensive multidisciplinary rehabilitation program for patients with HD. The primary aim of the project was to replicate the results reported by Zinzi et al.5 , and results of the one year intensive multidisciplinary rehabilitation have been published7. We did a small-scale follow-up study to assess the effects of participation in a multidisciplinary rehabilitation program over two years. The aim of this article it to report results from the cohort of patients, with early to mid-stage HD, that participated in the two year intensive multidisciplinary rehabilitation program.
Methods
Subjects. Ten of 20 HD patients who completed a one year program at the rehabilitation center in Tromsø agreed to continue for an additional year. They were already included in the program based on inclusion criteria in the beginning of the first year of the study: 1) age >18 years, 2) known genetic diagnosis of Huntington´s disease, 3) early to mid-stage HD, equivalent to stages I-III on Shoulson & Fahn rating scale, 4) no diagnoses of severe psychiatric disease, 5) no apparent severe impairment in general cognitive function at the time of first admission.
Procedures. Patients were recruited from the same rehabilitation center during the first year of the rehabilitation program. The project was submitted to the Regional committee for medical and health research ethics who considered this to be a clinical quality improvement project (ref. 2010/2629-7), exempt from approval by the ethics committee, and therefore referred the project to the Norwegian Social Science Data Services which granted approval (ref. 26587).
Patients were admitted in two groups of four to six persons each during 2011-2013. All patients and their family members received written and oral information, and gave their informed consent to participate in the project during the first year and consented to continue for an additional year. The first consent was considered sufficient for the second year since it was not registered as a second study. For all patients, the following demographic information was collected from the medical records at the time of the first admission: age, gender, marital status, estimated disease duration. Furthermore, baseline clinical characteristics were recorded using the standardized assessments of the Unified Huntington´s Disease Rating Scale (UHDRS)10.
Description of the rehabilitation program. The structure of the rehabilitation program was similar to the first year program. In the two year program each participant completed six admissions of in-patient stays of three weeks each. The program included up to eight hours of various activities during weekdays Monday to Friday, and four hours of supervised activities during the weekend. Daily activities included training with physio-, occupational- and speech therapists, group training in the gym and/or in the swimming pool. There were patient education sessions and group discussions as well. Family members were also included in the program. For a detailed description of the program see our earlier report 7. Patients and family members were followed up between admissions in order to ensure adequate local follow-up that could continue after finishing the entire rehabilitation program.
Outcome measures. The same outcome measures as described in our previous report were used, including the a) Timed-up-and-go test (TUG): the time the participant uses to stand up from a chair, walk 3 meters, turn around, walk back and sit down on the chair;11,12 b) 10-Meter Walk Test (10MWT): the participant walks 10 meters as fast as possible, while recording the time to complete; 11,12 c) Six Minute Walk Test (6MWT): measuring the distance (meters) the participant walks within 6 minutes; 12,13 d) Berg Balance Scale (BBS), consisting of 14 subtests covering various activities associated with balance control, where higher scores (max 56) indicate better balance 12,14 e) Activities of Balance Confidence scale (ABC), a 16-item questionnaire describing several tasks for which the participant indicates how confident they are in performing each of these tasks without losing their balance or becoming unstable with a higher score (max 100) indicating higher confidence 12,15 , in order to measure motor function, gait and balance7.
ADL function was assessed using The Barthel index, a 10-item rating scale, evaluating the level of assistance needed by a participant to perform basic activities of daily living16. Higher scores (max 20) indicates better performance.
General Cognitive function was measured by the Mini Mental State Examination (MMSE)17 Change in psychomotor speed and executive function was evaluated using the UHDRS Cognitive Assessment, comprising the following tests: a) Verbal Fluency Test containing letters F, A and S (generating as many words as possible starting with these letters), b) Stroop colour-word test, including three conditions: Stroop colour (naming colour blocks), Stroop Word (reading colour words printed in black ink), Stroop interference (naming the ink colour of incompatible colour words), c) Symbol Digit Modalities Test (SDMT) (the patient has to pair digits to assigned symbols with help of a reference key)10. Higher scores indicate better cognitive function on these measurements. Participants completed a 14-item self-report, The Hospital Anxiety and Depression Scale(HADS), in order to assess symptoms of anxiety and depression18,19.
Participants´ quality of life was assessed using the Short Form-36 (SF-36) a self-reported questionnaire with two component scores, for physical and mental quality of life20. Furthermore, the participants’ body mass index (BMI) was recorded at the beginning and end of each admission. Participants with a BMI lower than 21 were monitored by a dietitian during the in-patient period.
Assessments. Gait and balance assessments were completed at the beginning and end of each admission, resulting in a total of 14 assessment points during the two year period. ABC scale, Barthel index, MMSE, HADS and SF-36 were completed at the beginning of each admission, generating a total of eight assessment points during the two year period. UHDRS Cognitive Assessment was used three times; baseline, 15 months and the evaluation after two years. All assessments were conducted by experienced and trained staff and, if possible by the same staff member during the full two year program.
Statistical analysis. Due to small sample size and non-normal distributions, the non-parametric Friedman’s ANOVA was used to calculate the overall mean change effect from baseline (admission 1), the 15th month evaluation and the final evaluation stay for all the variables. Confidence Intervals (CI) were calculated and reported for all measures at the three measure points. For post hoc procedures, pairwise comparisons between baseline, 15 months evaluation and the final evaluation after two years were performed using the Wilcoxon Signed Rank test. The family wise error rate was controlled for by Bonferoni correction. The SPSS software, version 21 was used for all statistical analyses. Level of significance was set at p<0.05. We will report assessments at the time of the first admission at baseline, and again at 15 months and two years at group level. Additionally, we will report on the individual baseline and final evaluation stay scores for gait, balance and quality of life for the 10 participant who entered the second year of the program for a total eight measure points.
Results
Characterization of the sample. Baseline demographic and other characteristics of these 10 patients were the following: the mean age was 50.0 (SD±14.0) years with 50% (n=5) of the patients being women; 60% (n=6) was married and 90% (n=9) had children. Only one patient (10%, n=1) smoked. All patients had initiated or established an individual plan for coordinated health care prior to entering to the second year of the rehabilitation program, and 60% (n=6) had some professional home assistance. The mean BMI was 23.6 (SD±2.8). Mean time from the baseline to the two year evaluation was 783.0 days (SD±28.0). Mean symptom duration was 6.6 (SD±4.3) years and mean total functional capacity (TFC) score was 8.7 (SD±2.5).The mean scores for the UHDRS motor and behavioral scales were 47.4 (SD±9.8) and 7.4 (SD±6.9), respectively. Mean MMSE score was 23.5 (SD±4.1).
Motor function. Results showed a slight decline or stable function in gait (assessed by TUG, 10MWT and 6MWT) from baseline to the 15 month evaluation and to the two year evaluation (see Table 1). The mean changes in gait assessments from baseline to the evaluation after two years were small and not statistically significant: TUG + 2.5 seconds, 10MWT – 0.17 m/s and 6MWT + 4.3 meters. Minor declines in balance was detected (also shown in Table 1) with a mean change of – 1.4 points for BBS and of 8.7 points for the ABC scale. These changes were not statistically significant. ADL-function as measured by Barthel Index showed a non-significant minor change of -0.2 points from baseline to the two year evaluation.
Analysis of the individual cases showed that, among the six participants who completed the two year program, four had stable or improved gait measured by TUG from baseline to the last measurement point (case 2 -1.8 sec, case 3 -2.1 sec , case 8 -2.4 sec and case 9 +0.8 sec) (see figure 1). Two participants, cases 5 and 7, showed a clinically meaningful decline exceeding 2.98 sec4. Case 5 was stable until the seventh measurement point and then a sudden decline in gait at the eighth measurement point occurred (change +12.8 sec), and case 7 declined slowly over time (+7.6 sec) (See figure 1). Figure 2 illustrates that cases 7, 8, and 9 had stable gait speed measured by 10MWT (changes of -0.1, +0.1 and -0.1m/s, respectively). Cases 2, 3 and 5 experienced a slight decline in gait speed of-0.21, -0.43 and -0.23 m/s, respectively. A clinically meaningful change in 10MWT must exceed 0.34 m/s4. Overall two cases had stable or improved function measured by 6MWT with changes from baseline to the last measurement point of +142 m for case 3 and +82 m for case 8 (Fig.3.). A slight decline in walking distance was found for cases 2, 7 and 9 during the study period (-38, -41and -69 m, respectively). Case 5 had stable function over time but walked 50 m shorter at the last measurement point compared with baseline (shown in fig. 3). Only case 3 had a clinically meaningful change4.
Similar findings were found for balance. In general, BBS scores were stable or improved for four individuals throughout the study period. Changes in BBS from the baseline to the measurement were ±0; +3; ±0 and +2 points, respectively for cases 2, 5, 8 and 9. Cases 3 and 7 experienced a decline in balance (fig. 4) with changes in score from baseline to the last measurements of -3 and -6 units, respectively. Only case 7 had a clinically meaningful change in BSS that exceed 5 points4 .On the ABC scale, only cases 3 and 8 reported increased confidence in their own balance over time with a change in score from baseline to the last measurement of 34.9 and 2.5 units, respectively (Fig. 5). Overall, the participants who did not complete the full two year program (case 1, 4, 6 and 10) had stable balance and gait function until they left the program (shown in figures 1-5).
Cognitive function. The MMSE mean score showed a small improvement of +1.3 points from baseline to the evaluation after two years. The mean scores on the UHDRS Cognitive assessment also showed declines between baseline and the two year evaluation. These declines were -1.0 points for the FAS test (cognitive regulation), -3.3 points for the Stroop color naming task (psychomotor speed, automatization), -5.6 points for the Stroop interference test (psychomotor speed, cognitive inhibition), -5.0 points for the SDMT (psychomotor speed, cognitive effectiveness). The Stroop word reading task (psychomotor speed, automatization) showed virtually no change in score with a 0.3 change. None of these changes were statistically significant. The results are shown in Table 1.
Anxiety and depression. Although patients initially were only slightly affected by anxiety and depression, symptoms of anxiety and depression were reduced from baseline to the evaluation stay (Table 1), and showed a continuous reduction throughout the whole project.
Quality of life. Patients reported improvement in both the physical component score (13.0 points) and mental component score (10.3 points) from baseline to the two years evaluation (Table 1), but these changes were non-significant. Only participant 7 had a slightly lower physical QoL score from the baseline to the final assessment point change, – 3 units, and cases 2, 3, 5, 8 and 9 reported improved or stable QoL (Figure 6). Also change in Mental QoL scores for the individual cases 2, 3, 5, 7 and 8 were positive and only case 9 had a minor reduction of -2 units in QoL scores (Figure 7). The participants that did not complete the full two-year program (cases 1, 4, 6 and 10) did have improvement in QoL until they left the program (shown in figures 6 and 7).
BMI. Patients gained some weight during the project period, as seen by an increase in BMI of 2.4 units from baseline to evaluation. The mean BMI at the end of the evaluation stay lies slightly above the normal range (BMI 18-25) indicating a mean weight somewhat above normal.
Table 1. Mean change in quality of life, cognitive functions, ADL function, BMI, balance and anxiety and depression from baseline to evaluation at 15 months and 24 months. CI, Confidence Interval; SF,36, Short form ,36; MMSE, Mini Mental State Examination; ABC, Activity Specific Balance Confidence Scale; HADS, Hospital Anxiety and Depression Scale; BMI, Body Mass Index; TUG, timed up and go; 10MWT, 10 meter walk test; 6MWT, 6 minutes’ walk test, BBS, Bergs balance scale; FAS, Verbal Fluency Test; SDMT, Symbol Digit Modalities Test
Figure 1. Variation in gait in individual cases measured with “timed up and go test” through eight measurement points (at the time of admission) during two years period.
Figure 2. Variation in gait in individual cases measured with “10 meter walk test” through eight measurement points (at the time of admission) during two years period.
Figure 3. Variation in gait in individual cases measured with “6 minutes’ walk test” through eight measurement points (at the time of admission) during two years period.
Figure 4. Variation in balance in individual cases measured with “Bergs balance scale” through eight measurement points (at the time of admission) during two years period.
Figure 5. Variation in balance in individual cases measured with “Activities of Balance Confidence scale” through eight measurement points (at the time of admission) during two years period.
Figure 6. Variation in Physical part of Quality of Life in individual cases measured with “SF-36” through eight measurement points (at the time of admission) during two years period.
Figure 7. Variation in mental part of Quality of Life in individual cases measured with “SF-36” through eight measurement points (at the time of admission) during two years period.
Discussion
Main findings. The present follow-up study found that six out of ten patients completed the full program. Slight, but non-significant, decline was observed for gait and balance from baseline to the evaluation stay after two years. Non-significant improvements were observed in physical QoL, anxiety and depression, and BMI. ADL-function remained stable with no significant decline. None of the cognitive measures showed a significant decline. An analysis of individual cases revealed that four out of the six participants who completed the program sustained or improved their motor function, while motor function declined in two participants. All the six patients who completed the program reported improved or stable QoL throughout the study period. The participants who were able to complete the two year rehabilitation program showed greater individual variation in function than results at the group level indicated. It seems that individuals with better functional levels at the start, as measured by higher/better scores in gait and balance, are able to sustain achieved results over longer time.
Participation and drop-out. Our findings suggest that participation in an intensive rehabilitation program is well tolerated among motivated patients in early- to mid-stages of HD. Six of the 10 patients completed the entire two-year program as planned. We found that dropout rate among participation in an intensive long-term rehabilitation program will increase over time, similarly to what was found in an earlier study by Zinzi et al.5 where 29 of 40 (72.5%) patients dropped out. The drop-out rate in our project was lower, four out of 10 (40%), but it must also be noted that the 10 patients who started were recruited from 20 patients who had completed a one-year program, and this group may have had a higher motivation than the other patients. Due to disease-related problems and cognitive impairment, it may be challenging to implement rehabilitation programs for patients with neurodegenerative disorders 21,22. Although it can be challenging to motivate HD patients to participate in programs that extend over a long period of time, the results of our study indicate that it is possible to motivate HD patients in the early- and middle stage of disease to follow an extended structured rehabilitation program.
Since HD patients have complex disabilities, including cognitive challenges, rehabilitation programs require intensive multidisciplinary effort to provide the best possible rehabilitation. Overall, we have positive experiences with the implementation of the rehabilitation program for HD patients22. Patients with HD seem to tolerate intensive training/rehabilitation, as long as there is room for individual adjustments. Maintaining the same program structure and familiar surroundings during each admission may be a factor that creates a safe environment. We also think that co-operation with local health care personnel after completion of the program is important for the support of patients in their local municipality. After each stay, a comprehensive medical report was sent to the referring physician and other relevant allied health care personnel, clearly describing the patients’ multidisciplinary needs.
Methodological considerations. This study is not a randomized clinical trial, but a descriptive intervention study over a two year period for a small number of participants. Interpretation of our findings should thus be done carefully due to small sample size and lack of a control group. The program included standardized protocols and systematically executed multidisciplinary approaches, which have been carefully planned in terms of use of assessments, measurement points aiming to have the same experienced rater at both baseline and the final evaluation. The assessment for UHDRS motor function and behavior were not conducted at the final evaluation so we have not been able to detect any changes in these scores. Changes in medication were not studied. Whether and how long the observed beneficial effects of intensive rehabilitation can be sustained among HD patients, needs to be assessed with longer follow-up. There is also a need for randomized clinical trials to study the effect of multidisciplinary intensive rehabilitation intervention on progression of HD. Further, it is important to investigate which patients profit most from such intensive rehabilitation.
Conclusion
Our findings suggest that participation in an intensive rehabilitation program is well tolerated among motivated patients with early to mid-stage HD. The findings should be interpreted with caution due to the small sample size in this study.
Competing Interests
The authors have declared that no competing interests exist.
Introduction
The ability to model disease in cells and animals through targeted modification of the genome represents a powerful approach to understanding genetic and molecular mechanisms underlying disease states 1. New advances in genome editing technology promise to vastly improve the set of tools with which to develop engineered lines 2.
The type II prokaryotic CRISPR (clustered regularly interspaced short palindromic repeats)-associated 9 (Cas9) nucleases are uniquely targeted to a specific genetic locus by a single-guide RNA (gRNA). Specificity of the gRNA is established through a 20 nucleotide homology to the target region which is followed by a 5’-NGG protospacer adjacent motif (PAM), and the complexed Cas9 cleaves the DNA upstream of the PAM 3. The ability to designate sequence specificity to the genomic target based on the customizable base pairing affinity of user-designed gRNAs represents a cost effective, versatile system with which to introduce double stranded breaks in the host genome. Applying this tool, as recent studies have shown, to enhance the frequency of donor DNA-mediated homologous recombination (HR) events may significantly improve the extent to which these types of approaches can be utilized to tailor engineer genomic loci in both cells and organisms 4–7. Specificity of the Cas9 can be further refined by using the mutant Cas9 D10A which results in partial inactivation of the nuclease catalytic activity. This mutation converts the wild-type enzyme which produces double-stranded DNA breaks into a “nickase” enzyme that produces single-stranded breaks at the target site. The Cas9 D10A mutation lowers the rate of nonhomologous end joining (NHEJ) and favors DNA repair by HR at the targeted site.
One way in which this type of targeted genome editing can be used is the generation of mutations in an isogenic background to model disease in human cell lines such as patient derived induced pluripotent stem cells (iPSCs). The effective study of disease states in vitro can be greatly enhanced by the ability to easily introduce defined modifications to the genome of human cells, particularly when combined with the added ability to readily differentiate these cells into disease-relevant subtypes 8. Our previous work has established the utility of gene targeting via traditional homologous recombination (HR) to genetically correct the expanded disease causing polyglutamine (polyQ) mutation within exon 1 of the huntingtin (HTT) gene in HD patient-derived iPSCs 9. Targeted HR-mediated genetic correction of expanded polyQ region to normal length resulted in the reversal of HD-associated phenotypes in the corrected cell lines, providing a useful isogenic cell model system for the study of expanded HTT in human cells 9. While our work demonstrated the feasibility of generating gene modified cell lines through traditional HR based methods, the use of Cas9 nuclease based tools greatly enhances the ability to develop multiple allelic mutations in an efficient manner. We have now adopted Cas9 nuclease based tools to enhance frequency of HR events at this previously characterized locus, while establishing a novel antibody-based approach to measure the relative rate of gene targeting events within our system. The antibody screen using the epitope for the polyQ expansion allows the rapid generation of an allelic series harboring various repeat lengths. The use of the Cas9 D10A lowers the rate of NHEJ and favors HR at the targeted site.
Results
In order to develop technology to rapidly make allelic CAG expanded isogenic lines of polyQ disease iPSCs, we have designed a gain-of-epitope screen to assess targeted recombination events for construction of these lines. We used a modified version of our previous targeting vector 3 that incorporates a disease containing CAG/CAA sequence of 97 repeats and a neomycin resistance cassette (Fig. 1a) to genetically modify the polyQ repeat length via homologous recombination. To target Cas9 nuclease activity to the region of HTT exon 1, we have generated two gRNA sequences that are unique in the genome and which cut within 100 bp of the CAG region of exon 1 of the HTT gene. The specificity of these HTT gRNAs was assessed, and both were confirmed to be unique targets in the genome 10 (Fig. 1a, Supplementary Fig. 1a). We assessed the ability of these HTT gRNA constructs to enhance targeting donor mediated recombination in 293F cells. Cells were transfected with either HTT gRNA1, HTT gRNA2, AAVS1-1 gRNA (control targeting different site), or empty vector, and co-transfected with or without targeting donor construct and a human codon-optimized Cas9 expression plasmid, hCas9 11. Transfection and processing steps were done using a protocol that would allow for both western blot analysis and colony number counting over multiple conditions and several replicates (Fig. 1b). Experimental replicates were established at time of transfection, and the cells for colony counting and western blot analysis are representative of the same original transfection replicate maintained in selective antibiotic G418.
(a) Homologous donor containing a neomycin resistance cassette 1.5 kb upstream of exon 1 as described previously was used as a donor. Cas9 guide RNA (gRNA) sites were designed near the translational start site of the gene. HTT gRNA sequences were designed based upon criteria described previously. (b) Experimental design for treatment of 293F cells with Cas9 constructs. Cells were lipofected at day 0, placed on selection at day 1 and remained on selection until the cells were harvested at day 18. (c) At day 18 cells were fixed and stained with methylene blue/methanol and scanned on a flatbed scanner. Resulting scans were analyzed with the colony counting function in ImageJ. (d) There was a significant increase in colonies in all cells treated with Cas9, HTT gRNA and donor. This increase was most pronounced in cells expressing WT Cas9 and HTT specific gRNAs. The increase in colony number was donor-dependent.
Fig. 1: Homologous recombination strategy for introduction of the polyQ expansion in HTT exon 1 into wild type cells.
We first counted neomycin resistant 293F colonies to determine relative donor construct integration between transfection replicates. We fixed and stained colonies using methylene blue (Fig. 1c). Quantification of methylene blue stained clonal colonies revealed striking differences in the number of neomycin resistant colonies (Fig. 1d). Cells transfected with HTT gRNA1 or 2 in the presence of donor and Cas9 expression show a statistically significant increase in colony number over Cas9 background or donor alone. This suggests that the donor integration is significantly enhanced in a Cas9/gRNA-mediated manner. As expected mock transfected cells show no surviving colonies, Cas9 + control gRNA transfected cells show a low level of background neomycin resistance which is higher than donor alone, but is not statistically significant. We also used nickase Cas9 D10A, a form of the enzyme where one of two nuclease domains is inactivated, creating a single stranded nick as opposed to a double stranded break. Cells transfected with the mutated Cas9 D10A in the presence of donor and HTT gRNA2 also show a significant increase in colony number over donor alone (Fig. 1c,d). This increase was slightly lower than the WT Cas9 transfections, and not significantly higher then the control AAVS1-1 gRNA but upon further screening of western and Southern blot analysis proved substantial-see below. This underscores the importance of having an expedient additional screening method to detect targeted insertions, as the neomycin only screen would result in the Cas9 D10A appearing ineffective.
While colony number is a strong indicator of construct integration, many factors including random integration events can result in colony resistance to selective antibiotics. Therefore, we developed a rapid epitope based screen for recombination. The monoclonal antibody 1C2 detects the homopolymeric glutamine stretch epitope MAB1574 originally from TATA box binding protein (TBP) containing a 38 glutamine stretch, and has been shown to have strong specificity to the expanded polyQ length forms of HTT and other polyQ expansion disease proteins12. 293F cells carry wild type non-expanded HTT and therefore targeted integration of expanded HTT is reflected by a gain of 1C2-recognizable epitope that can easily be measured by western blot analysis of clonal or mixed clonal cell populations. We took advantage of this characteristic to allow us to measure relative levels of targeted expansion in our 293F cells. Protein lysates were collected and equal protein amounts were analyzed by western blot for relative immunoreactivity to 1C2 (Fig. 2). Remarkably, Cas9/HTT gRNA/donor transfected cell lysates show distinct, measurable levels of 1C2 immunoreactivity, with a significant increase in 1C2 levels relative to control gRNA (Fig. 2a,b). Similarly, nickase Cas9 D10A/HTT gRNA/donor transfected cell lysates showed comparably high levels of 1C2 immunoreactivity relative to control (Fig. 2a,c). A separate experiment using the same system with no selection in 293T cells yielded appreciable 1C2 signal in all Cas9 and HTT gRNA treated conditions (Supplementary Fig. 2). Additionally, we detected comparable 1C2 immunoreactivity in lysates from 293F cells co-transfected with donor and two independent HTT TALEN pairs that had also been characterized for this locus (Fig. 2a, Supplementary Fig. 1b,c). 1C2 levels are reflective of abundance within the total colony pool of a sample. While differences in clonal numbers make it difficult to compare absolute frequencies between WT Cas9, nickase Cas9 D10A, and TALEN, these 1C2 levels clearly reflect a marked increase in polyQ expanded cells compared to the control, offering a convenient way to verify target site homologous recombination events. To gauge the representation of 1C2 positives in the neomycin resistant pool, we performed clonal 1C2 western analysis on individual colonies picked from Cas9 D10A/HTT gRNA1/donor transfected cell populations after neomycin selection. All 12 clones picked showed a strong 1C2 band compared to control gRNA and untransfected controls (Fig. 2d). Taken together, we conclude that CRISPR-assisted HR results in an increase in colonies over TALENs, with a similar rate of homologous recombination of those colonies.
(a) To identify 1C2-reactive full-length HTT protein indicative of homologous recombination a western blot assay was utilized. Total HTT (MAB2166) and β-actin are also shown. (b) Quantitated levels of 1C2 signal normalized to β-actin are significantly increased in cells treated with WT Cas9 and HTT specific gRNAs realtive to cells treated with a gRNA targeting a different (AAVS1) locus in the genome. (c) Cas9 D10A show significant increase in HTT gRNA2-mediated recombination relative to control, AAVS1 gRNA assisted cells. (d) 1C2 western blot analysis of individual clones (1-12) transfected with Cas9 D10A, HTT gRNA1, and donor compared with control gRNA and untransfected controls.
Fig. 2: Pooled 293F neomycin-resistant cells were analyzed by western blot.
To further support these findings, we transfected HD patient derived HD-iPSC cells with the 97Q targeting donor construct in the presence or absence of WT Cas9 and HTT gRNA2 as described previously 9. Cells were selected for 3 weeks on G418 in feeder free medium, before individual clonal colonies were manually picked and transferred to individual wells for expansion and genomic DNA analysis (Fig. 3a). The HD-iPSC line carries HTT polyQ lengths of 19 and 72 repeats which can be measured by PCR amplification. Using separate primer sets to amplify either the endogenous exon1 CAG repeat region or the modified exon1 97Q CAG repeat region, we determined that 2 of 36 neomycin resistant colonies picked in the donor only transfected cells showed a loss of endogenous CAG product coupled with a gain of the modified 97Q band while from cells transfected with Cas9, HTT gRNA2, and donor, we found 8 of 60 such colonies (Fig. 3b,d). Western blot analysis showed 7 of these colonies were immunoreactive to 1C2 antibody (data not shown). Further genomic analysis of the clonal DNA by Southern blot analysis showed that neither of the two donor only candidates are positive for targeted recombination, while 7 out of 8 of the Cas9/HTT gRNA2/donor transfected colonies are positive for this specific recombination event consistent with the 1C2 screen (Fig. 3c,d). The observed recombination rates (approx. 12%) with Cas9 and HTT gRNA are remarkably higher in comparison to the previous frequencies that we have reported at this locus by traditional homologous recombination (1.0%).
(a) Experimental design and screening process for transfected iPSCs. (b) Candidates for potential targeted integration of HTT exon 1 97Q donor knockin events are screened first by PCR. Separate primer sets specifically amplify either the endogenous CAG length (first lane of each clone) or the introduction of the modified 97Q exon 1 (second lane). Candidates were identified by the loss of one endogenous band coupled with gain of 97Q band. (c) Genomic DNA from iPSC clones are digested with HindIII and probed with a 300 bp radiolabeled probe that is specific to a region external to the targeting donor sequence. Successful integration of targeting donor sequence results in the introduction of a HindIII site that results in truncation of the non-targeted fragment length from 10 kb to 5 kb. (d) Table summarizing frequency of HR and conditions.
Fig. 3: Cas9-mediated homologous recombination in iPSCs.
Discussion
We show that CRISPR/Cas9 system can be utilized to perform homologous recombination in human cells to generate a HD isogenic allelic series (21, 72, 97 CAG). In our study, we compared the Cas9 vs. Cas9 D10A enzymes for their ability to mediate this event using two distinct endpoints. The use of Cas9 D10A is likely to be more selective with less off target effects. When we compared CRISPR-assisted HR using methylene blue stained clonal colonies it appeared that the wildtype Cas9 was much more effective at mediating HR. However, when we analyzed the same experiment in our 1C2 western blot assay which only detects HR events at the Htt locus due to the introduction of the 97 CAG repeats, we found that both Cas9 and Cas9 D10A were similar in generating the 97CAG expansion at this site. It is likely that the wild-type Cas9 introduces off target invents that allow for more colonies resistant to neomycin than the Cas9 D10A enzyme.
Our results suggest that CRISPR-assisted homologous recombination is a useful technology that can be effective in enhancing donor-mediated gene targeting events in both 293 cells and human iPS cells. Utilizing an antibody-based method to screen for recombination events that alter structural epitopes or introduce new epitopes such as gain of 1C2 reactivity represents a novel method for identifying targeted candidates or assessing targeting efficiency in a polyclonal pool of cells without the use of an artificial reporter system. Indeed it may eliminate the need for single colony screening or extensive Southern blotting. Combining these two technologies, we are able to demonstrate the efficient generation of genetically modified human cell lines for study of HD. Given the growing excitement in the field of genome editing, our screen offers a novel antibody based method for screening for HR events and optimization of this technology 13,14. Using drug libraries or siRNA approaches with this screen could reveal novel pathways/modulators of HR. In summary, we provide further tools for understanding HR using the CRISPR/Cas9 system and for the creation of relevant polyQ disease models.
Methods
Generation of HTT exon 1 gRNA sequences. Guide RNA sequences for the CRISPR nuclease system were designed as described in Mali et al.11. Briefly, sites that contained the sequence G(N20)GG near exon 1 of HTT were identified. Candidate sequences were then analyzed in BLAST to determine whether they were unique in the genome. Two HTT gRNA targets, uniquely present in the genome were identified, these sequences were cloned into the Church lab gRNA_Cloning Vector (addgene plasmid 41824) utilizing the primer annealing strategy published by the Church lab. Primers of sequences: TTTCTTGGCTTTATATATCTTGTGGAAAGGACGAAACACCGCCTCCGGGGACTGCCGTGC (gRNA 1 Forward) and GACTAGCCTTATTTTAACTTGCTATTTCTAGCTCTAAAACGCACGGCAGTCCCCGGAGGC (gRNA 1 Reverse) and TTTCTTGGCTTTATATATCTTGTGGAAAGGACGAAACACCGGAGACCGCCATGGCGACCC (gRNA 2 Forward) and GACTAGCCTTATTTTAACTTGCTATTTCTAGCTCTAAAACGGGTCGCCATGGCGGTCTCC (gRNA2 Reverse) were annealed and ligated into AflII-linearized gRNA_cloning vector by Gibson assembly. Resulting colonies were sequenced and maxiprepped with the Qiagen Plasmid Plus kit.
Generation of TALENs. TALENs 1 and 2 were designed to cleave within a 13 bp segment of the genomic DNA in the 5’ UTR region of HTT. The binding sites of both TALENs flank the predicted cleavage site. These two TALENs were selected from a pool of 10 TALENs designed for the same target site on the basis of efficient cleavage on a surrogate reporter plasmid in an in vivo transient transfection assay.
Generation of HTT 97Q donor. A modified 240 kb BAC (RP11-866L6) containing the 170 kb human HTT locus with an exon 1 containing 97 mixed CAG-CAA repeats 15 was modified stepwise using a Red/ET-based recombineering kit (Genebridges). First, a PGK-neo expression cassette flanked by FRT recognition sites was inserted 1.5 kb upstream of exon 1. The 20 kb fragment, including exon 1, inserted expression cassette, a 4.5 kb upstream short arm, and a 10 kb downstream long arm, were inserted into a modified pPNT vector (neo cassette removed) adjacent to the HSV-TK.
Transfection and selection of 293F cells. Low passage 293F cells (passage 8) were grown in the DMEM high glucose +NEAA +NaPyruvate +10% FBS and plated overnight on 6 well plates (Corning) at a density of 500,000 cells per plate in 2 ml media. Cells were then transfected with Lipofectamine 2000 (Life Technologies) according to manufacturer’s instructions. Briefly, 3 μg of DNA (1 μg Donor, 1 μg gRNA, 1 μg Cas9 or pCDNA3.1 empty vector) was diluted in 250 μL DMEM and mixed with 5 μL LF2000 diluted in 250 μL DMEM and allowed to incubate for 5 min prior to mixing. DNA-LF2000 complexes were then allowed to form for 30 min, and the mixture added to plates. After 24 h, media was replaced with media containing 750 μg/ml G418 (Life Technologies). Cells were passaged at day 4 and media replaced at days 7, 10 and 14. Cells were harvested or stained with methylene blue at day 18.
Methylene blue staining and colony counting. 6 well plates were collected (18 d) and stained using 0.2% (w/v) methylene blue in 50% methanol for 20 min. Plates were then washed extensively in milliQ H20, allowed to dry and scanned on a flat-bed scanner. Images were then analyzed in ImageJ as followings: Color images were converted to binary. Particle size was set from 10-infinity. An identical circular ROI was used for all wells in order to exclude the side walls and other artifacts. Particles were measured and both counts and area fraction were entered into excel. Count data were analyzed by one-way ANOVA after transformation by taking the square root of the observed colony number, as is recommended for counts of colonies.
Western analysis of neomycin resistant 293F cells. Cells were harvested by scraping, spun down for 2 min at 1000xg and lysed in MPER (Thermo Scientific) containing protease inhibitors. 25 μg of each sample was loaded on a 12 well 4-12% Bis-Tris gel in MES buffer (Life Technologies) and run at 200 volts for 60 min. Protein was then transferred to a nitrocellulose membrane at 20 volts for 14 h. Membranes were blocked and probed with 1C2 (Millipore 1:1000) in 5% milk in TBST. After detection, blots were reprobed with antibodies against HTT (MAB2166, Millipore 1:1000) and β-actin (Cell Signaling 1:1000).
Transfection 293T cells. Low passage 293T cells (passage 8) were grown in the DMEM high glucose +NEAA +NaPyruvate +10% FBS and plated overnight on 6 well plates (Corning) at a density of 500,000 cells per plate in 2 ml media. Cells were then transfected with Lipofectamine 2000 (Life Technologies) according to manufacturer’s instructions. Briefly, 3 μg of DNA (1 μg Donor, 1 μg gRNA, 1 μg Cas9 or pCDNA3.1 empty vector) was diluted in 250 μL DMEM and mixed with 5 μL LF2000 diluted in 250 μl DMEM and allowed to incubate for 5 min prior to mixing. DNA-LF2000 complexes were then allowed to form for 30 min, and the mixture added to plates. Cells were grown for 6 days and harvested for western blot.
Western analysis of unselected 293T cells. Cells were harvested by scraping, spun down for 2 min at 1000 x g and lysed in MPER containing protease inhibitors. 25 μg of each sample was loaded on a 12 well 4-12% Bis-Tris gel in MES buffer (Life technologies) and run at 200 volts for 60 min. Protein was transferred to a nitrocellulose membrane at 20 volts for 14 h. Membranes were blocked and probed with 1C2 (Millipore 1:1000) in 5% Milk in TBST. After detection, blots were reprobed with antibodies against HTT (MAB2166, Millipore 1:1000) and β-actin (Cell Signaling 1:1000).
Electroporation of hiPSCs. Feeder-free HD-iPSCs were grown on matrigel (BD Biosciences) coated plates in mTeSR medium (Stem Cell Technologies). Cells were grown to 70-80% confluency and were pre-treated with 10 μM Y-27632 ROCK inhibitor for 1 h. Cells were then dissociated by TrypLE (Life Technologies) treatment for 2-3 min and spun down at 200 x g. Cells (1 x 10⁶) were resuspended in 100 μl nucleofector human stem cell solution 1 including supplement (Lonza) and immediately nucleofected with program A-027. Cells were transferred to 2 ml pre-warmed RPMI+20% KSR and incubated at 37oC for 15 min, then transferred to pre-warmed mTeSR on Matrigel coated plates at a density of 1-2 x 10⁶ cells per 10 cm plate. G418 at 50 μg/ml was added starting at 24 h post-nucleofection and continued for 21 d with daily changes of medium. Surviving colonies at 21 d were manually passaged by incubation with 0.4 mg/ml collagenase for 30-90 min, dissociation with a 200 μl pipette tip, and transfer to 96-well plates.
PCR screen and Southern blot analysis. Duplicates of iPSC clones were grown and passaged to 24-well plates. Cells were incubated overnight in lysis buffer, followed by precipitation in equal volume of isopropanol and 70% EtOH wash. DNA was resuspended in TE. The crude genomic preparation was screened first by PCR protocols amplifying the CAG repeat region of the HTT gene using separate sets of primers to amplify either the endogenous exon 1 CAG repeat sequence or the modified 97Q exon 1 CAG repeat sequence. Clones showing both the loss of an endogenous allele and the gain of expanded 97Q allele were tested by Southern blot analysis as described previously 9.
Introduction
Huntington’s disease (HD) is a hereditary autosomal neurodegenerative disorder caused by an expanded Cytosine-Adenine-Guanine (CAG) repeat in the HD gene 1 . The disease is characterized by motor disturbances, psychiatric symptoms and cognitive decline 2,3. A clinical diagnosis of HD is typically made when an individual has overt motor symptoms and a family history of Huntington’s disease. Average age of diagnosis is 40-45 years, but often symptoms have already been present for several years at the time of diagnosis 2. Disease duration is commonly between 15-20 years, but symptom development and severity vary greatly between individuals. Motor symptoms are most visible and result in gait and balance problems. However, cognitive and behavioral changes are known to frequently occur many years before clinical diagnosis 4,5 resulting in functional decline already early in the disease 6. Additionally, metabolic changes (increased appetite, weight loss etc.) and sleep disturbances are known to develop 4,7,8. Current treatment of persons with HD consists mainly of symptom management and improving quality of life 7. A multidisciplinary approach in the management of persons with HD is recommended 9.
In recent years, the interest in investigating the effects of non-therapeutic agents for managing and improving the symptoms of HD has been growing. Multiple studies have investigated treatment with physiotherapy. These studies showed beneficial effects and have also investigated sensitive standard physiotherapy outcome measures 10–15. Additionally, two important multidisciplinary rehabilitation studies have been conducted 16–18. Zinzi et al (2007) reported that early to mid-stage HD patients who participated in a two-year intensive multidisciplinary rehabilitation program, containing six in-patient stays of three weeks in a rehabilitation center, were able to maintain or improve their cognitive and motor function 16. However, only 11 of 40 participants completed the full two-year program. Reasons for loss-to-follow-up are unknown. Participants and caregiver´s who completed at least one course of the full rehabilitation protocol program (3-week intensive multidisciplinary treatment) reported improvement in physical function, swallowing, balance, increased independence, improvement in mood, less apathy and improvement in social relations 17. Another study is a pilot study comparing participation in a multidisciplinary rehabilitation program (once a week over 9 months combined with home-based exercises three times a week for 6 months) with a control group of early to middle-stage HD patients. The results of the study suggest therapeutic benefit and good tolerance of multidisciplinary rehabilitation 18. Currently, there still is a lack of randomized clinical trials investigating the effects of multidisciplinary rehabilitation programs or other forms of non-medical treatments.
In 2009, The Norwegian Directorate of Health initiated the establishment of a pilot project to investigate effects of HD patients’ participation in an intensive multidisciplinary rehabilitation program. The primary aim of the project was to replicate the results reported by Zinzi et al. (2007). Additionally, the present project aimed at performing a more in depth quantitative evaluation by using a greater variety of assessments, including measures of quality of life, ADL function, motor and cognitive function throughout three times 3-week intensive multidisciplinary rehabilitation program. Another goal was to obtain better retention numbers by closely following up the participants during the course of the program. Providing information about the rehabilitation program prior to the first time admission and information in the end of each rehabilitation stay for participants and his/hers family member and local caregivers were important to secure retention in programs. Participants/ families had also possibility to contact directly institutions also between the rehabilitation stays. The final and important goal of this project was to implement the establishment or initiation of coordinated health care and social services for participants, using a so called “Individual plan”. An Individual Plan is a statutory tool for co-operation between patient and local health care providers or the labour and welfare organization to secure long-term follow-up for persons with chronic diseases and disabilities in Norway. It contains an outline of patient’s goals, recourses and the services he or she may require due to disability. It is not conditional on any particular diagnosis or age. It’s not required that patient need to receive specialist healthcare to receive this plan and it can be used at any level of health care services. It also specifies when the different actions are to be carried out and who is responsible to execute these actions 19.
This project included a quantitative and a qualitative evaluation. The present paper reports the quantitative results after one-year participation in the program. Results of the qualitative evaluation of the experiences of the participants, their family members and healthcare providers will be reported elsewhere.
Methods
Subjects
A total of 37 patients were enrolled in the rehabilitation program in the two rehabilitation centers in Vikersund and Tromsø. The following inclusion criteria were used: 1) age >18 years, 2) known genetic diagnosis of Huntington´s disease, 3) early to mid stage HD, equivalent to stages I-III on Shoulson & Fahn rating scale, 4) no diagnoses of severe psychiatric disease and 5) no apparent severe impairment in general cognitive function at the time of first admission.
There was no a specific cognitive testing prior to patient enrollment to the program. The referring physicians were asked to do a clinical evaluation of the patient, and the main focus was whether or not the patient was able to stay in the institution within being helped with daily functions such as dressing/undressing and daily hygiene.
Procedures
Information about the project was spread by posting information on the web sites of both inpatient rehabilitation centers, the web site of a specialized national competence center for rare diseases, and announcements through the Norwegian patient association for HD. Participants were referred by their general practitioners or by specialists in neurology or psychiatry. Based on referrals and the patients’ own preference, they were enrolled in the rehabilitation programs in the two sites. The project was submitted to the ethics committee who considered that a formal approval was not necessary (ref. 2010/2629-7), and thus approval was only obtained from the Norwegian Social Science Data Services. Participants were included in groups of four to six persons during 2010 – 2012. All participants and their family members received written and oral information, and gave their written informed consent to participate in the project. The participants in the present study all completed an evaluation stay three months after discharge of the third stay. For all participants the following demographic information was collected from the medical records at the time of the first admission: age, gender, marital status, estimated disease duration. Additionally, baseline clinical characteristics were collected using standardized assessments, including the motor, functional and behavioral assessment of Unified Huntington´s Disease Rating Scale (UHDRS) 20.
Description of the Rehabilitation program.
The structure of the rehabilitation program was identical for both rehabilitation centers, with three in-patient stays of three weeks each during one year. The program consisted of up to 8 hours of various activities five days a week, from Monday to Friday, and one of the sites (Tromsø) also offered four hours of supervised activities during the weekend. Each day included specific daily training activities with physio-, occupational- and speech therapists, as well as training in groups in the gym and/or in a swimming pool. Additionally, there were patient education sessions and group discussions for participants. Physical therapy focused on improvement of balance and gait, occupational therapy sessions included training of Activities of Daily Living (ADL) and cognitive function, fine motor exercises and assessment of the need for assistive devices. Dietitians followed-up each participant and a social worker and psychologist also offered individual follow-up. For those who had a low Body Mass Index (BMI) (< 21) and / or had problems with swallowing, dietary adjustments were made and a dietitian monitored their progress during their stays. Nurses observed and helped participants with reduced cognitive function or who showed problems in ADL function due to chorea.
If necessary, participants received medication adjustment throughout the project period. Most adjustments were made by a neurologist in order to reduce choreatic movements or other motor and clinical symptoms such as depressive symptoms and sleep disturbances.
Family members were included in the program during the first few days of the first admission as well as during the evaluation stay. If necessary, additional follow-up for participants and family members was provided between the various rehabilitation admissions. Furthermore, the program aimed at establishing good co-operation between the rehabilitation centers and the health care professionals in the participant’s local community, with the aim of securing adequate follow-up after participants completed the in-patient rehabilitation study. There was special emphasis on establishing of an Individual plan. A multidisciplinary team set rehabilitation short and long-term goals together with the participant. Each participant was discussed in a multidisciplinary team during each stay in order to secure optimal rehabilitation for each individual. Further information about description of rehabilitation program is in the Appendix, table A.
A health economical analysis was not built into the evaluation. The program was established with-in the current reimbursement scheme for rehabilitation in Norway, with a daily reimbursement of approximately 3 000 NOK (equals 500 USD) per patient. The cost of a three-week program for each patient will hence be approximately 63 000 NOK (equals 10 500 USD).
Description of outcome measures
Motor function
As measures of motor function, gait and balance were assessed using the following tests: a) Timed-up-and-go test (TUG): the participant stands up from a chair, walks 3 meters, turns around, walks back and sits down on the chair again while being timed. 21,22 b) 10-Meter Walk Test (10MWT): the participant is asked to walk 10 meters as fast as possible. A 10-meters walking area has two meters extensions before and after starting and finishing line so that allows participant to start and finish walking smoothly. The time to complete walking 10 meters was recorded and average gait speed was calculated. 22,23 c) Six Minute Walk Test (6MWT): the distance the participant walks within 6 minutes is measured in meters, 23,24 d) Berg Balance Scale (BBS), which consists of 14 subtests covering various activities such as static posture, transition, challenging positions, associated with balance control. The quality of performance on each of the 14 tests was recorded using a 4-point scale gaining a maximum score of 56 points. High scores indicate better balance 22,25. e) Activities of Balance Confidence scale (ABC), which is a questionnaire with 16-items describing various tasks for which the participant indicates for each of them how confident they are in performing these tasks without losing their balance or becoming unstable. A higher score indicates higher confidence 26. Assessments a) – d) were completed at the beginning and end of each admission, resulting in a total of seven assessment points. Assessment e) was completed at the beginning of each admission, generating a total of four assessment points.
Activities of Daily Living
Barthel index, a 10-item rating scale, was used to evaluate the level of assistance needed by a participant to perform basic activities of daily living 27. Four items were rated 0-3 or 0-1, and rest of the six items were rated 0-3 for a total maximum score of 20 with higher scores indicating better performance. This test was assessed at the beginning of each admission, a total number of four assessments points.
Cognitive function
Mini Mental State Examination (MMSE) was used to evaluate the participants’ general cognitive status. The maximum score is 30 points, with higher score indicating better general cognitive status. A score below 24 is an indication of general cognitive impairment 28. The MMSE was conducted at each admission. The results from the first admission and the evaluation assessment are reported. The UHDRS Cognitive Assessmentwas used to evaluate change in cognitive function from baseline to evaluation stay 20, and includes the following tasks: a) Verbal Fluency Test, requiring the participant to generate as many words as possible beginning with a specific letter (F, A and S) in 60 seconds. The score is the total number of correct words for the three letters. b) Stroop colour-word test, which includes three conditions: naming colour blocks (blue, red or green); reading colour words printed in black ink; naming the ink colour of incongruous colour words (e.g. the word “red” written in green ink). For each condition the score is the number of correct responses produced in 45 seconds. c) Symbol Digit Modalities Test, a paper and pencil task, in which the participant is required to pair digits to assigned symbols using a reference key. The score is the total number of correct written responses in 90 seconds. Higher scores indicate better cognitive performance. The tasks are measures of psychomotor speed and executive function.
Depression and Anxiety
The Hospital Anxiety and Depression Scale (HADS) is a 14 item self-report questionnaire, and was used to assess symptoms of anxiety and depression. Each item is rated 0 – 3, generating a maximum total score of 42 points. Even items from the Depression sub-scale and uneven items from the Anxiety subscale is also possible to rate 29,30. The HADS was administered at the beginning of each admission.
Quality of Life
The Short Form-12 (SF-12) a self-report questionnaire consisting of two component scores for Physical and Mental quality of life, respectively, was used to assess the participants´ quality of life and participation and was assessed at the beginning of each admission 31.
Additionally, the participants’ BMI was assessed during each stay. Participants with a BMI lower than 21 were monitored by a dietitian during the full three-week stay. All assessments were conducted by experienced staff, as far as possible, by the same staff member. The UHDRS motor and cognitive assessments were performed by the same trained professionals (JCF and MvW). All outcome measures used in the present study are widely used in the field of neurological and geriatric rehabilitation.
Statistical analyses
For gait and balance variables, the linear mixed effect model of Analysis of Variance (ANOVA) was used to show mean changes from baseline (stay 1) for stay two, stay three and the evaluation stay (stay 4). In the case of a non-normal distribution, non-parametric Friedman’s ANOVA test was used.
For the remaining variables, comparison between baseline and the final evaluation was done using Paired t-test or non-parametric Wilcoxon Signed Rank test depending on the distribution of the data.
The SPSS software, version 20 was used for all statistical analyses. Level of significance was set at p<0.05.
Results
Characterization of the sample
A total of 37 patients were enrolled in the rehabilitation programs with the following demographic characteristics at baseline: the mean age of the participants was 52.4 (SD±13.1) years and 51.4% (n=19) of the participants were women. 54.1% (n=20) were married and 83.8% (n=31) had children. A minority of participants (24.3%, n=9) were smokers. An Individual Plan was established for 35.1% (n=13) and 44.2 % (n=16) received some kind of assistance at home. Mean symptom duration was 7.2 (SD±5.7) years and mean score for total functional capacity (TFC) was 8.9 (SD±2.3). 24.3% (n=9) participants were in stage I, 56.8 % (n=21) participants in stage II, and 18.9 % (n=7) participants in stage III on Shoulson & Fahn scale. Furthermore, participants had a mean UHDRS motor score of 36.6 (SD±16.7), a mean UHDRS behavioral score of 9.2 (SD±8.5) and MMSE score of 25.4 (SD±3.5). The mean BMI was 22.8 (SD±3.2). Mean time from the first admission to evaluation stay was 377.3 days (SD±55.9) and the mean time from discharge at 3rdstay to evaluation stay was 95.4 days (SD ±34.2). Information about patients’ medication use according to disease stage at baseline is in the Appendix, table B.
The patient recruitment was based on physicians’ referrals, and only one patient who was referred did not meet the inclusion criteria. Reason for exclusion was patient’s poor ADL function.
Effect of Intervention
Motor function
There was significant improvement in gait (measured by TUG, 10MWT and 6MWT) from baseline through stay two and three to evaluation stay as shown in table 1. The mean change between baseline and evaluation stay in gait assessments were the following: TUG -1.32 seconds, 10MWT –0.27 m/ seconds and 6MWT +68.71 meters. We found that the changes in two gait measures (TUG and 10MWT) exceeded the minimal detectable change values and therefore the changes are clinically meaningful. Our findings support Quinn et al (2013) work22 . The appendix, table C, D and E will provide further information.
There was an overall improvement in balance as shown in table 1. The mean change in BBS from baseline to evaluation stay was +1.0 (p<0.03). However, the ABC scale did not show any change from baseline to evaluation stay.
No change was observed in ADL-function as measured by Barthels Index.
Cognitive function. MMSE showed minor improvement of +0.67 points in overall cognitive function. FAS test (cognitive regulation) showed minor improvement in mean score (+0.89). SDMT (psychomotor speed, cognitive effectiveness) showed a significant decline with mean change of 2.87 points (p<0,05). Stroop color naming, and Stroop word reading, both measures for psychomotor (mental) speed showed a minor decline of -1.35 points, and an insignificant increase of 1.50 points, respectively. The Stoop interference test, an executive function task, measuring cognitive inhibition showed a slight decline of -0.04 points. Overall there was no significant change in mean UHDRS cognitive scores among participants during the study period. The results are shown in table 2.
Anxiety and depression were significantly reduced (3.54 points) from baseline to the evaluation stay (p<0.001) (table 2).
Quality of life. Participants reported significant improvement in the physical component score on the quality of life measurement when comparing baseline to evaluation (table 2). No significant change was found in the mental component score.
Participants gained some weight during the project period, indicated by a change in BMI of 0.72 units (p<0.024) from baseline to evaluation stay.
Finally, we found that a larger proportion had initiated or established a long term coordinated health care plan, Individual Plan, at the evaluation stay compared to the start of the program, from 13/37 to 24/33.
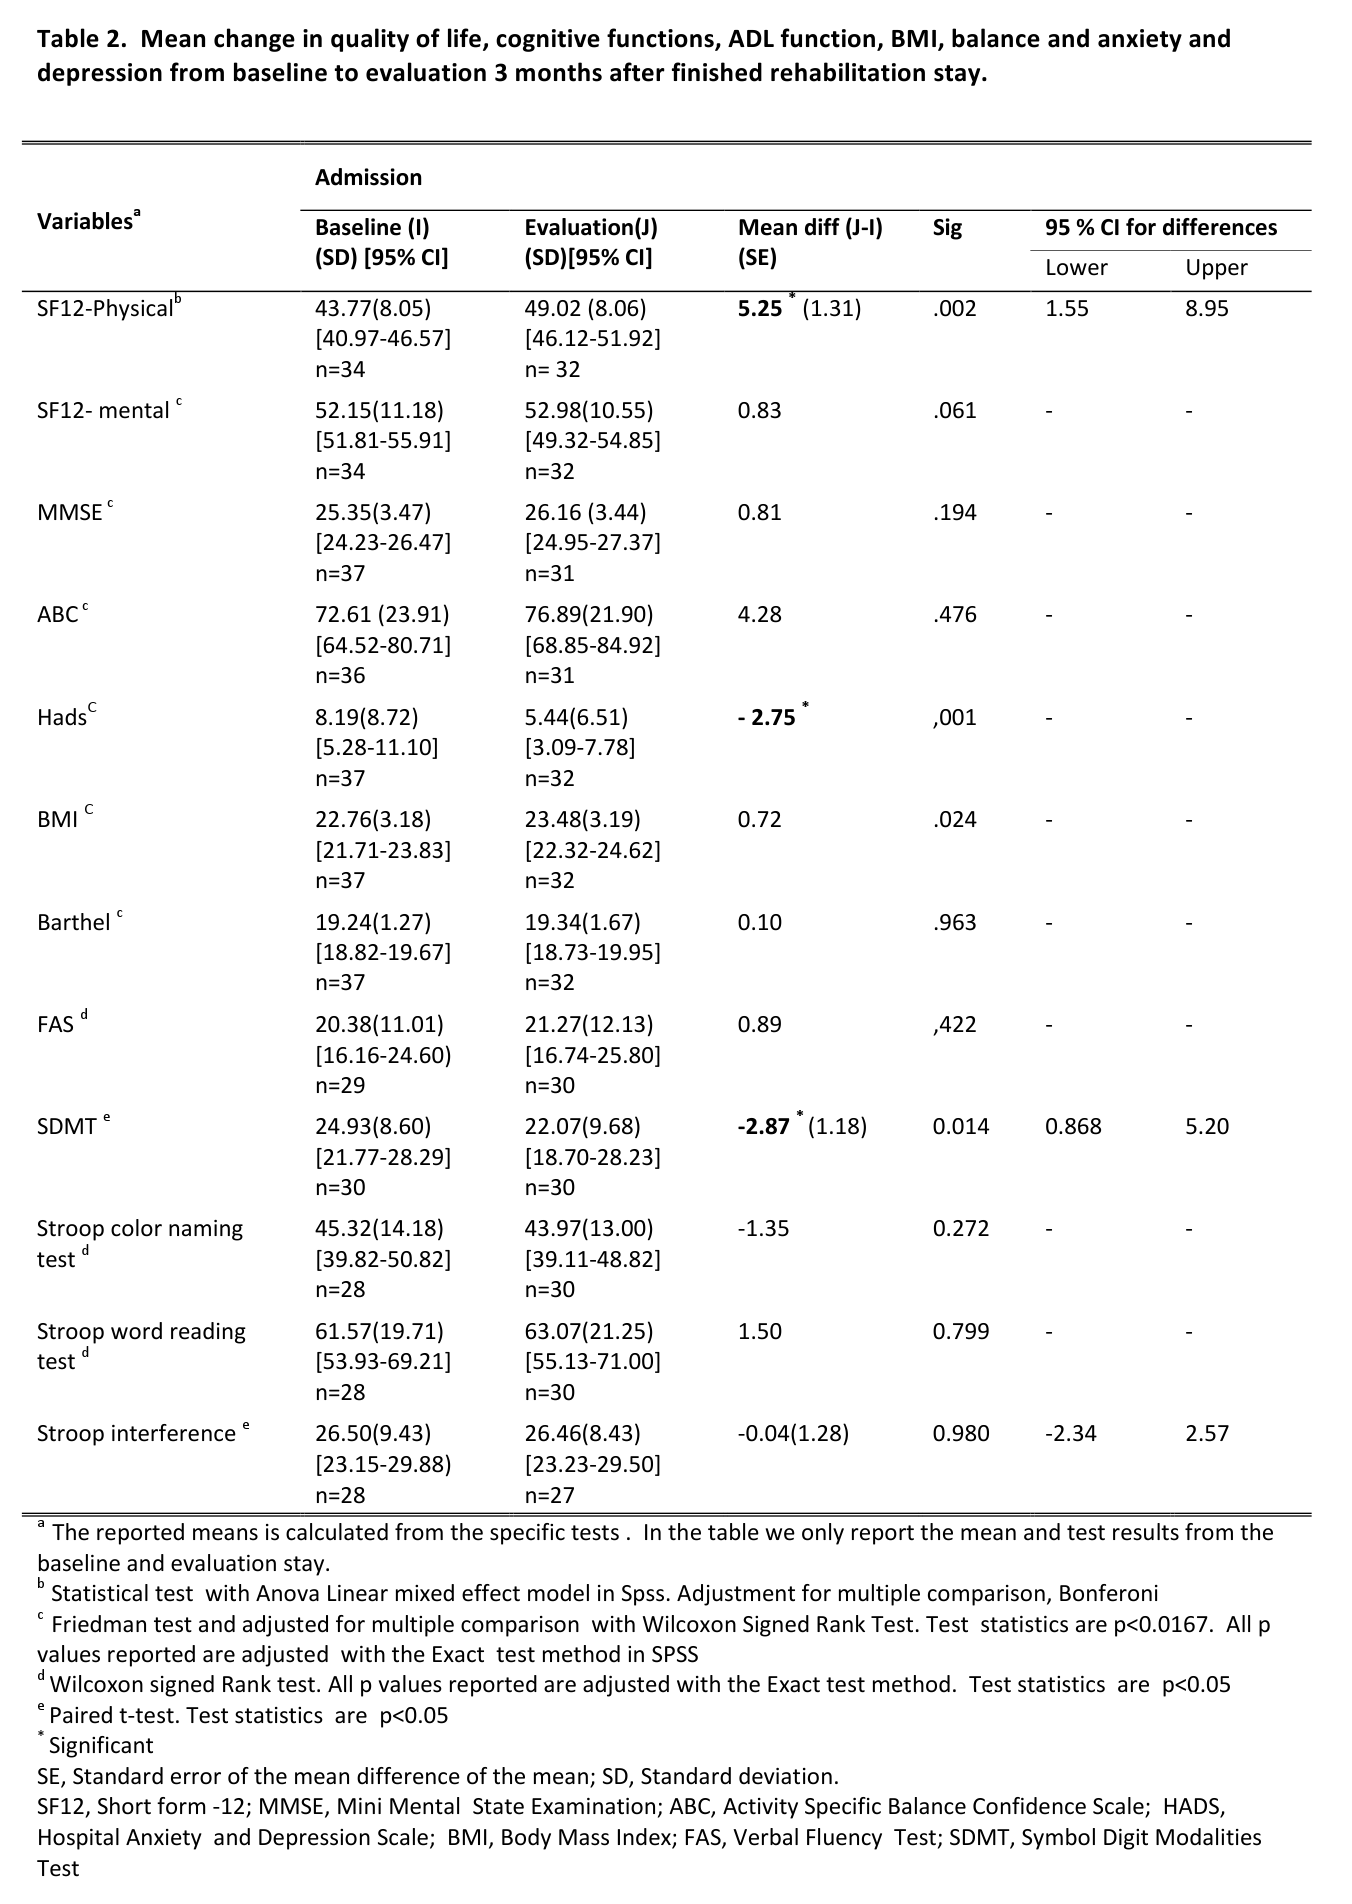
Discussion
The results of the present study show that participation in a structured intensive multidisciplinary rehabilitation program is associated with improved balance, gait function, physical quality of life and with reduced depressive and anxiety symptoms in patients with early to middle stage HD. Additionally, only one cognitive measure (SDMT) showed significant decline, and no decline was observed for the remaining cognitive measures. These results suggest beneficial effects of an intensive rehabilitation approach on symptom development of early to middle stage HD, and are in keeping with the findings reported by Zinzi et al (2007). Furthermore, adding additional outcome measures (quality of life, UHDRS-cognitive battery and gait assessments), has strengthened previous results in showing that physical quality of life is improved and that specific cognitive domains (psychomotor speed, executive function) overall show no significant decline. Our study accomplished considerably better retention with 31 out of 37 patients (83,8%) completing the full one year program, compared to Zinzi et al (2007) where only 25 of 40 patients (62,5%) completing the third rehabilitation period (first year of the study). Our study demonstrates that HD-patients are able to complete a structured rehabilitation program, and possible explanation for the high retention rate in our study could be planned effort to assist and maintain regular contact with the patients in between stays, and that financial expenses with participating in the program were covered by the health care system. Reasons for drop-out were disease progression, difficulties with transport to / from the rehabilitation facility, reduced ability to be tested due to factors such as severe depression as well as reduced test motivation. We found that an increased number of patients reported having, an Individual Plan, indicating that a larger number of patients have received established long term coordinated health care services.
From the start of the project, it was clear that this was part of patient health care quality assessment and improvement. This implied that after each stay, a comprehensive medical report was sent to the referring physician and other relevant allied health care personnel. The report clearly described the patients’ multidisciplinary needs, with a final medical report sent after completing the entire 1-year program. This may have contributed to a better understanding of the needs of the patients by their local health care personnel.
It is important to be aware of some methodological considerations of the project.This study is not a randomized clinical trial, but a descriptive study over a period of one year, as part of the evaluation of the implementation of an intensive multidisciplinary rehabilitation program. However, this is still only the second study looking into the effects of a multidisciplinary approach as treatment for HD. And although our study was only a one-year study as compared to the two-year follow-up reported by Zinzi et al., the present study has a better retention rate (31/37 versus Zinzi’s study 25/40). Furthermore, it is important to note that patients in our study received slight adjustments to medication when necessary during the course of the program. This may have contributed/ strengthened the observed beneficial effects of the project.
Strengths of this program include standardized protocols and systematically executed multidisciplinary approach, which had been carefully planned in terms of use of assessments, measurement points, aiming to have the same rater at both the baseline and final evaluation admission. The raters were trained and standardized and were experienced in their field. All patients had received a clinical diagnosis of HD, based on symptoms and known CAG repeat expansion, but we were unable to record the number of CAG repeats for the patients.
Taken together the present study supports previous results from Zinzi et al (2007) that an intensive multidisciplinary rehabilitation approach can be useful in the management and treatment of symptoms of early and middle stage HD. The study also shows the potential for good retention. Furthermore, in addition to functional outcomes, the present study seems to have contributed to increased establishment of long term and coordinated health care delivery for the participant. In Norway the positive effects of the study have resulted in the establishment of permanent rehabilitation services for HD patients. Whether and how long the observed beneficial effects can be sustained needs to be assessed with longer follow-up. Moreover, there is a need for randomized clinical trials to study the effect of multidisciplinary intensive rehabilitation intervention on progression of HD, and it is important to investigate which participants profit most from such intensive rehabilitation. The use of complex and long self-reported rating scales and long assessment batteries should be considered when planning future multidisciplinary rehabilitation studies and programs for patients with HD.
We do not know surely which component of the multidisciplinary approach is the most effective but it seems that the structured physical training/activities will have the greatest effects on patients with HD in early and middle stage. We hope that results from our study can contribute and inform care development for patients with HD. In the future, it would be interesting to investigate whether this type of intervention will result less need for supportive care in long-term since this was not in a scope our study. It would be interested to know if it is possible to gain similar positive results with a shorter intervention program for instance 2 x 3 weeks intervention versus 3 x 3 weeks intervention during 12 months included cost-benefit analysis. Economical evaluation of the intensive rehabilitation program is very interesting question but this was out of scope in our study. Future research is needed to evaluate of cost-benefit of intensive rehabilitation program among HD population with an appropriate study design.
Clinical message
Conflict of interests
Authors declare no conflict of interests
Ethics statement
Written informed consent was obtained from each patient in separately in both Rehabilitation sites in Tromsø and Vikersund
Introduction
It has long been known that greater CAG repeat lengths are associated with earlier onset of illness, especially for individuals with particularly high repeat number. More recent evidence demonstrates that higher CAG repeat lengths are also associated with faster clinical progression. Rosenblatt et al. [1] demonstrated that CAG repeat number is a small but significant predictor of progression rates of HD in four different measures: overall neurologic signs, motor impairment, cognition, and daily function. Evidence for faster progression of striatal atrophy with higher CAG repeat length is not as clear. Cross-sectional and longitudinal studies have yielded conflicting results, with some suggesting that brain atrophy progresses more rapidly for individuals with higher CAG repeat length and others showing no relationship [2] [3] [4] [5] [6] [7] [8] .
Materials and Methods
The analyses presented here are based on baseline MRI data from participants of PREDICT-HD, a multi-site, longitudinal study of prodromal HD. The sample included 720 participants who tested positive for the HD gene mutation (CAG repeat lengths ranging from 38 to 54), but had not been diagnosed with the motor signs of HD at the time of study enrollment (“prodromal HD”). An additional 206 participants were offspring of a parent with HD but who themselves had tested negative for the HD gene mutation (“controls”). All aspects of the study were approved by the Institutional Review Board at each participating institution, they were in compliance with the code of Ethics of the World Medical Association Declaration of Helsinki, and all participants gave written informed consent.
All MRI scans were obtained using a standard multi-modal protocol that included a 3D volumetric spoiled gradient echo series and a dual echo proton density/T2 series. Scans were processed at The University of Iowa using an automated procedure implemented in BRAINS [9] and artificial neural networks [10] . Caudate, putamen, total striatum (caudate + putamen), and total intracranial volumes were obtained.
Analyses were performed to examine the association between age and striatal volume in each of nine groups defined by CAG repeat length (38-39, 40, 41, 42, 43, 44, 45, 46, 47-54). Each CAG group had at least 34 participants. Table 1 presents demographics and clinical scores for participants in each CAG group. Within each group, a linear regression was performed to examine the association between age and striatal volume (corrected for intracranial volume). The slopes resulting from each of these nine regressions were then correlated with CAG group (using Spearman correlation). This analysis was designed to determine whether the slope of the regressions for age and striatal volume became steeper with increasing CAG repeat length. For each CAG repeat group, a separate linear regression was also performed that included age (centered by group mean to avoid potential multicollinearity issues) and the quadratic term of age as predictors to explore the possibility of a curvilinear relationship between age and striatal volume.
Table 1. Sample description and R 2 of regression between age and striatal volume for each CAG group.
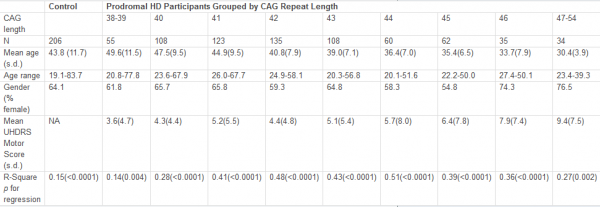
Results
Figure 1 shows the regression for each group depicting the association between age and striatal volume (corrected for intracranial volume). These regressions were all highly significant (R 2 s ranging from 0.14 to 0.51, all p values < 0.005) but variable, with lower R 2 s generally observed for the lowest CAG repeat lengths. The slope for each group (representing association between striatal volume and age) was highly associated with CAG group (Spearman r = −0.98, p < 0.0001; see Figure 2), with higher CAG repeat numbers associated with steeper slope, at least up through CAG = 44.
The quadratic effect of age in the linear regression model was statistically significant for CAG = 46 group ( t = 2.85, p = 0.008), although this was due to a single outlier. When this outlier was removed, the addition of the age 2 factor did not result in an increased significance in the model that was based on age alone ( t = 0.21, p = 0.83 for age 2 , after accounting for age). Although not quite reaching significance ( t = −1.85, p = 0.07), the curve for the CAG = 38-39 group suggested a slightly steeper decline for older subjects than younger subjects. A significant effect of age 2 was not observed in any other groups ( p values all > 0.20).
The solid portion of each line represents actual data (based on age range of participants in each CAG group). Heavy dashed line represents correlation for control participants.
Fig. 1: Regressions for age and striatal volume (corrected for ICV) for each CAG group.

Fig. 2: Correlation showing the relationship between the slopes of the regression lines from Figure 1 and the CAG repeat lengths of each group (Spearman correlation = 0.98, p < 0.0001)
Discussion
Although based on cross-sectional data, our analyses suggest that increased CAG repeat length is associated with faster progression of striatal atrophy in prodromal HD, at least up through CAG = 44. Although it is clearly established that CAG repeat length has an effect on age at onset of HD [1] [11] ,few studies have examined the effect of CAG repeat length on rate of brain atrophy, and these have all been done on relatively small samples and most have examined brain regions other than the striatum. In a longitudinal study of 37 affected patients, Ruocco et al. [7] found that higher repeat length (> 45) was associated with faster rate of atrophy in frontal, occipital, parietal, and cerebellar regions. In a small sample ( n = 13) including both affected and prodromal individuals, Henley et al. [5] found no significant association between rate of whole brain atrophy and CAG repeat length. In a larger sample ( n = 62), the same group found that an increase of CAG repeat length by one was associated with an increase in whole-brain atrophy rate of 0.12% per year [6] . In small samples that included both prodromal and affected subjects, Squitieri et al. [8] found a significant correlation between CAG repeat length and increased CSF volume change, and Aylward et al. [2] found that repeat length correlated significantly with rate of change in caudate, globus pallidus, and total basal ganglia, but not putamen. One cross-sectional MRI study with a small sample also demonstrated a significant correlation between CAG repeat length and striatal volume loss (difference between HD subject’s volume and control volume [4] ), while a neuropathological study of established HD found a correlation between CAG and cortical, but not subcortical atrophy [3] .
Our results are consistent with analyses of longitudinal data from a subsample of the current cross-sectional sample ( n = 211 [12] ) that revealed a significant association between CAG repeat length and rate of change for caudate ( t = −2.64, p = 0.009) and total striatum ( t = −2.32, p = 0.02), with a trend toward a significant association for putamen ( t = −1.80, p = 0.07). No significant associations were observed for any other regions (cortical gray matter, white matter, CSF, thalamus). Taken together with results from the current study, these findings yield evidence suggesting that rate of striatal atrophy is faster in individuals with higher CAG repeat lengths. Our results are not surprising, given previous research in affected patients with HD demonstrating that (a) faster rate of clinical progression is associated with higher CAG repeat number [1] and (b) smaller striatal volumes are associated with more severe clinical manifestations [13] .
A major strength of the current study is its large sample size. Although the findings presented here are based on cross-sectional baseline data, it is expected that longitudinal results would be similar, as the regression between age and striatal volume for a given CAG repeat length can be assumed to be a good estimate of the trajectory of atrophy for the average participant within that CAG group. Lack of very young participants (< 18 years) may skew the data somewhat, especially for the longer CAG groups, where the y -intercept is below that of the other CAG groups (see Figure 1). There is also a lack of cases with very high CAG repeat lengths, as these individuals usually have childhood onset and would not, therefore, qualify for a study of adult prodromal HD. If it were possible to include prodromal individuals younger than 18 years, striatal volumes for those with large CAG repeat lengths might be higher than those in the current study, resulting in even steeper slopes for these groups. Thus, our finding of similar association between age and striatal volume in the groups with CAG > 44 may not be valid across the entire age range.
It is also noteworthy that the slope for the group with CAG = 38-39 is basically the same as for the control group, although absolute values for striatal volumes are lower. The age range for the two groups is similar and the results were not biased by any obvious outliers. The trend for a curvilinear relationship between age and striatal volume ( p = 0.07) suggests that striatal atrophy remains fairly normal for prodromal individuals with relatively low CAG repeat lengths until they are older adults, at which time atrophy increases. This would be consistent with the fact that these individuals are usually not diagnosed until fairly late in life.
Evidence that individuals with longer CAG repeat lengths show faster striatal atrophy may be important in the design of future clinical trials in prodromal HD. By selecting participants with relatively longer CAG repeat lengths and faster rate of atrophy, clinical trials might be able to be conducted with smaller sample sizes or shorter duration than selecting those with relatively shorter CAG repeat lengths and slower rate of atrophy.
Acknowledgments
We thank the PREDICT-HD sites, the study participants, and the National Research Roster for Huntington Disease Patients and Families. The complete list of those involved in the PREDICT-HD study is below.
Funding Information
This research is supported by the National Institutes for Health, National Institute of Neurological Disorders and Stroke (NS40068) and CHDI Foundation, Inc.
Competing Interests
The authors have declared that no competing interests exist.
PREDICT-HD Investigators, Coordinators, Motor Raters, Cognitive Raters (as of January 5, 2010)
Peg Nopoulos, MD, Robert Rodnitzky, MD, Ergun Uc, MD, BA, Leigh J. Beglinger, PhD, Vincent A. Magnotta, PhD, Stephen Cross, BA, Nicholas Doucette, BA, Andrew Juhl, BS, Jessica Schumacher, BA, Mycah Kimble, BA, Pat Ryan, MS, MA, Jessica Wood, MD, PhD, Eric A. Epping, MD, PhD, Thomas Wassink, MD, and Teri Thomsen, MD (University of Iowa Hospitals and Clinics, Iowa City, Iowa, USA); David Ames, MD, Edmond Chiu, MD, Phyllis Chua, MD, Olga Yastrubetskaya, PhD, Joy Preston, Anita Goh, D.Psych, and Angela Komiti, BS, MA (The University of Melbourne, Kew, Victoria, Australia); Lynn Raymond, MD, PhD, Rachelle Dar Santos, BSc, Joji Decolongon, MSC, and David Weir, BSc (University of British Columbia, Vancouver, British Columbia, Canada); Adam Rosenblatt, MD, Christopher A. Ross, MD, PhD, Barnett Shpritz, BS, MA, OD, and Claire Welsh (Johns Hopkins University, Baltimore, Maryland, USA); William M. Mallonee, MD and Greg Suter, BA (Hereditary Neurological Disease Centre, Wichita, Kansas, USA); Ali Samii, MD, Hillary Lipe, ARNP, and Kurt Weaver, PhD (University of Washington and VA Puget Sound Health Care System, Seattle, Washington, USA); Randi Jones, PhD, Cathy Wood-Siverio, MS, Stewart A. Factor, DO, and Claudia Testa, MD, PhD (Emory University School of Medicine, Atlanta, Georgia, USA); Roger A. Barker, BA, MBBS, MRCP, Sarah Mason, BSC, Anna Goodman, PhD, and Anna DiPietro (Cambridge Centre for Brain Repair, Cambridge, UK); Elizabeth McCusker, MD, Jane Griffith, RN, and Kylie Richardson, PhD (Westmead Hospital, Sydney, Australia); Bernhard G. Landwehrmeyer, MD, Daniel Ecker, MD, Patrick Weydt, MD, Michael Orth MD, PhD, Sigurd Süβmuth, MD, RN, Katrin Barth, RN, and Sonja Trautmann, RN (University of Ulm, Ulm, Germany); Kimberly Quaid, PhD, Melissa Wesson, MS, and Joanne Wojcieszek, MD (Indiana University School of Medicine, Indianapolis, IN); Mark Guttman, MD, Alanna Sheinberg, BA, Adam Singer, and Janice Stober, BA, BSW (Centre for Addiction and Mental Health, University of Toronto, Markham, Ontario, Canada); Susan Perlman, MD and Arik Johnson, PsyD (University of California, Los Angeles Medical Center, Los Angeles, California, USA); Michael D. Geschwind, MD, PhD and Jon Gooblar, BA (University of California San Francisco, California, USA); Tom Warner, MD, PhD, Stefan Klöppel, MD, Maggie Burrows, RN, BA, Marianne Novak, MD, Thomasin Andrews, MD, BSC, MRCP, Elisabeth Rosser, MBBS, FRCP, and Sarah Tabrizi, BSC, PhD (National Hospital for Neurology and Neurosurgery, London, UK); Anne Rosser, MD, PhD, MRCP and Kathy Price, RN (Cardiff University, Cardiff, Wales, UK); Amy Chesire, LCSW-R, MSG, Frederick Marshall, MD, and Mary Wodarski, BA (University of Rochester, Rochester, New York, USA); Oksana Suchowersky, MD, FRCPC, Sarah Furtado, MD, PhD, FRCPC, and Mary Lou Klimek, RN, BN, MA (University of Calgary, Calgary, Alberta, Canada); Peter Panegyres, MB, BS, PhD, Carmela Connor, BP, MP, DP, and Elizabeth Vuletich, BSC (Neurosciences Unit, Graylands, Selby-Lemnos & Special Care Health Services, Perth, Australia); Joel Perlmutter, MD and Stacey Barton, MSW, LCSW (Washington University, St. Louis, Missouri, USA); Sheila A. Simpson, MD, Daniela Rae, RN, and Zosia Miedzybrodzka, PhD (Clinical Genetics Centre, Aberdeen, Scotland, UK); David Craufurd, MD, Ruth Fullam, BSC, and Elizabeth Howard, MD (University of Manchester, Manchester, UK) Pietro Mazzoni, MD, PhD, Karen Marder, MD, MPH, Carol Moskowitz, MS, and Paula Wasserman, MA (Columbia University Medical Center, New York, New York, USA); Diane Erickson, RN, Dawn Miracle, BS, MS, and Rajeev Kumar, MD (Colorado Neurological Institute, Englewood, Colorado, USA); Vicki Wheelock, MD, Terry Tempkin, RNC, MSN, Nicole Mans, BA, MS, and Kathleen Baynes, PhD (University of California Davis, Sacramento, California, USA); Joseph Jankovic, MD, Christine Hunter, RN, CCRC, and William Ondo, MD (Baylor College of Medicine, Houston, Texas, USA); Justo Garcia de Yebenes, MD, Monica Bascunana Garde, Marta Fatas, BA, and Jose Luis Lópenz Sendon, MD (Hospital Ramón y Cajal, Madrid, Spain); Martha Nance, MD, Dawn Radtke, RN, and David Tupper, PhD (Hennepin County Medical Center, Minneapolis, Minnesota, USA); Wayne Martin, MD, Pamela King, BScN, RN, and Satwinder Sran, BSC (University of Alberta, Edmonton, Alberta, Canada); Anwar Ahmed, PhD, Stephen Rao, PhD, Christine Reece, BS, Janice Zimbelman, PhD, PT, Alexandra Bea, BA, and Emily Newman, BA (Cleveland Clinic Foundation, Cleveland, Ohio, USA);
Steering Committee Jane Paulsen, PhD, Principal Investigator, Eric A. Epping, MD, PhD, Douglas Langbehn, MD, PhD, Hans Johnson, PhD, Megan Smith, PhD, Janet Williams, PhD, RN, FAAN (University of Iowa Hospitals and Clinics, Iowa City, IA); Elizabeth Aylward, PhD (Seattle Children’s Research Institute, WA); Kevin Biglan, MD (University of Rochester, Rochester, NY); Blair Leavitt, MD (University of British Columbia, Vancouver, BC, Canada); Marcy MacDonald, PhD (Massachusetts General Hospital); Martha Nance, MD (Hennepin County Medical Center, Minneapolis, MN); Jean Paul Vonsattel, PhD (Columbia University Medical Center, New York, NY).
Scientific Sections Bio Markers: Blair Leavitt, MDCM, FRCPC (Chair) and Michael Hayden, PhD (University of British Columbia); Stefano DiDonato, MD (Neurological Insitute “C. Besta,” Italy); Ken Evans, PhD (Ontario Cancer Biomarker Network); Wayne Matson, PhD (VA Medical Center, Bedford, MA); Asa Peterson, MD, PhD (Lund University, Sweden), Sarah Tabrizi, PhD (National Hospital for Neurology and Neurology and Neurosurgery, London).
Cognitive: Deborah Harrington, PhD (Chair, University of California, San Diego), Tamara Hershey, PhD (Washington University Cognitive Science Battery Development); Holly Westervelt, PhD (Chair, Quality Control and Training, Alpert Medical School of Brown University), Jennifer Davis, PhD, Pete Snyder, PhD, and Geoff Tremont, PhD, MS (Scientific Consultants, Alpert Medical School of Brown University); Megan Smith, PhD (Chair, Administration), David J. Moser, PhD, Leigh J. Beglinger, PhD (University of Iowa); Lucette Cysique, PhD (St. Vincent’s/University of Melbourne, Australia); Carissa Gehl, PhD (VA Medical Center, Iowa City, IA); Robert K. Heaton, PhD, David Moore, PhD, Joanne Hamilton, PhD, and David Salmon, PhD (University of California, San Diego); Kirsty Matheson (University of Aberdeen); Paula Shear, PhD (University of Cincinnati); Karen Siedlecki, PhD (Fordham University); Glenn Smith, PhD (Mayo Clinic); and Marleen Van Walsem (EHDN).
Functional Assessment: Janet Williams, PhD (Co-Chair), Leigh J. Beglinger, PhD, Anne Leserman, MSW, LISW, Justin O’Rourke, MA, Bradley Brossman, MA, Eunyoe Ro, MA (University of Iowa); Rebecca Ready, PhD (University of Massachusetts); Anthony Vaccarino, PhD (Ontario Cancer Biomarker Network); Sarah Farias, PhD (University of California, Davis); Noelle Carlozzi, PhD (Kessler Medical Rehabilitation Research & Education Center); and Carissa Gehl, PhD (VA Medical Center, Iowa City, IA).
Genetics: Marcy MacDonald, PhD (Co-Chair), Jim Gusella, PhD, and Rick Myers, PhD (Massachusetts General Hospital); Michael Hayden, PhD (University of British Columbia); Tom Wassink, MD (Co-Chair) and Eric A. Epping, MD, PhD (University of Iowa).
Imaging:Administrative: Ron Pierson, PhD (Chair), Kathy Jones, BS, Jacquie Marietta, BS, William McDowell, AA, Steve Dunn, BA, Greg Harris, BS, Eun Young Kim, MS, and Yong Qiang Zhao, PhD (University of Iowa); John Ashburner, PhD (Functional Imaging Lab, London); Vince Calhoun, PhD (University of New Mexico); Steve Potkin, MD (University of California, Irvine); Klaas Stephan, MD, PhD (University College of London); and Arthur Toga, PhD (University of California, Los Angeles). Striatal: Elizabeth Aylward, PhD (Chair, Seattle Children’s Research Institute) and Kurt Weaver, PhD (University of Washington and VA Puget Sound Health Care System, Seattle, Washington). Surface Analysis: Peg Nopoulos, MD (Chair), Eric Axelson, BSE, and Jeremy Bockholt, BS (University of Iowa). Shape Analysis: Christopher A. Ross (Chair), MD, PhD, Michael Miller, PhD, and Sarah Reading, MD (Johns Hopkins University); Mirza Faisal Beg, PhD (Simon Fraser University). DTI: Vincent A. Magnotta, PhD (Chair, University of Iowa); Karl Helmer, PhD (Massachusetts General Hospital); Kelvin Lim, MD (University of Ulm, Germany); Mark Lowe, PhD (Cleveland Clinic); Sasumu Mori, PhD (Johns Hopkins University); Allen Song, PhD (Duke University); and Jessica Turner, PhD (University of California, Irvine). fMRI: Steve Rao, PhD (Chair), Erik Beall, PhD, Katherine Koenig, PhD, Mark Lowe, PhD, Michael Phillips, MD, Christine Reece, BS, and Jan Zimbelman, PhD, PT (Cleveland Clinic).
Motor: Kevin Biglan, MD (University of Rochester), Karen Marder, MD (Columbia University), and Jody Corey-Bloom, MD, PhD (University of California, San Diego) all Co-Chairs; Michael Geschwind, MD, PhD (University of California, San Francisco); and Ralf Reilmann, MD (Muenster, Germany).
Psychiatric: Eric A. Epping, MD, PhD (Chair), Nancy Downing, RN, MSN, Jess Fiedorowicz, MD, Robert Robinson, MD, and Megan Smith, PhD (University of Iowa); Karen Anderson, MD (University of Maryland); David Craufurd, MD (University of Manchester); Mark Groves, MD (Columbia University); Anthony Vaccarino, PhD and Ken Evans, PhD (Ontario Cancer Biomarker Network); Hugh Rickards, MD (Queen Elizabeth Psychiatric Hospital); and Eric van Duijn, MD (Leiden University Medical Center, Netherlands).
Core Sections Statistics: Douglas Langbehn, MD, PhD (Chair) and James Mills, MEd, MS (University of Iowa); and David Oakes, PhD (University of Rochester).
Recruitment/Retention: Martha Nance, MD (Chair, University of Minnesota); Anne Leserman, MSW, LISW, Stacie Vik, BA, Christine Anderson, BA, Nick Doucette, BA, Kelly Herwig, BA, MS, Mycah Kimble, BA, Pat Ryan, MSW, LISW, MA, Jessica Schumacher, BA, Kelli Thumma, BA, and Elijah Waterman, BA (University of Iowa); and Norm Reynolds, MD (University of Wisconsin, Milwaukee).
Ethics: Cheryl Erwin, JD, PhD, (Chair, McGovern Center for Health, Humanities and the Human Spirit); Eric A. Epping, MD, PhD and Janet Williams, PhD (University of Iowa); and Martha Nance, MD (University of Minnesota).
IT/Management: Hans Johnson, PhD (Chair), R.J. Connell, BS, Paul Allen, AASC, Sudharshan Reddy Bommu, MS, Karen Pease, BS, Ben Rogers, BA, BSCS, Jim Smith, AS, Kent Williams, BSA, MCS, MS, Shuhua Wu, MCS, and Roland Zschiegner (University of Iowa).
Program Management
Administrative: Chris Werling-Witkoske (Chair), Karla Anderson, BS, Kristine Bjork, BA, Ann Dudler, Jamy Schumacher, Sean Thompson, BA (University of Iowa).
Financial: Steve Blanchard, MSHA (Co-Chair), Machelle Henneberry, and Kelsey Montross, BA (University of Iowa).
Introduction:
Huntington’s disease (HD) is an inherited, neurodegenerative disease resulting in clinical symptoms of progressive movement disorder, cognitive defects and behavioural changes that ultimately affects a person’s ability to participate independently in activities of daily living, work and community. With an approximately 20 year time course from symptom onset, death usually results from complications of falls, dysphagia, or aspiration [1] . Over the course of the disease, the person with HD will require a range of generic and specialist professional services [2] [3] and flexible, co-ordinated practical and psychological support [4] depending on the stage of condition and that person’s functional status. In the earlier stages of the disease, healthcare focuses on maintaining and/or preventing decline in mental and physical functioning. Later on in the disease, care is usually more supportive in nature. Although cognition and behavioural problems have a greater incidence in people requiring full time care, advanced motor impairment has been found to be the greatest predictor of nursing home placement in HD patients [5] .
Successful care will usually involve the efforts of a multi-disciplinary team working closely with the family to optimize quality of life over the life span of the disease [6] [7] [8] . Here, care of the person with HD should be person-centred with the person with HD and their immediate family linked to the multi-disciplinary team for appropriate medical, health and social care so as to maximize function and prepare for future challenges [3] . Health professionals involved in the care of the person with HD may include the General practitioner, Psychiatrist, Neurologist, Geneticist, Psychologist, Social Worker, Speech Therapist, Occupational Therapist, Physiotherapist and Community and/or specialist nurse [6] . Social services and home help or nursing may also be crucial. The diverse nature of symptoms seen in different individuals with HD, over time and involving various services make care planning and service development complex [6] . There have been suggestions that due to these complexities, in many cases, care needs are unmet [6] [9] both in the earlier [10] and more palliative stages of the disease [8] . The complexity in provision of care requirements also often results in the family members i.e. informal carers undertaking the overall responsibility for care [11] .
Informal care is that which is delivered by non-expert carers who are usually family or friends, may range from full time care from person who lives with the HD patient to intermittent input from someone living elsewhere. Informal care will vary according to the needs of the person with HD and may range from looking after all personal needs to help with shopping and care of home on less frequent basis. Informal carers are often required to provide both psychological and practical support over extended periods of time [4] and the impact on their quality of life as a result of supporting the person with HD at home should certainly not be underestimated [12] [13] . Informal care is also not subject to audit or regulation and may not always be optimal for the person with HD and for the person providing that care.
To be able to ensure that care needs are met, appropriate and informed service planning is required. The first step in this process is to quantify actual use of formal healthcare resources and the balance between formal care services and informal care use.
Knowledge of such data has the potential to facilitate appropriate planning and resource allocation in line with standards of excellence for chronic conditions management. In the United Kingdom, a National Service Framework for people with Long Term Neurological Conditions (LTNCs) sets out quality requirements for care. These include prioritisation for personal care and support with appropriate support for family and carers and access to appropriate aids and home adaptations to promote living at home to facilitate living at home for as long as is able with as high a quality of life as possible [14] . In order to evaluate whether such quality standards are being met, current service use needs to be described. There is an on-going programme of study evaluating service use in rare LTNCs (RESULT study) (https://www.ltnc.org.uk/research_files/RESULT_study.html) for this specific purpose but to date no data is available in published literature of specific service receipt in HD patients.
The Client Service Receipt Inventory (CSRI) questionnaire was developed [15] [16] specifically to provide information on service utilisation and ultimately inform service delivery by collecting retrospective information on service related issues. It is an established tool and has been used in a range of research studies including mental health outreach services, community nursing services and community care of older people and people with challenging behaviour [16] [17] . The questionnaire schedule is designed for interviewer/researcher administration with the person receiving the services assisted by their main carer as required. The retrospective period is fixed according to the population being investigated and according to the specific aims of the research. It therefore varies by the research design in question and allows capture of information on rarer services that may be received in a set time period whilst not being subject to the problems of recall bias. The service receipt section is the core of the CSRI [16] ; for each service type, the number and average duration of contacts is recorded and used to summarise particular care packages, illustrate the variety of services used and in particular determine how resources are allocated. HD patients at different stages of the disease will have particular health care needs requiring specific combinations of health services and this will have associated service planning implications. Clear assessment of disease impact and severity alongside healthcare resource use is a key requirement for resource planning and predicting future care needs.
Disease severity is routinely quantified using the Unified Huntington’s Disease Rating Scales (UHDRS) [18] [19] , a disease specific rating system that is used to assess the severity of disease. With the UHDRS, specific domains of clinical performance namely motor ability, cognition and behaviour are assessed. The motor rating involves 31 questions representing oculomotor, speech, motor, and gait findings rated on a 0- to 4-point scale (4 most impaired). The cognitive assessments incorporate verbal fluency, ability to pair numbers with figures and selective attention whilst the behavioural assessment considers severity and frequency of mood, anxiety, aggression, psychosis, and other behavioural abnormalities. The UHDRS functional components comprise three ordinal components, namely the functional assessment scale (FAS) (an activities of daily living checklist with range 0 to 25), the Independence scale (IS) (range 10-100), and the Total Functional Capacity (TFC) (range 0 to 13). Scores on the TFC can further represent five stages in the neurodegenerative disease process: stage I represents scores from 13-11; stage II, scores of 10-7; stage III, scores of 6-3; stage IV, scores of 2-1; and stage V, a score of 0. The independence scale has a range of 10 to 100 units and evaluates dependence on care from total care required to no special care needed.
The aim of this study was to investigate the use of formal and informal care services as recorded using retrospective CSRI data and to investigate any associations between use of care, disease severity and functional ability as measured by the UHDRS motor and functional scales.
In these analyses, we specifically sought to identify, a) what care (both formal services and informal care) HD patients currently use and b) whether there were any specific factors associated with the estimated amount of informal care required. To our knowledge such data has not previously been presented for a cohort of HD patients; we suggest that availability of such data in a cohort of HD patients from a cross-section of European countries is of use in quantifying and ultimately improving planning of service provision for HD patients.
Methods and materials:
REGISTRY is a multi-centre, multi-national observational study with no experimental intervention. REGISTRY is managed by the European Huntington’s Disease Network (EHDN) and aims to build up an electronic database of patients with HD and their relatives. The main component of the ‘ REGISTRY ‘ study is the storage of anonymous medical data on an electronic database. One of the aims of REGISTRY is to obtain natural history data on an annual basis over an extended time period on a wide spectrum of individuals affected by HD to facilitate data mining studies.
For the purposes of the analyses presented here, the monitored data of demography, CAG repeat, estimated age of onset, disease severity and functional ability as measured by the Unified Huntington’s Disease Rating Scale total motor score (UHDRS-TMS) and functional scales in combination with the CSRI has been utilised for data mining. Data was collected according to the standard REGISTRY protocol [20]. The EHDN REGISTRY CSRI refers to the immediate six month retrospective period. It records details on use of hospital and residential services; primary and community care services; investigations and diagnostic tests; aids or devices; adaptations to the home; informal care; average loss of income per week; journeys undertaken and occupation.
Data were analysed descriptively for demographics and according to percentage use of individual services and aggregates of service receipt namely 1) total number of individual formal services received 2) aggregates of hospital services (inpatient and outpatient) and primary and community care and 3) the carer or patient estimated total informal care hours (personal, help inside the home, help outside the home and other) as recorded by the CSRI. As the focus on our investigations was to establish service use frequencies in the first instance and not costs per se, we do not report on investigations and diagnostic tests, average loss of income per week; journeys undertaken and occupation in these analyses.
In order to identify specific factors associated with receipt of services at each visit, we utilised linear regression with estimated hours of informal care as the dependant variable and the measures of disease severity and functional ability as the independent variables. All analyses were conducted using PASW version 18 Release 18.0.2 April 2010.
Results
Demographic and Descriptive data:
CSRI data for 451 HD patients (212 female; 239 male) was available for visit one (at enrolment to the study) of this observational study. Completed CSRI data for 105 (54 females; 51 males) and 47 (20 females; 27 males) HD patients was available for visits two and three respectively. The mean time between visits was 1.2 years. Countries represented were Austria (8.6%); Germany (33.7%); Italy (15.3%); Norway (3.3%); Poland (18.4%); Portugal (2.9%); Spain (10.6%); Switzerland (0.9%) and United Kingdom (6.2%).
Mean (SD) estimated age of onset was 41.8 (12.8) years and age at visit 1 was 49.5 (13.1). Median (range) CAG repeat length was 45 (35-89). Median (range) scores at visit 1 on UHDRS-TMS, Functional assessment scale (FAS), Total Functional Capacity (TFC) and Independence Scale were 34 (0-106); 20 (0-25); 8 (0-13) and 80 (10-100) respectively. At Visit 2, median (range) scores on UHDRS-TMS, Functional assessment scale (FAS), Total Functional Capacity (TFC) and Independence Scale were 37 (0-111); 16 (0-25); 7 (0-13) and 75 (10-100) respectively.At Visit 3, median (range) scores on UHDRS-TMS, Functional assessment scale (FAS), Total Functional Capacity (TFC) and Independence Scale were 43 (0-97); 13 (0-25); 5 (0-13) and 70 (25-100) respectively. It is important to note the altered proportional representation of people with HD at each stage of the disease for each visit. At visit 1, most participants (n=153; 34%) were at Stage 1 of the disease; by visit 3 most participants (n=58; 61%) were at either stage 3 or 4 of the disease. Table 1 gives details of percentage of the sample at each stage of the disease for each visit.
Table 1: Frequencies and valid percentages of HD patients at each visit stratified according to stage of disease (represented by TFC scores)
| TFC stage of disease | Number (%) of total sample at visit 1 at each stage of the disease | Number (%) of total sample at visit 2 at each stage of the disease | Number (%) of total sample at visit 3 at each stage of the disease |
| 1 (TFC 11-13) | 153 (34%) | 59 (27%) | 18 (19%) |
| 2 (TFC 7-10) | 125 (28%) | 57 (25%) | 18 (19%) |
| 3 (TFC (3-6) | 119 (26%) | 74 (33%) | 36 (38%) |
| 4 (TFC 1-2) | 47 (10%) | 31 (14%) | 22 (23%) |
| 5 (TFC 0) | 7 (2%) | 3 (1%) | 1 (1%) |
Receipt of services:
At visit 1, 335 of the 451 participants were in receipt of at least one formal hospital based service and 401 (89%) were in receipt of primary and community care services. In contrast, 94% of people used community based services at visit 3 and 62% used hospital based services. Fifty percent of individuals reported use of informal care in the home at visit 1; this increased to 68% at visits 2 and 3 (see Table 2).The increase in service use frequencies and care hours reported in visits 2 and 3 do however need to be considered in light of the greater proportion of people in stages 3 and 4 of the disease at visit 3 compared to those at visit 1 (see Table 1).
Inpatient hospital service use increased dramatically over visits and outpatient service use decreased. Percentage of people in receipt of physiotherapy and speech and language therapy services increased at each visit; whilst social worker involvement remained relatively constant. Home help use increased over time. Notable is that occupational therapy, dentistry and other allied health professional services was not independently recorded in the version of CSRI used here and may well be under-reported in this situation. There was additionally no mention of key-worker involvement.
Table 2: Frequencies and valid percentages of HD patients receiving care services at each visit
| Service receipt for HD patients | Number (%) of total sample receiving services at visit 1 (n=451) | Number (%) of total sample receiving services at visit 2 (n=105) | Number (valid %) of total sample receiving services at visit 3 (n=47) |
|
Hospital services Inpatient Outpatient |
335 (75%) 110 (24%) 300 (69%) |
73 (70%) 58 (64%) 17 (16%) |
29 (62%) 28 (60%) 5 (11%) |
|
Primary and Community care GP Neurologist Other doctor Physiotherapist Social Worker Nurse Speech Therapist Home-help Other (Occupational therapy, Dentistry; Chiropractor) |
401 (89%) 333 (74%) 170 (38%) 73 (16%) 91 (20%) 45 (10%) 30 (7%) 58 (13%) 51 (11%) 42 (9%) |
89 (85%) 68 (65%) 35 (33%) 14 (14%) 31 (30%) 14 (13%) 15 (14%) 18 (17%) 15 (14%) 15 (14%) |
44 (94%) 36 (77%) 25 (53%) 6 (13%) 21 (45%) 4 (9%) 4 (9%) 13 (28%) 9 (19%) 7 (15%) |
|
Informal Care Personal care Help inside the home Help outside the home Other |
224 (50%) 130 (29%) 195 (43%) 170 (38%) 36 (8%) |
71 (68%) 14 (39%) 63 (60%) 54 (51%) 14 (13%) |
32 (68%) 22 (47%) 29 (62%) 25 (53%) 7 (15%) |
Use of aids and adaptations:
The use of wheelchairs increased over each visit, but all other appliance use remained fairly constant (see Table 3). Crutches and frames were used fairly infrequently whilst home adaptation (bathroom, shower and toilet) was a slightly more frequent occurrence.
Table 3: Frequencies and valid percentages of HD patients using aids and adaptations in the home at each visit
| Aids and Adaptations in the home | Number (%) of total sample at visit 1 (n=451) | Number (%) of total sample at visit 2 (n=105) | Number (valid %) of total sample at visit 3 (n=47) |
| Aids or devices | |||
| Wheelchairs | 27 (6%) | 17 (16%) | 17 (15%) |
| Crutches | 10 (2%) | 1 (1%) | 2 (4%) |
| Walking frames/ Rollators | 17 (4%) | 7 (7%) | 1 (2%) |
| Other | 17 (4%) | 5 (4%) | 5 (11%) |
| Adaptations to the home | |||
| Stair lift | 11 (2%) | 4 (4%) | 1 (4%) |
| Shower/bath relocation | 26 (6%) | 13 (12%) | 11 (23%) |
| Toilet relocation | 17 (4%) | 7 (7%) | 4 (9%) |
| Redesign kitchen | 7 (2%) | 3 (3%) | 1 (2%) |
| Medicalised Bed | 8 (2%) | 5 (5%) | 1 (2%) |
| Concrete ramp | 3 (1%) | 3 (3%) | 0 (0%) |
| Other (Move home) | 31 (7%) | 14 (13%) | 2 (4%) |
Aggregates of Service Use:
The mean (SD) estimated weekly total informal care hours at visits 1, 2 and 3 were 32.8 (49.4); 21.6 (53.6) and 21.3 (62.4) respectively (see Table 3). Although the mean reported informal care hours were less at each visit; the mean number of informal care services used appeared to increase between visits 1 and 3. Mean number of formal primary and community services used (and percentages of individual services) also appeared to increase over time whilst formal hospital based services reduced over time. This is consistent with what was seen in terms of percentages of HD patients using different services (see Table 2).
Table 4: Aggregates of service use for each visit
| Mean (SD); range of total individual formal service receipt | Mean (SD); range of number of hospital based services used | Mean (SD); range of number of primary and community care services used | Mean (SD); range of number of informal care services used | Mean (SD) informal care hours | |
| Visit 1 (n=451) | 3.1 (1.8); 0-9 | 1.1 (0.9); 0-5 | 2.0 (1.4); 0-7 | 1.2 (1.4); 0-4 | 32.7 (49.4) |
| Visit 2 (n=105) | 3.2 (2.2); 0-10 | 1.1 (1.0); 0-4 | 2.1 (1.5); 0-7 | 1.6 (1.4); 0-4 | 21.6 (53.6) |
| Visit 3 (n=47) | 3.5 (1.7); 0-10 | 0.8 (0.9); 0-4 | 2.6 (1.5); 0-8 | 1.8 (1.4); 0-4 | 21.3 (62.4) |
Predictors of informal care requirements:
Only the scores on the FAS accounted for the variance in the weekly total informal care hours at visit 1 (see Table 4). This remained a constant pattern over time. At Visit 2, the Functional Assessment Scale accounted for 9 % of the variance in hours of informal care (adjusted R 2 8.6%; SE 59.9; F7.8 p<0.007) (excluded variables: TFC, UHDRS-TMS and Independence Scale). At Visit 3, the Functional Assessment Scale accounted for 33 % of the variance in hours of informal care (adjusted R2 30%; SE 25.7; F 13.6; p<0.001) (excluded variables: TFC, UHDRS-TMS and Independence Scale).
Table 5: Linear regression on estimated hours of informal care at Visit 1
| Independent variables | Standardized coefficients | t | Significance |
| Constant | |||
| Functional Assessment Scale | -0.428 | -3.423 | 0.000 |
Adjusted R 2 0.181 ; SE 34.186; F 88.784; p< 0.0001; dependant variable weekly total informal care hours
Discussion
Consideration of service use data reflecting current utilisation in the included sample is an important first step in the provision of high quality care. This study employed the CSRI to gather information about types and quantities of resources used by HD patients. We did not attempt to provide any indication of the monetary cost of service utilisation. This is partly because unit costs will vary according to country and hence in some cases will be applied only to small numbers, but mainly because such “cost of illness” information would not necessarily be optimal in informing policy decisions. Quantifying costs of services (rather than demonstrating frequencies of resource use as we have done) would be more appropriate in the context of an economic evaluation of a specific intervention [21] .
Most HD patients surveyed as part of this study were in receipt of some formal primary and community care services and to a lesser extent hospital based services. Trends in service provision over time may be inferred from the longitudinal data presented but it is important to acknowledge that some bias may be introduced to the study simply as result of being a research participant in a large scale observational study such as REGISTRY. In addition, as the numbers of participants decrease with each visit, there is an associated change in proportional representation of people at each stage of the disease. We cannot infer that the cohort is deteriorating over time resulting in an increased service use; the changes in service use may simply be skewed by this proportional change in individuals at each stage of the disease. We therefore suggest that a general impression of service receipt is best judged at visit 1 (study entry) where any effect on reporting rates and the bias introduced by the annual visit or the altering proportional representation of the sample at each visit is limited.
At enrolment to the REGISTRY study, 89% of HD patients assessed in this data mining study were in receipt of at least 1 form of primary or community care service. It is not possible to establish any measure of how integrated these services were and additionally there was no clear indication of key worker or occupational therapy involvement as this was not part of the standard questions employed in the REGISTRY CSRI. Social worker and nurse involvement was fairly minimal and use of formal home help was reported in only 11% of participants in this cohort. Approximately 1/5th of participants were in receipt of physiotherapy services at the first visit and the use of crutches and walking aids was infrequent. Such infrequent use of walking aids is congruent with suggestions in the literature that physiotherapists do not recommend routine use of aids as choreic movement and cognitive impairment may influence safe use of walking aids in HD patients [22] .
When considering service use frequencies, it is useful to compare with other groups of patients with neurodegenerative diseases. A report (published in 2000) of community services for people with Multiple Sclerosis (MS) (n=150) living in the United Kingdom found that at that time of 45% of people with MS did not receive any form of community services [23] . The remaining 55 % of people with MS were in receipt of a range of services including home help (20%), occupational therapy, physiotherapy (23%), social work (10%) and district nursing (17%). Twenty-seven % of participants had bath or shower adaptations in place. Those people who had no home adaptations (42%) in place were also not in receipt of any services. There appeared to be a substantial unmet need for people with MS in terms of community care with little change since the beginning of the previous decade [23] . The authors advocated the need for integrated, co-ordinated and multi-agency community service for people with MS. Of concern in our data (in light of the suggested relationship between lack of integrated community care and lack of home adaptation [23] ) are the seemingly low levels of home adaptations in this group of people. Adaptations of the home were in place in less than a quarter of HD patients included in this study. Although this may be due to the fact that the minority of those surveyed in this study (at visit 1) were in the late stages of the disease and also that our data may not necessarily be representative of the HD population, further investigation is warranted.
This analysis is not without limitations. It is important to acknowledge that the descriptive data presented here is specific to this fairly small sample (to date REGISTRY has enrolled over 6000 participants so our data is only reflective of approximately 8 % of the HD population). Additionally, almost all of the participants enrolled in REGISTRY are able to reach a HD clinic for annual assessments and on review it was clear that only a small proportion of our sample were in the late stages of the disease. It is therefore likely that the data presented here is not representative of the most severely affected HD patients.
There will also be substantial differences across countries in terms of the support in the community that is available (i.e. service use is supply driven) and additionally there will clearly be inherent differences in health care systems between various European countries. The specific role that each member of the health care team may vary according to geographical region and this level of detail is not captured by the REGISTRY CSRI. Furthermore, there was no distinction between HD or non-HD related service use. It is difficult to say how much of the service use reported here is because of HD and there are many other factors which may lead a person to requiring formal health care services.
Our data suggests a large reliance on informal care in the home in this group studied. At the first visit, half of all the HD patients in this study were in receipt of some manner of informal care in the home. It seems that informal carers will continue in this function up the very limits of their capacity and discussions with family members have highlighted some contributing factors. HD is seen as a family problem that ought to be managed by the involved family. Families trying to use available formal services encounter the problem of frequently changing care-givers and irregularity and restrictions in terms of the hours that the services can be provided. Such irregularity and frequent change is clearly not in agreement with the nature of HD and the person affected with HD. The HD patient is highly dependent on regularity and familiarity, making provision of community based care very challenging. Other studies of people with complex disability have suggested that where community care is limited, the burden of care often falls on the family and informal carers [24] [25] . Carer burden in this community should consequently be carefully considered by the healthcare team and where appropriate additional carer support should be provided. We suggest that use of routine rating scales employed in the clinical assessment may have some potential to identify high risk families where the informal care requirements are high. From the data presented here, it is clear that the TFC had no predictive value on service receipt or on informal care hours whilst the UHDRS functional assessment scale (FAS) had reasonable predictive value on this variable. When individuals present with lower scores on the FAS, they appear to have higher informal care requirements and carer burden may additionally be higher. The FAS is an activity of daily living checklist with range from 0 to 25. The components of the checklist represent multiple domains of function including aspects of employment, finances, shopping, driving, housework, supervising children, personal activities of daily living, mobility and housework. This wide representation of domains may be one reason why the FAS seems to have better predictive value than TFC which is reflective of fewer domains. In this study, the FAS accounted for 30% of the variance in informal care hours by visit 3. In-depth investigation of suitable clinical scales and potential weighting of components may improve predictive value. Such targeted assessments could aid clinicians, funding agencies and policy makers in appropriate service planning and provision of co-ordinated care for HD patients.
The data presented here is suggestive of the need for integrated and proactive care provision that addresses the requirements of the HD patients and their carers. It is clear that a method or a system to aid identification of factors indicative of the need for referral to formal services is required. Studies of the emotional experiences of family carers in HD and supportive care needs for people living with the disease highlight the high levels of emotional stress that can be associated with HD [4] [13] . It is important that care is individualised and specific to the needs of the HD patient. Availability of a consistent team of support workers and appropriate community support and carer support may facilitate management of the varying needs over time and prioritise referrals to services as needed [26] [4] . The high level of informal care reported here indicates that such a model of care is not yet systematically provided in the HD community and is an area that is in need of attention.
Address for correspondence
Monica Busse
Email: [email protected]
Department of Physiotherapy, School of Healthcare Studies, Cardiff University, Cardiff CF14 4XN, United Kingdom
Competing Interests
The authors have declared that no competing interests exist.
Introduction
Huntington’s disease (HD) is an autosomal dominant neurodegenerative disorder caused by a CAG repeat expansion in the HTT gene. HD usually manifests in adult life, causing motor impairments, cognitive decline and behavioural/psychiatric alterations [1] . HD is devastating and inevitably fatal; currently, no disease-modifying treatment is established [2] .
Historically, the study of HD has benefited strikingly from multi-centre research initiatives, typified by the international collaborative effort that identified the causative CAG repeat expansion in the HTT gene in 1993 [3] . Rapid advances in molecular and cellular biology and genetics have produced a wealth of insights at the molecular level [4] . Much effort at present is focused on identifying therapeutic targets and developing treatments that may delay onset of the disease, or slow down or stop the progression of HD once it manifests.
With a prevalence of 5-8/100 000, manifest HD is relatively rare. Thus we need advanced, multi-centre, multi-national research frameworks that allow us to study simultaneously multiple complementary aspects of HD. This includes the natural history of HD, its management and the collection of clinical information and biosamples for research. The European Huntington’s Disease Network (EHDN; www.euro-hd.net), established in 2004, is a collaborative network of HD researchers, HD clinicians, people affected by HD, and their relatives across 18 European countries. It strives to lay the foundations on which to advance knowledge about HD, how to optimally assess disease progression and factors that modify the phenotype. This initiative aims to develop new symptomatic therapies, and provide the infrastructure to test rapidly putative disease-modifying treatments in a multi-centre, multi-national setting with the ultimate goal of improving the quality of life of people affected by the disease [5] .
In the present paper we report on cross-sectional enrolment data of a first cohort of participants in REGISTRY, EHDN’s core observational study. REGISTRY is a multi-centre, prospective observational study with annual follow-up visits that enrols manifest and pre-manifest HD expansion mutation carriers, individuals at risk of HD, non-mutation gene carriers, and controls (no family history of HD). In the present study, we assessed the HD genotype and phenotype across different European regions. We evaluated the phenotype and its variability in relation to CAG repeat length and age as key biological factors; and European region, treatment modality and co-morbidity as environmental factors. Finally, we examined potential predictors of functional capacity in domains relevant to daily life.
Methods and materials
Participants
This report is based on monitored data from the enrolment visit of the first 1766 participants (98% Caucasians) in 66 study sites from 13 European countries within the European Huntington’s Disease Network (EHDN).
Participants gave informed written consent according to the International Conference on Harmonisation-Good Clinical Practice (ICH-GCP) guidelines ( https://www.ich.org/LOB/media/MEDIA482.pdf ). For participants who lacked capacity to consent study sites adhered to country-specific guidelines for obtaining consent. Minors assented with both parents consenting for them. Ethical approval was obtained from the local ethics committee for each study site contributing to REGISTRY.
Study design
Data collection followed a standard protocol (Table 1) using electronic case report forms available in Czech, Danish, Dutch, English, Finnish, French, German, Italian, Norwegian, Polish, Portuguese, Spanish, and Swedish. At each centre, clinicians with long standing experience in HD took a careful history and examined patients clinically; motor, psychiatric and cognitive signs were scored using the Unified Huntington’s Disease Rating Scale (UHDRS) [6] . Assessments were complemented by self-rating scales that probed mood, quality of life and health economics (for an overview and references see Table 1). Disease stage was derived from the Total Functional Capacity (TFC) scores [7] .
Table 1. The complete REGISTRY assessment protocol
| General | Medical History (medical, disease, psychiatric) |
| Demographics (Fixed & Variable) | |
| Comorbid conditions | |
| Concomitant medication | |
| Family History | |
| CAG | |
| Clinicalassessment | UHDRS ’99 Motor, TFC, Functional [6] |
| UHDRS ’99 Behaviour [6] | |
| Becks Depression Inventory [8] | |
| Hamilton Depression Rating Scale [9] | |
| Cognitive assessments | UHDRS ’99 Cognitive (verbal fluency, symbol digit modality test, colour naming, word reading, interference) [6] |
| Quality of Life | SF-36 [10]Caregiver Burden Inventory [11] |
| Health economics | Client Service Receipt Inventory [12] |
| Biosample collection | 30 ml blood, 30 ml urine |
All participants were assigned a 9-digit pseudonym created using a secure one-way hash algorithm. No identifying data were stored on the EHDN server. Data was entered on-line using an electronic web-based data capture system ( www.euro-hd.net ) where a username determines access rights within the web portal. No identifying data were stored on the EHDN server. Entries for medication were coded according to the Anatomical Therapeutic Chemical (ATC) classification (www.whocc.no/atcddd), and co-morbidities were coded according to ICD-10. Data entry onto the webportal was subject to automatic plausibility checks. In addition, study site raters were annually trained, assessed and certified to reduce inter- and intra-rater variability. Following data entry data were monitored on-line and on-site by monitors fluent in the language of the contributing study site. Data monitoring adhered to the principles laid out in ICH-GCP.
Biosample collection
Blood was collected and shipped to BioRep at room temperature for genetic analysis and lymphoblastoid cell line creation (BioRep, Milan, Italy) [13] [14] . DNA was extracted [15] , and HTT gene CAG repeat length was analysed (PCR amplification followed by capillary electrophoresis using the MegaBace Fragment Profiler Software from General Electric, Buckinghamshire, UK [16] [17] . A second, independent, accredited laboratory in Tübingen, Germany, duplicated CAG repeat analyses (Applied Biosystems, CA, USA). Mid-stream urine samples were collected for biomarker studies. DNA and urine were stored at -80°C.
Data analyses
Descriptive statistics were calculated for quantitative variables and frequency counts by category for qualitative variables. Confidence intervals were calculated where appropriate. If not stated otherwise, these intervals were two-sided and provided 95% confidence. For qualitative variables Chi² tests or Fisher’s exact tests were used, for quantitative variables t-tests, Kruskal-Wallis tests (global) and Wilcoxon-rank-sum-tests (pairwise comparisons) were used as appropriate. All tests were performed two-sided where p-values below 5% were regarded as statistically significant.
Cohen’s kappa examined the agreement of the laboratories measuring the CAG repeat lengths [18] .
Linear regression analysis with F-test examined which factors influence continuous variables. Logistic regression evaluated factors explaining absence/presence of suicidal attempts. Multinomial logistic regression was performed to select factors important for the prediction of the disease stage in this cross-sectional analysis and to perform receiver operating characteristic (ROC) analysis to evaluate the predictive value of important factors for the disease stage.
Calculations were performed using R software (version 2.7.1, R Development Core Team (2008)) and NCSS 2007 (NCSS, Kaysville, Utah, USA).
Results
Participants and genotype
Of 1766 participants, 1540 had manifest HD, 226 were pre-manifest gene mutation carriers defined as carrying the HD gene mutation and having a diagnostic confidence score of less than 4 on the UHDRS motor scale [6] . The median estimated age at onset in manifest HD participants was 43 years (range 10-87 years). In 795 patients (45%) the gene was inherited from the mother and in 710 (40.2%) from the father. In 25 participants (1.5%), there was no known family history, and in 234 (13.3%) the information was missing. Thirty-two participants (2.1%) had a juvenile-onset (before the age of 20, [19] ), and 96 (5.4%) had a late-onset of HD (above the age of 60).
Clinical phenotype
We analysed 1468 participants from 13 countries where a complete set of demographic data (age, sex), CAG repeat length (large allele), UHDRS motor score and TFC were all available (Table 2). Numbers of participants from individual countries were too low for meaningful statistical analyses. For this reason we arbitrarily collapsed participants by geographical region. 514 were from Central Europe (Germany, Austria, Switzerland, Netherlands, Belgium), 110 were from Northern Europe (Denmark, Norway, Finland), 457 were from Southern Europe (Italy, Spain, Portugal), 334 were from the United Kingdom, and 53 were from Poland. 784 were female. 1280 had manifest HD, and 188 had premanifest HD (Table 2).
Table 2. Clinical and genetic data from REGISTRY participants. Demographic, clinical and genetic data from REGISTRY participants. All participants (apart from Polish) with core data set (age, CAG repeat larger allele, UHDRS motor score, TFC). 1 Germany, Austria, Switzerland, Netherlands, Belgium; 2 Denmark, Norway, Finland; 3 Italy, Spain, Portugal. CAG repeat information was from BioRep when both local and BioRep were available. Demographic and CAG repeat information is from all participants with core data (Central European n=514; Nordic n=110; Southern European n=457; UK n=286). TFC, disease stage and UHDRS motor score are from all manifest participants (Central European n=445; Nordic n=92; Southern European n=410; UK n=286).
| All | Central European 1 | Northern European 2 | Southern European 3 | UK | |
| Age (median, range) | 49 (10-93) | 47 (20-87) | 50 (23-93) | 49 (11-83) | 49 (17-85) |
| Male:female | 0.87 | 0.85 | 1.08 | 0.92 | 0.79 |
| CAG (median, range) | 44 (36-90) | 43 (38-65) | 42 (36-51) | 44 (36-90) | 43 (37-85) |
| Reduced penetrance range (%) | 45 (3.1) | 9 (1.8) | 11 (10) | 10 (2.2) | 12 (3.6) |
| Premanifest (% total) | 188 (12.8) | 69 (13.4) | 18 (16.4) | 47 (10.3) | 48 (14.4) |
| UHDRS motor | 34 (0-106 | 31 (0-105) | 29 (2-94) | 37.5 (2-106) | 35 (0-101) |
| TFC | 8 (0-13) | 8.2 (0-13) | 8.1 (0-13) | 7.5 (0-13) | 7.4 (0-13) |
| Stage 1 (%) | 389 (30.4) | 166 (37.3) | 25 (27.2) | 130 (31.6) | 58 (20.3) |
| Stage 2 (%) | 405 (31.6) | 136 (30.6) | 37 (40.2) | 100 (24.3) | 119 (41.6) |
| Stage 3 (%) | 333 (26) | 94 (21.1) | 24 (26.1) | 118 (28.7) | 80 (28) |
| Stage 4/5 (%) | 154 (12) | 49 (11) | 6 (6.5) | 63 (15.3) | 29 (10.1) |
Investigators estimated that 615 (48%) participants with manifest HD had motor signs at onset while 251 (19.6%) had a psychiatric onset, 107 (8.4%) first had cognitive signs and 169 (13.2%) had a mixed onset. Information was missing from 125 (9.8%). 503 participants (39.3%) had a life-time history of severe psychiatric signs (psychosis, aggression and suicidal ideation) – 126 (9.8%) participants had two or more severe psychiatric signs and 21 participants (1.6%) had all three. 151 (11.8%) had a life-time history of delusions and/or hallucinations, 244 (19.1%) had disruptive or aggressive behaviour and 255 (19.9%) had suicidal ideation or suicide attempts with a total of 90 recorded suicide attempts in all stages of HD (stage 1: 14 (15.6%); stage 2: 27 (30%); stage 3: 29 (32.2%); stage 4/5: 20 (22.2%)). A high mood subscore of the behavioural score was highly predictive of a suicide attempt (logistic regression analysis, z-test=3.84, p=0.0001) whereas motor, cognitive or the behavioural subscores for apathy, compulsions, psychosis or irritability were not.
The majority of participants who underwent behavioural assessment had behavioural abnormalities (depression, apathy, irritability) in addition to motor signs (694 (86.6%) while 107 (13.4%) had none.
Co-morbid conditions and medication
A co-morbid condition, interfering morbidity or previous intervention was recorded in 706 participants (40.0%). Most common were essential primary hypertension (ICD-10 code I10, 133 participants), pure hyper-cholesterolaemia (E78.0. 62) asthma (J45, 48), diabetes mellitus (E10-E14, 26), hypertrophy of prostate (N40, 27), unspecified arthritis (M13.9, 25) and unspecified hypothyroidism (E03.9, 24). Co-morbid conditions were then grouped revealing that 67 participants (3.8%) had ‘neoplasms’ (ICD-10 C and D), 187 (10.6%) had ‘endocrine disorders’ (ICD 10 E), 227 had ‘cardiovascular disorders’ (ICD-10 G and I), and 148 suffered physical ‘trauma’ as interfering morbidity (ICD-10 S). ‘Trauma’ was common across all stages but was less frequent in stage 4/5 (stage 1: 50 (33.8%), stage 2: 43 (29.1%), stage 3: 30 (20.3%), stage 4/5: 12 (8.1%)).
Most participants were taking medication (1022, 57.9%). The most commonly taken medications are listed in Table 3 with their respective medication class in Table 4.
Table 3 . The most commonly prescribed drugs. A total of 3074 concomitant medications were recorded (ATC: Anatomical Therapeutic Chemical)
| Medication | ATC code | n | Typical indications |
| Tiapride hydrochloride | N05AL03 | 148 | Chorea/hyperkinesias |
| Olanzapine | N05AH03 | 133 | Chorea/dyskinesia/aggression/psychosis |
| Risperidone | N05AX08 | 121 | Chorea/Dyskinesia/aggression/psychosis |
| Citalopram hydrobromide | N06AB04 | 120 | Depression/irritability |
| Paroxetine hydrochloride | N06AB05 | 120 | Depression/irritability |
| Haloperidol | N05AD01 | 109 | Chorea |
| Clonazepam | N03AE01 | 79 | Anxiety |
| Amantadine hydrochloride | N04BB01 | 76 | Chorea/dyskinesia |
| Mirtazapine | N06AX11 | 75 | Depression/insomnia |
| Tetrabenazine | N07XX06 | 69 | Chorea/dyskinesia |
| Lorazepam | N05BA06 | 54 | Anxiety |
| Sulpiride | N05AL01 | 46 | Chorea/dyskinesia/irritability |
Table 4. Medication classes. We defined 5 groups of medication. Medications to treat motor signs (‘anti-dyskinetics’) comprised anti-psychotics (N05AA01), tetrabenazine (N07XX06) and anti-parkinsonian medications (N04A, N04B); ‘anti-depressants’ comprised medications coded as anti-depressants (N06A, N06C), anxiolytics (N05B, N05C), lithium (N05AN01), and anti-epileptics (N03A) where the indication was ‘depression’ or ‘mood stabilisation’. ‘Anti-dementia’ included medications coded as anti-dementia (N06D) or psychostimulants (N06B). ‘Nutritional supplements’ were all medications with ATC codes A11, B03BB01, C10AX06, H05BA01, N06BX13, or C01EB05. All other medications were combined as ‘others’. In manifest participants, ‘anti-dyskinetics’ were used more frequently in Southern Europe and Poland (p<0.0001), and in Southern Europeans ‘anti-depressants’ were used somewhat more frequently than in other regions (p<0.0001). Use of all other medications was similar across regions. ATC: Anatomical Therapeutic Chemical
| Medication class | All manifest participants | Central European | Northern European | Southern European | UK | Poland |
| Anti-dyskinetic | 607 (39.3%) | 199 (37.2%) | 18 (18%) | 263 (56%) | 94 (23.9%) | 33 (70%) |
| Anti-depressant | 702 (45.6%) | 203 (38.1%) | 39 (39%) | 270 (57.7%) | 169 (43.1%) | 21 (45.7%) |
| Anti-dementia | 65 (4.2%) | 45 (8.4%) | 6 (6%) | 12 (2.6%) | 0 | 2 (4.3%) |
| Nutritional supplements | 171 (11.1%) | 78 (14.4%) | 12 (12%) | 58 (12.4%) | 16 (4.1%) | 7 (14.9%) |
| Other | 335 (21.8%) | 142 (26.6%) | 19 (19%) | 76 (16.2%) | 79 (20.2%) | 19 (40.4%) |
Genotype and phenotype across European regions
Across contributing European regions gender distribution was similar (Table 2; χ 24 = 2.5273, n.s.). CAG repeat length differed statistically between regions (p<0.05 and p<0.0001, respectively); participants from Northern Europe had slightly shorter repeat lengths than those from Central Europe (p<0.0001), Southern Europe (p<0.0001) and the UK (p=0.0001, Table 2) probably because there were no Nordic participants with very large CAG repeat length expansions.; Southern European participant’s CAG repeat lengths were slightly larger than those of participants from Central Europe (p<0.01) or from the UK (p<0.01). Central European participants were younger than participants from Southern Europe (p=0.01) and the UK (p<0.05), and UHDRS motor scores were also similar apart from Southern European participants who had a slightly higher motor score than Central Europeans (p<0.0001), Northern Europeans (p<0.01) and the UK (p<0.05), with no further differences observed between other regions (Table 2). Central Europeans were slightly less advanced in HD than Southern Europeans (p=0.01) and UK participants (p<0.01).
Association of phenotype with disease burden
We related the severity of the clinical signs across three domains of HD (motor, behaviour (n=801), cognition (n=676)) to a measure of the biological disease burden calculated from a participant’s age and CAG repeat length ((CAG n -35.5) X age = disease burden: [20] . UHDRS motor score increased in severity with increasing disease burden (linear regression, adjusted R 2 =0.19, p<0.0001, Figure 1A) while cognitive composite score (UHDRS total correct for letter fluency, symbol digit modalities test and Stroop subscores for word reading, colour naming and interference; linear regression, adjusted R 2 =0.1224, p<0.0001 Figure 1B) or equally weighted scores (adjusted R 2 =0.1245, p<0.0001) and function declined (linear regression, adjusted R 2 =0.1172, p<0.0001, Figure 1C). In contrast, there was no linear association of the total behavioural score, or the subscores mood (depression, low self esteem, anxiety, freq*severity), psychosis (delusions and hallucinations, freq*severity), irritability/aggression (disruption, aggression and perseverations, freq*severity) or compulsions (freq*severity) with disease burden (Figure 1D). Only apathy (freq*severity) was very weakly associated with disease burden (adjusted R 2 =0.01, p=0.0024).

Fig. 1: Association of UHDRS domain score, or TFC, with disease burden. A. Linear increase of motor score with increasing disease burden. B. Linear decrease of cognitive score with increasing disease burden. C. Linear decline of TFC with increasing disease burden. D. No linear association of behavioural score with disease burden.
The variability of the phenotype
The amount of variability of the scores in the three symptom domains of HD explained by disease burden alone was low. We therefore assessed the extent to which biological (‘age’, ‘CAG repeat length’) or environmental factors (‘region’, ‘medication’, ‘co-morbidity’) contributed to this variability. Overall, 23% of the variation of the motor score was explained by the factors in the final multiple linear regression model (p<0.0001, adjusted R 2 =0.23). A higher motor score was associated with the use of ‘anti-dyskinetics’, with the presence of ‘trauma’, with increasing age and increasing CAG repeat lengths (Figure 2). For the behavioural score, 12% of the variation of the behavioural score was explained by the factors in the final model (p<0.0001, adjusted R 2 =0.12). The use of ‘anti-depressants’ and ‘anti-dyskinetics’, and the presence of endocrine co-morbidity, was associated with a higher behavioural score. Overall, 24% of the variation of the composite cognitive score was explained by the factors in the final model (p<0.0001, adjusted R 2 =0.24), and 25% of the cognitive score where items were weighted equally (p<0.0001, R 2 =0.25). A higher cognitive score was associated with the use of ‘nutritional supplements’ and ‘other medications’ whereas a lower score was associated with the use of ‘anti-dyskinetic’ medication, increasing CAG repeats and age.
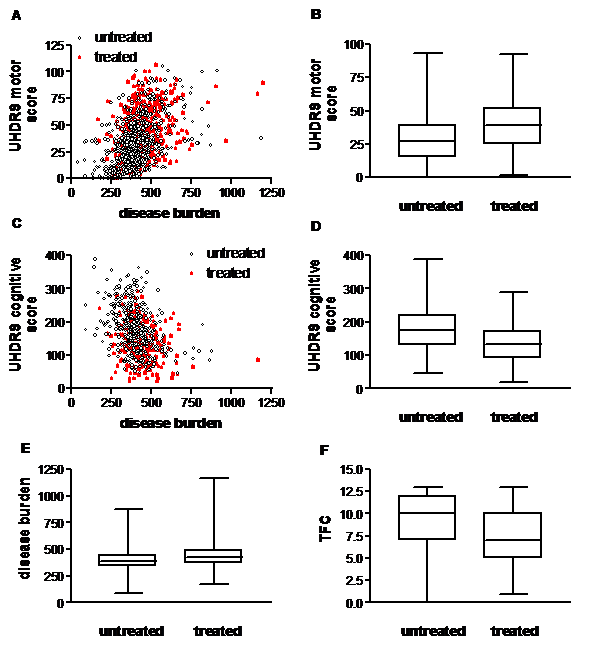
Fig. 2: Treatment with anti-dyskinetic medications. Participants on medication for motor signs (‘treated’ with anti-dyskinetic, dopamine depleting or dopaminergic) had a higher motor score than un-treated participants (Mann-Whitney U test, p
Total functional capacity
Finally, we investigated whether changes in the scores in the three domains, biological (‘age’, ‘CAG repeat length’) or environmental factors (‘region’, ‘medication’, ‘co-morbidity’) predicted disease stage. To this end we used multi-nomial logistic regression analysis with the disease stage as dependent variable and domain scores, biological and environmental factors as independent variables. For cognitive scores we used the composite score, an equally weighted score or the subscores. In the final model, the factors ‘motor score’, ‘region’ and ‘cognitive score’ explained 28% of the variability of disease stage. The results were similar when using the composite cognitive score or an equally weighted cognitive score, or the symbol digit test as single subscore. Internal validation using the same data correctly classified about 59% of all participants across all disease stages compared with the actual disease stages (table 5). The ROC analysis of the final model accurately classified more than 80% for each individual stage except for disease stage 2 with an accuracy of about 75% (Table 5 and Figure 3).
Table 5. Comparing the accuracy of multinomial logistic regression analyses with different types of cognitive score. Comparison of the performance of different multinomial logistic regression models with the total sum cognitive score, equally weighted cognitive score or symbol digit subscore.
| Accuracy | |||||
| Cognitive score | Proportion correct (%) | Disease Stage 1 | Disease Stage 2 | Disease Stage 3 | Disease Stage 4/5 |
| Cognitive score | 58.9 | 84.8 | 73.9 | 82.6 | 86.2 |
| Cognitive equally weighted | 59.5 | 84.8 | 74.1 | 82.4 | 86.5 |
| Subscores (symboltest) | 58.5 | 84.5 | 74.2 | 81.9 | 83.1 |

Fig. 3: Receiver operating characteristic (ROC) curves plot the sensitivity versus (1-specificity) for classifying each disease stage (stages 1-4/5).
Discussion
We report on the first cross-sectional data cut of REGISTRY, EHDN’s large scale multi-centre multi-national prospective observational study of HD.
The proportions of gene mutation carriers, manifest participants, and among these juvenile and late-onset participants, were similar across regions. Age and gender distribution, CAG repeat length, and the severity of the core symptom domains of HD (motor, cognitive, behaviour) as well as functional capacity were broadly comparable across different European regions. Ethnicity may influence the prevalence of HD; in Japanese for instance, and possibly in Sub-Saharan Africans, HD may be much rarer than in Caucasian populations [21] . Whenever HD manifests, however, the phenotype and progression of the disease appear similar. This is in agreement with data from Venezuela where the phenotype and CAG repeat length expansions are similar to participants from North America or Europe [22] . Europeans taking part in this study were mainly Caucasian. Despite sharing much of their genetic makeup, extensive SNP maps suggest that Northern and Southern European populations differ to some extent [23] . This suggests that the CAG repeat expansion in the HTT gene influences the phenotype in a similar way across Europe. However, environmental influences may differ, one example being medication with more than half of all manifest participants taking medication. Investigators prescribed similar medication classes. Southern European and Polish investigators, however, used anti-dyskinetic medication more frequently than investigators in other regions.
Collapsing contributing countries into regions was somewhat arbitrary. In the future, with larger numbers of participants we could re-examine whether extracting any one country from a regional bin leads to a different finding. Any difference could reflect different genetic, or environmental, influences within that given country. However, the similar CAG repeat genotypes and phenotypes across European regions imply that one can conduct treatment trials across Europe without the need for stratification according to country. Considering the potential scale of these trials, this is encouraging.
The evolution of the phenotype, and its variability
Since the phenotype was similar in European regions we evaluated the evolution of HD in the whole cohort of participants. Good evidence suggests that biological factors, in particular CAG repeat length and age, contribute to when first symptoms manifest and how HD evolves biologically [20] [22] [24] [25] . Thus we related the evolution in three clinical domains, i.e. motor, cognitive and behaviour, to the continuous measure of biological disease burden that is linearly associated with the neuropathological disease stage and is closely related to striatal volumes [20] . In contrast to clinical ratings of disease evolution, such as TFC, disease burden consists of unambiguous variables. Our data indicate that motor score and TFC increased and cognitive score decreased monotonically with an increasing biological disease burden. This is in accord with longitudinal observations of clinical evolution alone [26] . In contrast, with the exception of the apathy subscore, behavioural scores were not associated with disease burden. The effective treatment of many behavioural problems, e.g. depression, irritability, aggression or psychosis may suggest these behaviours are episodic rather than progressive. If left untreated, however, it is possible that symptoms such as e.g. irritability may progress, and it is likely that some behaviours do reflect degenerative neuropathological processes. The treatment of apathy proves much more difficult; sometimes apathy may improve with successful treatment of a depressive episode or psychosis suggesting it may be part of several different underlying psychopathologies including depression and, as a negative syndrome, psychosis [27] [28] . Current concepts of what constitutes apathy, and how to diagnose it, have recently been reappraised [27] [28] . Since apathy is currently not well defined, and its origins may be quite different, it is perhaps not surprising that the association of apathy with disease burden is not as strong as that of motor or cognitive signs.
Taken together, these data suggest that the clinical evolution of HD, and the subsequent impediments in daily life, reflects the neuropathological changes accruing over time. The relation of clinical findings to biological factors extends previous descriptions of the clinical evolution of HD [26] . However, overall, the variability of the clinical scores explained by the disease burden score was moderate. One explanation might be that CAG repeat length and age are only two of many biological factors determining the evolution of HD [22] . Environmental factors, e.g. medication, may also contribute to the variability. The use of anti-dyskinetic medication for instance influenced all three domains since it was associated with a higher motor score, a higher behavioural score and a lower cognitive score.
The strength of our study is the large number of participants with data collected across Europe following the same study protocol. We demonstrate that such studies can be conducted effectively across different countries and multiple languages. In addition, investigators are regularly trained and certified to improve data quality. REGISTRY, unlike many observational clinical research initiatives, engaged data monitoring based on the principles of ICH-GCP. Participating sites are visited regularly by a team of trained monitors in order to ensure the plausibility and accuracy of the data, and to promote adherence to the study protocol and its procedures. Data monitoring is not a prerequisite for cohort studies, but it is an investment to enhance the collection of more robust and reliable data.
All predictions on the evolution of the HD phenotype from the present cross-sectional analyses need to be tested further in an appropriate longitudinal follow-up design that examines relative effects over time. The REGISTRY database continues to expand and should allow such studies in the very near future. In addition, given more time and repeated visits, missing data can be resolved such that both the proportion and the total number of complete data sets increases. This includes the length of time and dosing regime of participants on medication, which were not taken into account in the present study.
A separate concern relates to whether the sample is truly representative. The database necessarily reflects the HD population who live near to neurological HD services, which are predominantly located in cities. The present cohort may also have been biased towards excluding individuals with active, e.g. psychiatric problems leaving less time to participate in the study. Late-stage participants were also under-represented illustrating their difficulties in attending out-patient clinic and the limitations using currently available scales.
Many studies of HD, including REGISTRY, rely on assessment scales that depend on subjective impressions of clinicial ratings. Rating scales themselves may also differ in quality and thus introduce data variability. The UHDRS has not (yet) been evaluated using analytical methods such as the Rasch analysis or Item Response Theory [29] , although such analyses are well under way. However, the variability of clinical signs and their ratings also underlines the need to identify and validate better biomarkers of disease progression.
The unparalleled large collection of clinical data and biomaterials in REGISTRY will enable research projects to be conducted on a scale that has not previously been possible. The initiative will expedite the search for disease modifiers (genetic and environmental) of age at onset and disease progression that could be harnessed for the development of novel treatments, thus offering a promising new direction towards slowing down or preventing this debilitating disease.
Acknowledgements
We wish to acknowledge the time and effort of all participants in this study. EHDN is supported and funded by the CHDI Foundation Inc.. We thank Marc Sutton for invaluable help with converting medication entries into the ATC code.Funding information
Funding Information
The European Huntington’s Disease Network is funded by CHDI Foundation, Inc.
Competing interests
The authors have declared that no competing interests exist.
Writing committee: M Orth, OJ Handley, C Schwenke, SB Dunnett, D Craufurd, A Ho, EJ Wild, SJ Tabrizi, GB Landwehrmeyer
Registry Steering committee: A-C Bachoud-Lévi, AR Bentivoglio, I Biunno, R Bonelli, J-M Burgunder, SB Dunnett, JJ Ferreira, OJ Handley, A Heiberg, T Illmann, GB Landwehrmeyer, J Levey, JE Nielsen, M Päivärinta, RAC Roos, A Rojo Sebastián, SJ Tabrizi, W Vandenberghe, C Verellen-Dumoulin, J Zaremba, T Uhrova, J Wahlström
Biostatistics: C Schwenke, M Orth
Information technology: T Illmann, M Wallner
Language coordinators: K Barth, M Bascuñana Garde, R Bos, D Ecker, OJ Handley, N Heinonen, C Held, M Laurà, A Martínez Descals, T Mestre, D Monza, J Naji, M Orth, H Padieu, S Pro Koivisto, A Rialland, P Sasinková, P Trigo Cubillo, M van Walsem, M-N Witjes-Ané, D Zielonka
Contributors:
AUSTRIA:
Graz (LKH Graz, Abteilung für Psychiatrie): Raphael M. Bonelli; Brigitte Herranhof; Anna Hödl; Michael Koppitz; Markus Magnet; Daniela Otti; Annamaria Painold; Karin Reisinger
BELGIUM :
Brussels (VUB, Neurology): Anja Flamez; Vera Morez; Sylvie de Raedt
Charleroi (Institut de Pathologie et de Génétique (IPG)): Pascale Ribaï; Christine Verellen-Dumoulin
Leuven (Universitair Ziekenhuis Gasthuisberg): Wim Vandenberghe; Dimphna van Reijen
DENMARK:
Copenhagen (Hukommelsesklinikken, Rigshospitalet): Lis Hasholt; Lena E. Hjermind; Oda Jakobsen; Anne Nørremølle; Sven Asger Sørensen; Jette Stokholm
FINLAND:Helsinki-Vaestoliito (Department of Medical Genetics Väestöliitto): Maarit Peippo; Marjatta Sipponen
Turku-Suvituuli (Rehabilitation Centre Suvituuli): Heli Hiivola; Kirsti Martikainen; Katri Tuuha
GERMANY:
Aachen (Universitätsklinikum Aachen, Neurologische Klinik): Christoph Michael Kosinski; Daniela Probst; Christian Sass; Johannes Schiefer; Christiane Schlangen; Cornelius J. Werner
Berlin (Klinik und Poliklinik für Neurologie – Charité – Universitätsmedizin Berlin): Josef Priller; Harald Prüß
Bochum (Huntington-Zentrum (NRW) Bochum im St. Josef-Hospital): Jürgen Andrich; Rainer Hoffmann; Peter Kraus; Christian Prehn; Carsten Saft; Stephan Salmen; Katrin Straßburger
Dinslaken (Gesundheitszentrums Lang in Dinslaken): Herwig Lange
Dresden (Universitätsklinikum Carl Gustav Carus an der Technischen Universität Dresden, Klinik und Poliklinik für Neurologie): Ulrike Hunger; Matthias Löhle; Simone Schmidt; Alexander Storch; Anett Wolz; Martin Wolz
Freiburg (Universitätsklinik Freiburg, Neurologie): Johann Lammbeck; Birgit Zucker
Hamburg (Universitätsklinikum Hamburg-Eppendorf, Klinik und Poliklinik für Neurologie): Ute Hidding; Alexander Münchau; Michael Orth; Lars Stubbe
Heiligenhafen (Psychatrium Heiligenhafen): Walburgis Heinicke; Michael Orth
Marburg KPP (Klinik für Psychiatrie und Psychotherapie Marburg-Süd): Bernhard Longinus
Marburg Uni (Universität Marburg, Neurologie): Jens Carsten Möller; Ida Rissling
München (Huntington-Ambulanz im Neuro-Kopfzentrum – Klinikum rechts der Isar der Neurologischen Klinik und Poliklinik der Technischen Universität München): Alexander Peinemann; Michael Städtler; Adolf Weindl
Münster (Universitätsklinikum Münster, Klinik und Poliklinik für Neurologie): Stefan Bohlen; Herwig Lange; Ralf Reilmann
Taufkirchen (Isar-Amper-Klinikum – Klinik Taufkirchen (Vils)): Antonie Beister; Matthias Dose; Gabriele Leythaeuser; Ralf Marquard; Caroline Schrenk; Michele Schuierer; Alexandra Wiedemann
Ulm (Universitätsklinikum Ulm, Neurologie): Daniel Ecker; Bernhard Landwehrmeyer; Franziska Lezius; Sonja Trautmann
ITALY:
Florence (Neurologia I- Unita’ di Neurogenetica Departimento di Neurologia e Psichiatria, Universita’ di Firenze): Elisabetta Bertini; Claudia Mechi; Marco Paganini; Sivia Piacentini; Maria Romoli; Sandro Sorbi
Genoa (Dipartimento di Neuroscienze, Oftalmologia e Genetica (DiNOG) Università di Genova): Giovanni Abbruzzese; Monica Bandettini di Poggio; Emilio Di Maria; Giovanna Ferrandes; Paola Mandich; Roberta Marchese
Milan ( Fondazione IRCCS Istituto Neurologico C. Besta, Milan): Alberto Albanese; Stefano Di Donato; Caterina Mariotti; Paola Soliveri
Naples (Azienda Ospedaliera Universitaria Federico II – Dipartimento di Scienze Neurologiche): Rinaldi Carlo; Di Maio Luigi; Giuseppe De Michele; Carlo Rinaldi; Elena Salvatore; Tecla Tucci
Pozzilli (Neuromed, PARCO TECNOLOGICO (Centro Studi)): Andrea Ciarmiello; Tiziana Martino; Maria Simonelli; Ferdinando Squitieri
Rome (Istituto di Neurobiologia e Medicina Molecolare CNR/ Istituto di Neurologia, Dipartimento di Neuroscienze/ CNR Istituto di Scienze e Tecnologie della Cognizione): Anna Rita Bentivoglio; Alfonso Fasano; Marina Frontali; Arianna Guidubaldi; Tamara Ialongo; Gioia Jacopini; Giovanna Loria; Carla Piano; Silvia Romano; Francesco Soleti; Maria Spadaro; Paola Zinzi
NORWAY
Oslo-RH (Rikshospitalet, Dept. of Medical Genetics): Arvid Heiberg; Marleen R van Walsem
Oslo-Ulleval: Kathrine Bjørgo; Madelein Fannemel; Per Gørvell. Lars Retterstøl
Trondheim (St. Olavs Hospital): Inga Bjørnevoll; Sigrid Botne Sando
POLAND
Gdansk (St Adalbert Specialistic Hospital, Gdansk Zaspa): Emilia Jadwiga Sitek; Jaroslaw Slawek; Witold Soltan
Katowice (Silesian Medical University Katowice): Magdalena Boczarska-Jedynak, Barbara Jasinska-Myga, Gregorz Opala
Krakow (Krakowska Akademia Neurologii): Monika Rudzińska; Andrzej Szczudlik; Magdalena Wójcik, Krzysztof Banaszkiewicz
Poznan (Medical University of Poznań): Anna Bryl; Anna Ciesielska; Aneta Klimberg; Wojciech Kozubski; Jerzy Marcinkowski; Pani Justyna Sempołowicz; Daniel Zielonka
Warsaw-MU (Medical University of Warsaw, Neurology): Piotr Janik; Anna Kalbarczyk; Hubert Kwiecinski; Zygmunt Jamrozik
Warsaw-IPiN (Institute of Psychiatry and Neurology Dep. of Genetics, Dep. of Neurology): Jakub Antczak; Grzegorz Witkowski, Maryla Rakowicz;Przemyslaw Richter; Danuta Ryglewicz; Jacek Zaremba; Elzbieta Zdzienicka
PORTUGAL
Lisbon-Fernando Fonseca (Hospital Fernando Fonseca, Serviço de Neurologia): Christina Costa
Lisbon-Santa Maria (Neurological Clinical Research Unit, Institute of Molecular Medicine : Miguel Coelho; Joaquim J Ferreira; Tiago Mestre; Mário M Rosa; Anabela Valadas
Porto-São João (Hospital São João E.P.E.): Miguel Gago; Carolina Garrett; Maria Rosalia Guerra
SPAIN
Barcelona-Bellvitge (Hospital Universitari de Bellvitge): Jordi Bas; Matilde Calopa
Barcelona (Hospital Mútua de Terrassa) : Miquel Aguilar Barberà; Dolores Badenes; Laura Casas; Sonia Escalante Arroyo; Jorge Hernández Vara; Jerzy Krupinski; Judith López; Marta Obdulia; Pilar Quilez Ferrer; Ana Rojo Sebastián; Silvia Romero Contreras; Gemma Tome Carruesco
Burgos (Servicio de Neurología Hospital General Yagüe): Esther Cubo; Natividad Mariscal; Jesús Sánchez
Granada: Francisco J Barrero (Hospital Universitario San Cecilio, Neurología); Blas Morales & José Luis López-Sendón Moreno (Hospital Universitario Ramón y Cajal, Neurología)
Madrid-Clinico (Hospital Clínico Universitario San Carlos): Rocío García-Ramos García; Purificacion Pin Quiroga; Clara Villanueva
Madrid FJD: (Madrid-Fundación Jiménez Díaz): Pedro-José García Ruíz-Espiga; Asunción Martínez; María José Saiz Artiga; Vicenta Sánchez
Madrid RYC (Hospital Ramón y Cajal, Neurología): Mónica Bascuñana; Marta Fatas; Guillermo García Ribas; Justo García de Yébenes; José Luis López Moreno; Christine Schwarz; Patricia Trigo Cubillo
Palma (Hospital Son Dureta): Penelope Navas Arques; Aranzazú Gorospe; Inés Legarda; María José Torres Rodríguez
Pamplona (Hospital Virgen del Camino, Medical Genetic): Itziar Gaston; Maria A. Ramos-Arroyo
Zaragoza (Hospital Clinico Universitario “Lozano Blesa” de Zaragoza): Javier López del Val; Laura Martinez
SWITZERLAND
Bern: Jean-Marc Burgunder (Neurologische Klinik des Inselspitals); Irene Romero; Michael Schüpbach; Sabine Weber Zaugg (Zentrum für Bewegungsstörungen, Neurologische Klinik und Poliklinik)
THE NETHERLANDS
Enschede (Medisch Spectrum Twente): Monique S.E. van Hout; Jeroen P.P. van Vugt; A. Marit de Weert
Groningen (Polikliniek Neurologie): J.J.W. Bolwijn; Meike Dekker; K.L. Leenders; Joost.C.H. van Oostrom
Leiden (Leiden University Medical Centre (LUMC)): Reineke Bos; Eve Dumas; Caroline K. Jurgens; Raymund A.C. Roos; Marie-Noëlle Witjes-Ané
U.K.
Aberdeen (NHS Grampian, Clinical Genetics Centre): Kirsty Matheson; Daniela Rae; Sheila Simpson; Fiona Summers; Alexandra Ure
Birmingham(The Barberry Centre, Dept of Psychiatry): Adrienne Curtis; Jenny Keylock; Hugh Rickards; Jan Wright
Cambridge (Cambridge Centre for Brain Repair, Forvie Site): Roger A. Barker; Kate Fisher; Anna Olivia Goyder Goodman; Susan Hill; Ann Kershaw; Sarah Mason; Nicole Paterson; Lucy Raymond
Cardiff (The Institute of Medical Genetics, University Hospital of Wales): Jon Bisson; Monica Busse; Lynda Ellison-Rose; Olivia Handley; SB Dunnett; Jenny Naji; Kathy Price; Anne Rosser
Edinburgh (Molecular Medicine Centre, Western General Hospital, Department of Clinical Genetics) : Maureen Edwards; Paul A. De Sousa; Teresa Hughes; Marie McGill; Pauline Pearson; Mary Porteous; Adam Zema
Fife (Scottish Huntington’s Association Whyteman’s Brae Hospital) : Peter Brockie; Jillian Foster; Nicola Johns; Sue McKenzie; Gareth Thomas
Gloucester(Department of Neurology Gloucestershire Royal Hospital) : Liz Burrows; Amy Fletcher; Fiona Laver; Mark Silva; Aileen Thomson
Leeds (Chapel Allerton Hospital, Department of Clinical Genetics): Carol Chu; Emma Hobson; Stuart Jamieson; Jean Toscano; Sue Wild; Pam Yardumian
Leicester (Leicestershire Partnership Trust, Mill Lodge): Colin Bourne; Carole Clayton; Heather Dipple; Janet Grant; Diana Gross; Caroline Hallam; Julia Middleton; Ann Murch
London (Guy’s Hospital): Thomasin Andrews; Andrew Dougherty; Fred Kavalier; Charlotte Golding; Alison Lashwood; Dene Robertson; Deborah Ruddy; Anna Whaite
London (The National Hospital for Neurology and Neurosurgery): Thomasin Andrews; Stefania Bruno; Charlotte Golding; Susie Henley; Marianne Novak; Christine O’Driscoll; Aakta Patel; Elisabeth Rosser; Sarah Tabrizi; Rachel Taylor; Thomas Warner; Edward Wild
Manchester (Genetic Medicine, University of Manchester, Manchester Academic Health Sciences Centre and Central Manchester University Hospitals NHS Foundation Trust): Natalie Arran; David Craufurd; Ruth Fullam; Liz Howard; Susan Huson; Lucy Partington-Jones; Nichola Ritchie; Julie Snowden; Annie Solom; Cheryl Stopford; Jennifer Thompson; Leann Westmoreland
Oxford(Churchill Hospital): Andrea H Nemeth; Gill Siuda
Sheffield (The Royal Hallamshire Hospital): Oliver Bandmann; Alyson Bradbury; Kay Fillingham; Isabella Foustanos; Oliver Quarrell; Hazel Reynders; Lisa Robertson; Katharine Tidswell
]]>