
Notice of Retraction

Abstract
Foodborne diseases cause an estimated 48 million illnesses each year in the United States, including 9.4 million caused by known pathogens. Real time detection of cases and outbreak sources are important epidemic intelligence services that can decrease morbidity and mortality of foodborne illnesses, and allow optimal response to identify the causal pathways leading to contamination. For most outbreaks associated with fresh produce items, outbreak source detection typically occurs after the contaminated produce items have been consumed and are no longer in the marketplace. We developed a probabilistic model for real time outbreak source detection, prediction of outbreaks, and contamination-prone area mapping with the aim of developing a cyber-infrastructure to support this activity. The model’s inputs include environmental, trade and epidemiological dynamics. Because effective distance reliably predicts disease arrival times we estimate the distance of outbreak sources from spatio-temporal patterns of foodborne outbreaks. As a case study we consider the 2013 Cyclospora outbreaks in the USA that were related to contaminated fresh produce (cilantro and fresh salad mix) from Mexico. We are able to match case distributions related to both food commodities and determine their outbreak sources with an average accuracy of 0.93. Assuming a similar pattern of contamination for 2014, with predictions of rainfall and temperature for the 2014 summer we predict a prevalence 15% higher than 2013. The study aims to provide a methodological framework to evaluate environmentally sensitive food contamination and assess interdependencies of socio-environmental factors causing contamination. We emphasize the linkage of patterns and processes, the positive role of uncertainty, and challenge the belief that information about the whole food supply chain is needed for traceback analysis to be useful for identifying likely sources. Our specific prediction for 2014 strongly emphasizes the need for real-time surveillance to identify and respond to this pending outbreak.
Funding Statement
M. Convertino acknowledges funding form the MnDRIVE Global Food Initiative at the University of Minnesota. Funding from the Institute on the Environment at the University of Minnesota are also acknowledged. ‘The funders had no role in study design, data collection and analysis, decision to publish, or preparation of the manuscript. ‘The authors have declared that no competing interests exist.
Introduction
1.1. Foodborne Outbreaks and Limitations of Current Approaches to Foodborne Disease Surveillance
State, local and territorial public health departments have the primary responsibility for identifying and investigating foodborne disease outbreaks. Outbreak reports are compiled by the Center for Disease Control and Prevention (CDC) through a web-based program, the National Outbreak Reporting System (NORS). Despite efforts to improve coordination of surveillance on national and international levels through the use of laboratory-based systems such as PulseNet, differences in the efficiency of outbreak investigation and reporting by health agencies remain. Moreover, state and local health agencies frequently act independently of each other, creating difficulties in rapid detection and response to multi-state outbreaks. There is also lack of real-time computational tools for detecting outbreak sources 1,2,3,4 . Typically, health officials detect the outbreak source by combining epidemiologic and microbiologic data with food chain information obtained from food system stakeholders. This investigative approach is very time consuming and for most fresh produce-associated outbreaks, the precise detection of the source occurs after the implicated product has been exhausted from the marketplace 5 . This non-computationally based approach also has limited ability to predict potential future outbreaks, to provide information about the critical contamination-prone areas and in the surveillance system, and to deal with uncertainty in case, food trade, and microbiological data. An illustrative example of important limitations in the food surveillance system occurred in the summer of 2013 with a Cyclospora outbreak in USA 6 .
1.2. Cyclospora Outbreaks and Case Study
Cyclospora infections cause watery, and sometimes explosive, diarrhea. The one-celled parasite can enter the body when people ingest contaminated food or water. Cyclospora has caused several multi-state outbreaks in the United States in the past decade, most of which have been traced back to fresh imported produce 6,7 . In the USA, Cyclospora outbreaks have a typical summer peak that occurs following the distribution of contaminated fresh produce. Because the clinical illness is not specific and diagnosis requires a request for specific laboratory tests, diagnosis may be delayed. Delayed recognition of cases, and a 2-week incubation period add to the difficulty in attributing infections to a specific food source.
From 1996-1998, an annually recurring series of outbreaks due to contaminated Guatemalan raspberries involved the USA and Canada 8 . The Cyclospora outbreak in 2013 in the USA was among the largest foodborne Illness outbreaks of 2013. The outbreak was due to contaminated salad mix (iceberg and romaine lettuce, red cabbage, and shredded carrots) and cilantro, with 631 sick people (Fig. S3). This particular outbreak was also one of the most confusing, as at the end it appeared to be two separate Cyclospora outbreaks working in tandem. One group of illnesses was tentatively traced to a lettuce supplier in Mexico, while a second group of illnesses was linked to fresh cilantro grown in Puebla, Mexico. Because of the potential for recurrent Cyclospora outbreaks from the same source, rapidly identifying the outbreak source is critical to establishing effective control measures at the production stage.
1.3. Proposed Model
Source attribution and detection models have been developed in the literature of epidemiology and cybersecurity 9,10,11 . However, these models are non-physical Bayesian models that have never really been proven useful. The limited application of these models is related to the fact that they do not include any physical factors or processes in their dynamics, and they have been focused on outbreak-food-pathogen attribution rather than detection of outbreak sources 12,13,14 . Thus, these models have never been used in system surveillance and design. Our model is a physical-/network-based model 15,16,11,14,17 , based on the idea of replacing the conventional geographic distance by a measure of effective distance derived from the underlying food trade network and outbreak spreading patterns. The model is based on the model of 18 . Our innovation is in the coupling of such a traceback model with global sensitivity and uncertainty analyses (GSUA) 19,20 for solving attribution uncertainty related to co-occurring outbreaks and for assessing system factor importance and identifying interactions that cause outbreaks14 . Based on the novel notion of distance, patterns that exhibit complex spatiotemporal structure in the conventional geographic perspective turn into regular, wavelike solutions. To each outbreak pattern there is a corresponding food trade sub-network that is likely to be responsible for carrying contamination. This permits the definition of effective epidemic wave fronts, propagation speeds, and the reliable estimation of epidemic arrival times, based on the knowledge of the underlying food mobility network (Figs. S1,S2). The method provides two key insights. First, epidemiological factors are independent from the transport parameters, and second, the dynamics are dominated by only a small percentage of transport connections. Thus, the simplification of the food supply chain into a coarser food trade network provides an effective tool to quickly identify the likely geographic origin of the outbreak. This is also verified with the assumption of human mobility – and related travel related food contaminations – as a second order factor. The detection of the origin of complex, multiscale dynamical spreading patterns is important for four reasons: (i) to determine what has caused the outbreak, (ii) to develop timely mitigation strategies, (iii) to predict its further spread (the arrival times in remote locations and the expected prevalence), and (iv) to map critical areas for contamination of food by looking at all observed outbreaks. This complex systems science based model also aims to identify analytics that reproduce fundamental processes without the need of extensive data that are very hard to get in reality 16,17,21 .
Materials and Methods
2.1. Data
The population layer is based on the high-resolution population database of the “Gridded Population of the World’’ project of the Socio Economic Data and Applications Center (SEDAC) that estimates the population with a granularity given by a lattice of cells covering the whole planet at a resolution of 15 × 15 minutes of arc. At sea level one minute of arc along the equator or a meridian equals approximately one Nautical mile (1.852 km or 1.151 mi).
The International Agro-Food Trade Network (IFTN) for the USA is built using data of ComTrade 22 for the worldwide linkages among countries, and data from the United State Department of Agriculture, Foreign Agricultural Service’s Global Agricultural Trade System (GATS) 23 for the trade network of imported food commodities in USA. Additional data is used from the Agricultural Marketing Service 24 . The use of both datasets allows one to cross check erroneous data and to complement missing data missing. In this case study we focused only on cilantro and fresh produce. Nodes of the network represent the countries, while the directed edges indicate the food trade fluxes among countries.
Data of imported and produced food that is locally consumed is obtained from FAOSTAT food balance sheets 25 . Such information is useful for calibrating the model factor that determines how many individuals consume the contaminated food.
Rainfall and temperature data are derive from the USGS, Famine Early Warning Systems Network (http://earlywarning.usgs.gov/fews/).
2.2. Effective Distance and Traceback Model
The traceback model we applied and further developed is mathematically similar to a fluid dynamics model for fluid motion characterization considering wave patterns. Such problems only require the dynamic information in a small time window, e.g., one snapshot of the wave spreading pattern. The model is based on the optimal inference of epidemiological factors that better explain the spatio-temporal occurrence of foodborne outbreaks for any potential outbreak location to which different food trade paths correspond. The range of values is determined by perturbing the estimated value of model factors as a function of the data-inferred outbreak velocity and on arrival times. All potential food commodities and outbreak sources are tested considering their likelihood to satisfy the relationship between outbreak arrival times and velocity at any time step of the epidemic and for all infected communities simultaneously.
For our purposes we simplify the problem by replacing the conventional geographic distance with a probabilistically motivated distance defined as ‘’effective distance’’ (Figs. S1,S2). In the context of global, trade-mediated epidemics, we aim to use the effective distance that reliably predicts disease arrival times via epidemiological dynamics. We use the definition of effective distance Dmn from an arbitrary reference node n to another node m in the network as the length of the shortest path from n to m, , where
is the directed length of an ordered path
as the sum of effective lengths along the path. The effective distance can also be formulated as a function of the most probable food trajectories that can be derived from the connectivity matrix P; specifically
. Thus, both average effective distance (dmn) and average shortest path tree responsible of outbreak spreading (Dmn) depend only on the static mobility matrix weighted by the food fluxes (Section 2.4). This implies that, on a spatial scale described by the metacommunity model, the complexity of the spatio-temporal outbreak pattern is largely determined by the structure of the mobility network (in this case of food) and not by the nonlinearities of the pathogen-/food-specific and epidemiological factors. According to the second Newton’s law the arrival time of outbreaks is defined as
This equation states that the effective outbreak distances De can be computed with high fidelity based on outbreak arrival times on and effective spreading speed ve, and that each factor depends on different factors of the dynamical system considered 18 . The epidemiological factors associated with the classical SIR model determine the effective speed, whereas effective distance depends only on the topological features of the static underlying network, i.e., the matrix P. Because, Ta and veff are know and estimated from data (that can be generated in real-time), respectively, it is easy to estimate De of an outbreak considering also the uncertainty in epidemiological dynamics and food trade network. The most likely geographical distance can be assessed after determining the effective distance and considering all potential food trade paths.
The SIR dynamics (Section 2.3) is calibrated on the range of the outbreak velocity and arrival times, and is simulated by maximizing the prediction accuracy of the observed outbreak patterns in terms of cumulative outbreaks. Such accuracy is maximized when the uncertainty about the effective distance from the real outbreak source is minimized, that determines the maximization of the concentricity of outbreak spreading waves (Section 2.2.1).
2.2.1. Most Probable Path: Hidden Geometry Linking Patterns and Processes
The simplest method to determine which food and which outbreak source is the most likely to determine the observed outbreak patterns is to test which feasible candidate source has the lowest variability in terms of mean and variance assessed from Eq. 1.
Thus, for each of the potential candidate outbreak locations, the model computes the effective distance to the subset of nodes with prevalence above a certain threshold, or just simply by looking at different instantiations of the epidemic. On the basis of this set of effective distances (denoted by different outbreak sources), we compute the mean μe(De) and standard deviation σe(De) of the effective distance. As shown by 18 , concentricity of epidemic waves increases with a combined minimization of mean and standard deviation of the estimated effective distance. In other words, such approach minimizes the deviation from the expected relationship arrival times – distance, or velocity-distance, equivalently. It is possible to visualize the dynamics of epidemic spread and concentricity of outbreak waves by plotting outbreak sources at the center of a network where all other nodes are placed around at a radial distance equal to the effective distance. Correct outbreak sources determine cohesively evolving outbreak waves from the center to the last nodes from the beginning to the end of the epidemic.
2.3. Predictive Metacommunity Model
The metacommunity model 26,27 consists in the coupling of a classical susceptible-infected-recovered (SIR) dynamic model with a radiation model 28 of food trade dynamics that determines the interlinked changes in food trade, contaminated food, and population state for all communities considered simultaneously. The infection of individuals occurs only via food that is the vector of contamination. This model has the purpose to define estimates of probabilities representing average and variance dynamics of foodborne outbreaks rather than exact numbers. Contamination of food occurs as a function of combinations of values of environmental triggers, namely temperature and rainfall and such dependency is considered. Assuming that the total food trade in and out of a node is proportional to a proper combination of population sizes for the communities considered (i.e., the radiation model), the metacommunity model in which the SIR dynamics is combined with the food trade dynamics can be written as
where sn = Sn/Nn, jn = In/Nn, and rn = 1 – sn – jn. that is the ration of mean infection and recovery rate. A detailed derivation of such equations is provided in 18 . The mobility parameter γ is the average food trade rate estimated on data, i.e.,
, where
is the total population in the system and
is the total food flux. This yields numerical values in the range γ = 0.0013 – 0.0178 day–1. The matrix P with 0 ≤ Pmn ≤ 1 quantifies the fraction of the food flux with destination m exported from node n, i.e., Pmn =Fmn/Fn, where
. The additional sigmoid function
with gain parameter η >> 0 accounts for the local invasion threshold ε and fluctuation effects for jn < ε. Typical ε and η average values are
and
. The fraction of produced and imported food that is locally consumed (that can be assessed from 25 ) is here governed by the input factor
that is the local invasion threshold dependent on how many individuals eat the contaminated food. In general, it is possible to assume that consumption is proportional to the size of the population of each community. This is one of the motivation for which the radiation model works well in reproducing food trade patterns (Section 2.4). Here to avoid the use of two factors, one for local consumption and another for consumption of contaminated food, we use
as the only factor determining spread of contamination. This means that we just consider the portion of consumed food that is contaminated. Moreover, we consider ε=ε(T,R) as a function of temperature and rainfall. The variability of ε related to environmental variability is found via model fitting using global sensitivity and uncertainty analysis considering the assigned probability distribution.
Global sensitivity and uncertainty analysis (GSUA) is here used to consider uncertainty in the traceback model and to assess the relative importance and interactions of factors – epidemiological and trade network factors (Section 2.3 and 2.5, respectively) – leading to foodborne outbreaks. Interactions of causal factors are typically neglected as well the determination of the causality of such factors. The traceback model is run multiple times according to the Sobol’ scheme (Section S1.2) sampling all model factors along their probability distributions (Fig. S4) estimated from data or assumed as uniform according to a maximum entropy principle.
2.4. Food Trade Network Estimation
Most contaminations occur at production sites or at the end of the supply chain due to socio-environmental factors. For this motivation and because of the unavailable information of the whole food supply chain, we simplify the supply chain with the food trade network that is a coarse representation of the supply chain. Thus, we use a physical-based and data-verified numerical approximation of the food trade with the purpose to detect the backbone of the food supply chain that explains the observed spatio-temporal patterns of outbreaks. The magnitude of a network flux (edge weight) represents the total food (that can be expressed also as the value of the annual agro-food trade expressed in current US dollars) from one country to another represented as nodes. For the food network we use a recently introduced radiation model 28 versus the most classical gravity model 29 that underestimates long-range trades. For this model, the connection probability of the average food mobility flux (hereafter food trade) from community i to j, is
where Hi and Hj is the population of the source and destination community i and j, respectively, and Hij is the total population within a radius centered in i excluding the source and destination populations. The radiation model has been used for approximating the food trade in USA and Mexico in place of the gravity model commonly used by USDA. The average food trade between communities is defined for any food flux incoming in USA as where Fi if the food flux from node i (i.e., an exporting country when considering external fluxes in USA). Yet, food mobility patterns are defined according to a connection matrix in which food leaves a community i for a target community j with a trade rate
.
2.5. Food Trade Network Factors
Food trade network variables are calculated for all potential paths of the food considered responsible for the observed outbreaks. We consider the most relevant food trade network factors as in 14 . The path length, L, is defined as the average length traveled by a selected food commodity. Note that the supply chain length is different than the link length that is length of connected nodes i and j along the trade. The node in-degree, kin, is defined as the number of incoming links to a node. The edge weight (or link weight) of the directed link (i,j) is defined as wij = −ln(Fij/Fmax), where Fmax = max Fij is the largest flux in the network that in this case is the largest amount of food traded. With the use of the logarithmic form the weights are all positive and additive along any potential network path. The edge weight is use to determine the betweenness centrality. Betweenness centrality b is a measure that ranks the importance of the position of a node or an edge in the network with respect to the transport through the whole network. b is usually calculated as the number of shortest paths from all nodes to all others that pass through a node considered. However, here we use a weighted betweenness definition that takes into account the fluxes through edges 30 . For betweenness calculations, the weight of a link is defined as its capacity to transport commodities, and one searches for the highest total weight paths from a node m to a node n within the network. If αmn(i) denotes the number of highest total weight paths from node m to n that are passing through i, and αmn denotes the total number of highest total weight paths running from node m to n, the betweenness centrality of node i is defined as . We refer to 31 and 32 for more specifics about these variables that are commonly used in any complex network.
Results and Discussion
3.1. Outbreak Source Detection
The outbreak source detection model (Sections 2.2,2.3) is run considering all candidate sources and food commodities. The idea is to find the optimal food-network pair that reproduces the observed outbreak patterns with the highest accuracy. The SIR simulation based on the metacommunity model with food trade determined the average value of epidemiological factors for the optimal detection of outbreak sources as: R0 = 1.5, β = 0.285 day–1, γ = 2.8 × 10⁻³ day–1, ε = 10–6 (for cilantro); and R0 = 1.9, β = 0.28 day–1, γ = 2.8 × 10⁻³ day–1, and ε = 10–6 (for salad mix). Such epidemiological factors are the optimal factors for reproducing the observed arrival times of outbreaks in the USA. Figure 1 depicts the correlation between arrival time and effective distance and the distribution of ensemble-normalized pairs [μe(De), σe(De)] for salad mix and cilantro driven outbreaks in 2013. We report the plots at the first week of the epidemic at which the identification of the outbreak source is already accurate. For all instances during the epidemic, the actual outbreak location is well separated from the remaining point cloud and closest to the origin. The variance around the 1:1 line in the arrival time – effective distance plots increases with the error in estimating the distance from the real outbreak source. In an effective distance space it is possible to determine the actual outbreak source by selecting the one that maximizes the concentricity outbreak waves (see Figs. S5,S6). The probability distribution of the distance between the predicted and correct outbreak sources is in Fig. S4. Such probability distribution is related to the variability of epidemiological and trade network factors considered by global sensitivity and uncertainty analyses (Section S1.2). Figure S4 shows how the results of GSUA where the x- and y-axis is the relative importance and interaction of factors determining outbreaks. We observe that supply chain length, in-degree, betweenness centrality, and the average food trade rate are strongly driving outbreaks. The local invasion threshold ε, that is the amount of contaminated food, is a highly interacting factor to consider as well but with lower relative importance. Epidemiological factors a and b are weakly manageable and have lower importance, which means that infection and recovery rate have small effects in decreasing the risk of outbreaks.
The location of the estimated outbreak sources is shown in Fig. 2 with a probability that is related to the Nash-Sutcliffe coefficient (NSC) (Tables 1,2) considering the cumulative cases as the response variable (Section S1.3). The root mean square error (RMSE) is also evaluated for a comprehensive assessment of how the model predicts both average trend and extremes of outbreaks over space and time 33 . We find that RMSE and NCS is minimized and maximized when concentricity of outbreak waves is maximized, respectively. This is statistically true at any step of the epidemic if the correct outbreak epicenter is selected. Other bands of lower probability are associated with other areas in which it is less likely to find the outbreak source. The other plots in Fig. 2 show the incidence and cumulative incidence curves for both outbreak sources. Figure 3 shows the likely environmental triggers of contamination. The average rainfall and temperature within the evidenced areas by the dashed lined can be considered as potentially causally related to the contamination of salad and cilantro with Cyclospora in Puebla and Guanajuato. Assuming that the social determinants of contamination are the same worldwide it is possible to map the risky countries for Cyclospora contamination for which the value of rainfall and temperature is the same as the Mexico outbreak sources. Such potential Cyclospora suitability is assessed in Fig. S7 at the country scale with MaxEnt (Section S1.1) 34 . Such information can be useful at smaller scale for guiding surveillance toward more risky countries.
The identification of socio-environmental variables and their values that lead to contamination is also useful to understand the seasonality of foodborne diseases. This is because the likelihood of contamination is also seasonal considering the socio-environmental dependence of pathogen occurrence. Thus, an outcome of the real application of such cyber-infrastructure is the detection of social and environmental factors associated to contamination that determine pathogen occurrence curves (‘’response curves’’ or ‘’exposure – concentration distributions’’ as in classical risk analysis) as a function of such factors.
In the paper we propose and evaluate explicit tests of the ‘’null hypothesis’’ of no difference in the accuracy of two potential outbreak sources. In such case two (or more) outbreak sources may be feasible and it is very hard to detect which one is correct. It may be that both are correct and contamination occurred in multiple sites simultaneously. Another ‘’null hypothesis’’ was about the no difference in outbreak spreading patterns of two (or more) food commodities, such as salad mix and cilantro. In such case the attribution was going to be difficult considering all potential food commodities. However, in both cases (e.g. multiple outbreak sources and multiple food commodities) the socio-environmental factors can be of utility because these factors may confirm or neglect the hypothesis that one source and/or food is determining contamination.
Ta is arrival time of outbreaks (from data) and De is the estimated effective distance that is related to the static trade network and the epidemiology of outbreaks in terms of arrival time of outbreak fronts. The inset shows the food trade network and the concentric expanding outbreak front in the effective distance representation (see also Fig. S5 and S6). The same simulation exhibits more complex spatio-temporal patterns in the conventional geographic representation. Only the actual outbreak source produces a circular wavefront. Effective distances thus permit the extraction of the correct outbreak source, based on information on the food network and a single (or more) snapshot of the epidemic.
Fig. 1: Arrival time, effective distance and outbreak source detection plots.
Outbreak sources are shown on the right at the minimum resolution of the model. Probability bands are associated to the effective distance calculations. Such probability is related to NSC and RMSE of model accuracy and prediction variability (see Section S1.2). the resolution of simulations is of 15 × 15 minutes of arc (Section 2.1). The predicted number of cases is upscaled to the state scale to produce maps in Figs. 4-6.
Fig. 2: Outbreak source location as main traceback model output.
Table 1. Attribution text related to outbreak source uncertainty. Calculations of outbreak patterns are done for defined commodities by exploring all possible OS; as for the salad mix we considered only that is exactly like the one from MX in composition. The Nash–Sutcliffe coefficient (NSC) and the root mean square error (RMSE) are determined on the cumulated case function. The higher NSC and the lower RMSE, the better the prediction in space and time of outbreaks and outbreak source.
Table 2. Attribution text related to food commodity uncertainty. Calculations of model accuracy and global sensitivity are reported for all food commodity trades that can be attributed to the observed outbreak patterns. This search considered all potential food trades involving the states hit by the outbreak.
The traceback model based on the effective distance is able to untangle which cases are related to cilantro and salad mix separately. This is because some outbreaks are not consistent with each other considering their co-arrival time and velocity as in Eq. 1. The highest incidence for contaminated salad mix from Guanajuato (MX) is predicted in Iowa and Nebraska, while for contaminated cilantro from Puebla (MX) is predicted in Texas (Fig. 4). The epidemiological factors are the same as the one inferred from the traceback analysis (Section 2.3). Epidemiological factors (i.e., mean infection and recovery rate) are quite invariant for the same food-pathogen pairs. Food related factors such as the mean food trade, vary more but the balance of food supply and demand via trade paths has is generally very stable. Figure 4 shows how well the model predicts the observed outbreak considering one and multiple states together. Table 2 shows how the observed outbreaks can be attributed to other food commodities if the information of outbreak is not reported accurately. In the case of cilantro and fresh salad the overlap of co-contaminated cases was very high but only in the space dimension. Considering time, the spreading of salad-related outbreaks was fasted than cilantro-related outbreaks and this is an advantage that decreases the attribution ambiguity. The number of overlapping cases in 2013 were 11 at the end of the epidemic (Texas, Kansas, Nebraska, Iowa, Minnesota, Wisconsin, Illinois, Ohio, Georgia, New Jersey, and Pennsylvania). We emphasize that despite such overlap of outbreaks the proposed algorithm is able to detect the OSs after a week from the onset (Fig. 1). Moreover, we underline that the model is able to disentangle cases related to different food commodities from the overall outbreak (Fig. S3). As a matter of fact, in the summer of 2013 there was a quite extended debate whether the observed Cyclospora outbreaks were related to one of more food commodities. We believe that the availability of our traceback model would have been helpful in that and equivalent circumstances.
We determine that such conditions of rainfall and temperature (environmental niches) in a two week period before the first reported cases are enough for predicting the observed outbreak patterns. Plots of environmental factors over time for salad mix and cilantro are reported in the let and right plot, respectively. Guanajuato at elevation 3,110 m is characterized by higher temperature and lower rainfall than Puebla at 2,135 m.
Fig. 3: Environmental conditions related to high probability of Cyclospora occurrence.
The traceback model detects outbreak sources and by doing so it separates patterns of Cyclospora outbreaks due to cilantro and fresh salad contamination. Outbreaks that are not part of one epidemic wave are part of the other considering the variance-mean minimization criteria of the effective distance. The Nash- Sutcliffe coefficient and the RMSE are listed in Tables 1 and 2.
Fig. 4: Predictions of Cyclospora outbreaks in 2013 after traceback model.
3.3. Prediction of 2013 Outbreaks With Unknown Source and Approximated Trade
A relevant question arises in the hypothetical case of complete uncertainty about outbreak sources. What would be the predicted outbreak pattern without the knowledge of the outbreak source? This may be the case of unsolved outbreaks or predicted outbreaks with the aim of prevention. In this study we also want to show how outbreaks patterns look like in the case of all potential sources of contaminated cilantro and salad mix are considered. Thus, we considered any potential source of cilantro and fresh salad worldwide in which contamination occurs for the same values of environmental features in Mexico generating the 2013 outbreaks.
Cilantro is grown commercially, either at small or large scale, in almost every country in the world, but most of the production is consumed in the local markets. We consider cilantro herb imported from India, Thailand, Vietnam, Bangladesh, China, Yemen, most of Latin America and the Caribbean, and from Mediterranean countries. Mexico is the largest cilantro exporter in the world, producing 42 million kg of cilantro in 5250 ha, with a farm gate value of approximately US$ 13.3 million. Puerto Rico, the Dominican Republic, and California are the other largest producers in the Americas. As for salad mix Canada and Mexico have been the leading sources of lettuce entering the United States. The two countries traded positions as the top country exporting to the United States; however, in 2002 Mexico became the leading supplier. Much of this increase in imports from Mexico is a consequence of increased romaine and leaf lettuce imports. In 2010 the United States imported 146,818 MT of all types of lettuce valued at $134,688 million, with more romaine and leaf lettuce being imported than head lettuce 35 .
Figure 5 reports the predicted outbreak patterns as if all salad and cilantro exporting countries are responsible of the outbreak. These countries are listed in Table 1 considering them separately as the only source of outbreaks with the relative prediction efficiency indicators. The metacommunity model was run with the same epidemiological factors derived fro the 2013 outbreaks, and the IFTN is used to propagate food from such countries to the USA. Figure S7 shows the environmental suitability of Cyclospora for countries with equivalent environmental conditions of MX sources, and salad and/or cilantro agriculture. Predictions give a much larger spread of outbreaks than in 2013 because we consider all potential food commodity trades that reach many other states. These predictions show a 40% increase in prevalence than 2013.
All the possible Oss listed in Table 1 are considered to contribute to the outbreak. Patterns of Cyclospora outbreaks due to cilantro and fresh salad contamination are more extended than the ones observed because these simulations consider all trades contaminated; thus, not only those from Mexico.
Fig. 5: Prediction of Cyclospora outbreaks in 2013 with unknown outbreak source.
3.4. Predictions for Summer 2014
Predictions for the summer 2014 are based on assuming the same outbreak sources for the 2013 outbreaks. This is because at the current stage we have no way to assess the level of ‘’social criticality’’ in environment-driven contamination areas for food. Moreover, for cilantro and salad mix it is likely that trade in the USA from Mexico will continue with no change in local (Mexican) socio-environmental conditions leading to contamination, thus Cyclospora outbreaks are highly likely.
We assume a linear increase in the invasion factor e of food contamination related to rainfall and temperature predictions. This assumption is a defendable assumption considering that Cyclospora occurrence is directly proportional to increase rainfall and temperature that is expected in the summer of 2014. We assume that trades of food commodities in USA will be the same. Such simulation is performed for testing the predictive ability of the model even when information that is available a priori is limited. If proven true such prediction would be extremely useful for food industries and governments in order to design supply chains and surveillance that minimize the risk of foodborne outbreaks leading to food recalls and health burden that bring high economic losses 29,36 .
Figure 6 reports future predictions of Cyclospora outbreaks in the summer of 2014 by keeping invariant – as of 2013 – the trade of cilantro and salad mix from Mexico. We predict an increase in prevalence of 10-20% for Iowa/Nebraska and Texas that are the states for which outbreaks occur mostly due to salad and cilantro, respectively. In particular, we observe a very high peak of incidence of cilantro cases in Texas and of salad mix in other states. It is very noticeable also the wider distribution of outbreaks with respect to 2013, particularly in the West coast states such as California. We think this can be related to underreported and/or unattributed cases in 2013 or to deviations of radiation model estimations from the real food trade.
Patterns of Cyclospora outbreaks due to cilantro and fresh salad contamination are more extended than the ones observed in 2013 considering the longer rainfall-temperature season for which contamination is likely.
Fig. 6: Prediction of Cyclospora outbreaks in 2014 with know outbreak source detected by the traceback model.
Conclusions
We strongly believe in the use of process-based models for the quest of mechanisms behind observed outbreak patterns. Particularly, we emphasize the importance of leveraging uncertainty as a way to decrease the ambiguity in the detection of close outbreak sources even with spatial and temporal overlap of events and unknown food supply chain paths. Uncertainty in epidemiological and trade factors allows stakeholders to explore system states by leveraging other causally related variables, such as population, and distance-velocity relationships in disease spreading. Thus, models allow one to identify states (e.g., in terms of trade leading to observed outbreak patterns) closest to the observed reality and future states via alteration of trades, for instance. This has a profound importance for management. Values of model input factors that better allow us to reproduce observed outbreaks are likely the closest to real values of the processes investigated. We show that the reduction in uncertainty via global sensitivity and uncertainty analyses translates into rapidity of outbreak source detection. However, we note that in real practice this rapidity can be achieved only with an efficiently coordinated surveillance system and possibly with a better knowledge of the food supply chain. Thus, firstly we emphasize the need of a homogeneously reliable source of information about outbreak cases at fine scales (e.g. county scales) and secondly the need of a more systemic real-time information of the food supply chain for food safety and defense in the interest of population and industry. Further efforts for capturing long food trade dynamics will couple epidemiological and dynamic food supply-demand balance models driven by social and environmental triggers that determine seasonal trade, consumption, and contamination events. The potential evaluation of different design alternative of the food system as a function of climate change and land use shifts is a relevant topic also in consideration of food safety and defense.
Our demonstration of this model in the context of a multistate outbreak of Cyclopsora infections associated with contaminated fresh produce highlights the potential usefulness of the model to improve the timeliness and effectiveness of outbreak detection and response. Our specific prediction for 2014 strongly emphasizes the need for real-time surveillance to identify and respond to this pending outbreak.
Acknowledgements
The National Center for Food Protection and Defense is kindly acknowledged for the useful feedbacks about the paper.Appendix 1
S1. Supplementary Methods
S1.1. Zoning Contamination-prone Areas: MaxEnt Suitability of Pathogen Occurrence
In this paper we assume that the set of rainfall and temperature in Puebla and Guanajuato immediately before the observed outbreaks determines pathogen occurrence. We limit the range of variability of rainfall and temperature to period in between mid May and mid June. Considering the natural variability of such environmental factors in this period we determine their average value for which food in contaminated and determining the observed outbreaks in USA via global sensitivity and uncertainty analyses (GSUA). This is certainly a simplification because contamination is also driven by other social factors, such as agricultural practices. However, the purpose of the paper is to offer a model for rapidly detecting outbreak sources and mapping critical areas leading to food contamination. Thus, the goal of this paper is to limit the attention on the environmental drivers useful to explain contamination. Before a complete and reliable mapping can be finalized, a comprehensive assessment of social and environmental factors leading to all observed foodborne outbreaks is required. Taking the set of rainfall and temperature leading to contamination of cilantro and fresh produce maps of Cyclospora suitability are assessed (Fig. S7).
We used MaxEnt (Phillips et al., 2006) as the probabilistic inferential model to identify cilantro and salad mix areas suitable for contamination. MaxEnt is calculating the suitability for countries with the same range and fluctuation in environmental conditions of MX sources and cultivations of salad and cilantro. Cyclosporiasis shows seasonality, but the pattern of seasonality varies by location. Regardless of the seasonality the occurrence of the pathogen is thought to depend on temperature, and rainfall-dependent humidity that can affect survival of the pathogen or make sporulation easier. We show that Cyclospora occurrence and infection is most common in tropical and sub-tropical countries and more common in developing countries than developed ones. Symptomatic infection is most common in travelers to endemic areas (also referred to as ‘’traveler’s diarrhea’’), but there have been outbreaks among non-travelers in the US related to food imported from such tropical areas. Cyclospora cayetanensis is endemic in Peru, Brazil, Haiti, and Nepal as our calculations on Cyclospora distribution at the country scale show.
S1.2. Global Sensitivity and Uncertainty Analyses
GSUA involves five steps: (1) the probability distribution functions (pdfs) for each input factor are selected (Table 1); (2) sample points are generated on the input factor distributions using the Sobol’ method; (3) multiple model execution using each of the sample points and a set of outputs is generated; (4) global sensitivity analysis is performed (i.e., assessment of factor interaction and importance); and, (5) the important input factors are selected. Such approach is extremely important in complex systems that are dominated by factor interactions rather than an additive contribution of each single factor. In fact, classical sensitivity analysis fails to account for factor interactions and does not offer a full probabilistic investigation of system states; yet, classical one factor sensitivity analysis provides misleading conclusions.
The Sobol’ method (Sobol’, 1993) is a variance-based method that performs a quantitative analysis of model sensitivity based on the principle of variance decomposition. According to this principle the full variance of the model output is given by the sum of the variances of all input factors (Saltelli et al., 2008). The Sobol’ method has the capacity to quantify the influence of the full range of variation of each input factor as well as the interaction effects among the input factors on the model output (Saltelli et al., 2008). The Sobol’ method estimates sensitivity measures which summarize the model’s behavior. The most common measure of sensitivity is the first-order sensitivity index, S, that represents the main effect (direct contribution) of each input factor to the variance of the output. It is expressed as Si = Vi/V where Vi is the part of the variance due to the input factor Xi, and V is the total variance of the model output. Another measure of sensitivity is the total factor sensitivity that includes the interactions. The total effect index, STi, that is the result of the variance decomposition, accounts for the total contribution to the output variation due to factor Xi, i.e., its first-order effect plus all the higher order effects due to interactions (Saltelli et al., 2008). Thus, the total effect index of factor Xi can be expressed as STi = Si + Si,i+1 + Si,i+1,i+2 + Si,i+1,i+2,i+3 + Si,i+1,i+2,i+3+...+NIF = Si + SIi, where NIF is the number of input factors and SIi is the sum of all the interaction indexes. The Sobol’ pairwise interaction between factors can be calculated and we identify this with the notation SIij where i and j are the factors that are considered. As an example, in the case of three input factors ST1is the total sensitivity index of X1, S1 is the main effect of X1, SI12is the interaction effect between X1 and X2, and SI123 is the interaction effect between X1, X2, and X3. Considering the previous expression, ST1 − S1 provides a measure of how much X1 is involved in interactions with all other input factors (Saltelli et al., 2008). The sum of all Si is equal to one for additive models and less than one for non-additive models. The difference 1−Si can be used as an indicator of the presence of interactions in the model (Saltelli et al., 2008) and we indicate that as SI. The number of simulations required for the Sobol’ method for a two-index analysis (i.e., for first order and total indices) is given as N = M (2k + 2) where M is the sample size of each index (typically taken between 500-1000) and k is the number of uncertain input factors after the Morris screening. In this study because k = 8, and we take M = 600 we have 10,800 Sobol’ simulations. Since the Sobol’ method uses a pseudo-randomized multivariate sampling procedure, it can be used as a basis for a global uncertainty evaluation by constructing the pdfs and cumulative distribution functions (cdfs) for each of the selected outputs.
S1.3. Statistical Tests for Predictive Accuracy
The global time course of an epidemic is typically quantified by the global prevalence curve that is the response variable being modeled. Such prevalence is defined as the fraction of infected as a function of time
A characteristic of the time course of C(t) is a strong dependence on size and regional coordinates of the corresponding outbreak source. Each prevalence curve can be characterized by the epidemic duration Td defined as the point in time when C(t) crosses a minimum threshold from above (i.e. after an epidemic has waned), the peak of infected Cmax = max(C(t)) and the peak time Tp defined as the point in time where C(Tp) = Cmax. Fig. S3 shows that these quantities depend on the specific choice of outbreak source. To assess this variability quantitatively, we ran simulations for all possible outbreak sources and measured global characteristics.
Predicting accurately the outbreak source is conditio sine qua non the prediction of the global prevalence cannot be accurate. The prediction of global prevalence is validated considering two statistics. A combination of absolute value error statistics, i.e. root mean square error (RMSE), and normalized goodness-of-fit statistics, i.e. Nash–Sutcliffe efficiency Coefficient (NSC) (Nash and Sutcliffe, 1970) is recommended for testing predictions (Ritter and Munoz-Carpena, 2013). For quantifying the prediction error in terms of the units of the variable calculated by the model, RMSE is selected. This indicator is given by
where Ct and C*t represent the sample (of size N over time, where t are the time steps at which the cumulative cases are analyzed) containing the observations and the model estimates, respectively. Eq. S1 is representing the cumulated cases in a general way regardless they are observed or predicted. RMSE ranges from 0 to ∞, where RMSE= 0 indicates a perfect fit. As a dimensionless goodness-of-fit indicator, NSC is selected. This is calculated as follows:
References
Nash JE, J.V. Sutcliffe (1970) River flow forecasting through conceptual models, part I: a discussion of principles, J. Hydrol., 10, pp. 282–290 http://dx.doi.org/10.1016/0022-1694(70)90255-6
Phillips S, R. Anderson, and R. Schapire (2006) Maximum entropy modeling of species geographic distributions. Ecological Modelling, 190(3-4):231–259, 10.1016/j.ecolmodel.2005.03.026
Ritter A, Muñoz-Carpena R (2013) Performance evaluation of hydrological models: Statistical significance for reducing subjectivity in goodness-of-fit assessments. Journal of Hydrology 480: 33–45 doi: 10.1016/j.jhydrol.2012.12.004
Saltelli, A., M. Ratto, T. Andres, F. Campolongo, J. Cariboni, D. Gatelli, M. Saisana, and S. Tarantola, Global Sensitivity Analysis. The Primer, John Wiley and Sons, 2008
Sobol’, I., Sensitivity estimates for non-linear mathematical models, Math. Modell. Comput. Exp., 1(4), 407 – 414, 1993
Supplementary Figures
On the background the 2013 Cyclospora outbreak pattern is represented with the number of cases for each state. A coarse grained version of the food trade network calculated with the radiation model is shown for the USA in red. The effective and geographical distances, related to the observed Cyclospora outbreaks and cilantro trade, are reported in blue and red. The calculation of effective distance is based on arrival time and velocity of outbreaks. Outbreak locations in USA can be assigned to different outbreak sources according to their level of coherence considering Eq. (1).
Fig. 1: Fig s1. Representation of the conceptual framework of the traceback model.
The effective distance visualization is based on data and Eq. 1. The simulation in the geographical domain is shown for cilantro. Metacomunity model simulations (Eq. (2)) are run considering the most probable trade network in the geographical domain starting from Puebla (MX); the resolution of simulations is of 15 × 15 minutes of arc (Section 2.1). The predicted number of cases is upscaled to the state scale to produce maps in Figs. 4-6.
Fig. 2: Fig s2. Simulations of 2013 Cyclospora outbreaks in the effective distance and geographical domains.
Data are from the Center for Disease Control and Prevention (CDC, 2013). Co-incidence of cases is very high since the beginning of the outbreak in US. This determined a fierce debate about outbreak-food attribution. However, combining spatial and temporal information it appears quite evident to detect two epidemic waves in whichDsm/ vsm> Dc/ vcwheresmis salad mix and c is cilantro. Thus, two outbreak sources in Guanajuato and Puebla are detected.
Fig. 3: Fig S3. 2013 Cyclospora outbreak patterns over time.
The dots in red and blue are epidemiological and trade network factors, respectively. Probability distributions of trade network factors are derived from observation on real data (Convertino and Song, 2014). Epidemiological factors (a, and b) and consumption factors (s an e) are assumed to be normally distributed. The in-degree and the betweenness centrality are exponentially distributed in a normalized range [0,1], and the network length is power-law distributed in a range [102;105] km. g is related to the range of variability of the total food flux [100, 1010] x 103 (in US dollars).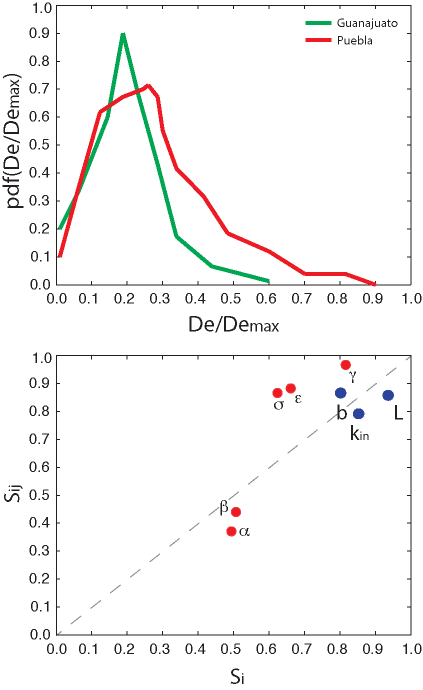
Fig. 4: Fig S4. Predicted effective distance and GSUA results.
Salad mix and cilantro outbreak evolution over time (from week 1 in June to the peak of the outbreak in mid July) is on the top and bottom plots, respectively. Only the actual outbreak source (OS) produces a circular wavefront as shown by these plots (Fig. S5). We observe that Dsm / vsm > Dc / vcwheresmis salad mix and c is cilantro; this is verified for any community in which an outbreak occurs, on average.
Fig. 5: Fig S5. Outbreak patterns in the effective space.
Red nodes are for communities where at least one case is reported. For candidates OSs that are not the correct outbreaks, wavefronts are not nearly as concentric. Effective distances thus permit the extraction of the correct OS, based on information on the mobility network (in this case of food) and a single informative snapshot of the epidemic dynamics. The underlying tree is the shortest path tree that reflects the most probable pathway of a contagion process proliferating through the net- work. Each symbol in the diagram represents one of the airports in the network.
Fig. 6: Fig S6. Example of correct outbreak source identification.
References
- Hoorfar J, K Jordan, F Butler, R Prugger, Food Chain Integrity: A Holistic Approach to Food Traceability, Safety, Quality and Authenticity, 2011, Woodhead Publishing Series in Food Science, Technology and Nutrition
- Morse SS, Mazet JAK, Woolhouse M, et al., Prediction and prevention of the next pandemic zoonosis. 2012. Lancet; 380: 1956–65
- Kennedy, S., Emerging Global Food System Risks and Potential Solutions, in Improving Import Food Safety (eds W. Ellefson, L. Zach and D. Sullivan), 2012, John Wiley & Sons, Inc, Hoboken, NJ, USA. doi: 10.1002/9781118464298.ch1
- Kennedy, S., Busta F., Biosecurity: Food Protection and Defense. Food Microbiology: Fundamentals and Frontiers, 4th Ed. (eds M.P. Doyle and R.L. Buchanan), 2013, ASM Press, Washington, D.C., USA. doi: 10.1128/9781555818463.ch5
- Meyer, Stephanie D.; Smith, Kirk E.; Hedberg, Craig, Surveillance for foodborne diseases PART 2: Investigation of foodborne disease outbreaks, Edited by: Mikanatha, NM; Lynfield, R; VanBeneden, CA; et al., 2013, Infectious Disease Surveillance, 2nd Edition Pages: 120-128
- CDC, CDC Cyclospora investigation, 2013
Reference Link - Sanchez-Vega, JT; Cabrera-Fuentes, HA; Romero-Olmedo, AJ; Ortiz-Frias, JL; Sokolina, F; Barreto, G, Case Report: Cyclospora cayetanensis: This Emerging Protozoan Pathogen in Mexico, 2014, AMERICAN JOURNAL OF TROPICAL MEDICINE AND HYGIENE, Volume: 90 Issue: 2 Pages: 351-353, 10.4269/ajtmh.12-0782
- Ho, A. Y., Lopez, A. S., Eberhart, M. G., Levenson, R., Finkel, B. S., da Silva, A. J., Roberts, J. M., Orlandi, P. A., Johnson, C. C. & Herwaldt, B. L. Outbreak of cyclosporiasis associated with imported raspberries, Philadelphia, Pennsylvania, 2002. Emerg. Infect. Dis. 8, 783 – 788
- Yi Shan Gong; Tao Long, Application of Bayesian Network in the Traceback of Cyber Attack, 2010, Computational Intelligence and Software Engineering (CiSE), vol., no., pp.1,3, 10-12, doi: 10.1109/CISE.2010.5676903
- Xiang Y; Ke Li; Wanlei Zhou, Low-Rate DDoS Attacks Detection and Traceback by Using New Information Metrics, 2011, Information Forensics and Security, IEEE Transactions, vol.6, no.2, pp.426,437, doi: 10.1109/TIFS.2011.2107320
- Bui-Klimke TR, Guclu H, Kensler TW, Yuan J-M, Wu F. Aflatoxin Regulations and Global Pistachio Trade: Insights from a Social Network Analysis, 2014, PLoS ONE, in press
- Wu F, Guclu H. Aflatoxin regulations in a network of global maize trade. 2012. PLoS ONE 7(9):e45141, doi:10.1371/journal.pone.004515
- Wu F, Guclu H. Global maize trade and food security: Implications from a social network model. 2013. Risk Analysis 33:2168-78
- Convertino M, Liang S, Probabilistic Supply Chain Risk Model for Food Safety, 2014, GRF Davos Planet@Risk, Volume 2, Number 3, Special Issue on One Health
- den Broeck WV, Gioannini C, Gonçalves B, Quaggiotto M, Colizza V, et al. The GLEaMviz computational tool, a publicly available software to explore realistic epidemic spreading scenarios at the global scale. 2011. BMC Infect Dis 11: 37
- Vespignani, A. Modeling dynamical processes in complex socio-technical systems. 2012. Nature Physics 8, 32–30
- Helbing, Dirk and Brockmann, Dirk and Chadefaux, Thomas and Donnay, Karsten and Blanke, Ulf and Woolley-Meza, Olivia and Moussaid, Mehdi and Johansson, Anders and Krause, Jens and Schutte, Sebastian and Perc, Matjaz, How to Save Human Lives with Complexity Science, 2014, SSRN, http://dx.doi.org/10.2139/ssrn.2390049
Reference Link - Brockmann D, Helbing D. The hidden geometry of complex, network-driven contagion phenomena. 2013. Science, 342:1337-1342. doi:10.1126/science.1245200
- Saltelli, A., M. Ratto, T. Andres, F. Campolongo, J. Cariboni, D. Gatelli, M. Saisana, and S. Tarantola, 2008, Global Sensitivity Analysis. The Primer, John Wiley and Sons
- Convertino, M., R. Muñoz-Carpena, Chu-Agor, ML, G. Kiker and I. Linkov, Untangling model drivers of species distribution predictions: Global Sensitivity and Uncertainty Analysis of MaxEnt. 2013. Env. Model. & Software. Ref. No.: ENVSOFT-D-12-00221
- Lazer D, Kennedy R, King G, Vespignani A, Lazer D1, Kennedy R, King G, Vespignani A The parable of google flu: traps in big data analysis. 2014. Science, 343(6176):1203-1205. doi:10.1126/science.1248506
- ComTrade (2014) Website. Date of access: 02/01/2014
Reference Link - GATS, Usda foreign agricultural service’s global agricultural trade system. Technical Report, 2014, United State Department of Agriculture. Date of access: 02/01/2014
Reference Link - AMS, Agricultural Marketing Service, 2014, Available: http://comtrade.un.org/db/. Date of access: 03/01/2014
Reference Link - FAOSTAT Food Balance Sheet Website of the Food and Agriculture Organization of the United Nations. 2014. 30. Date of access: 02/01/2014
Reference Link - Convertino, M., R. Muneepeerakul, S. Azaele, E. Bertuzzo, A. Rinaldo, and I. Rodriguez-Iturbe. On neutral metacommunity patterns of river basins at different scales of aggregation. 2009. Water Resources Research 45:W08424
- Convertino M. Neutral metacommunity clustering and SAR: River basin vs. 2-D landscape biodiversity patterns. 2011. Ecological Modeling 222, 1863-1879
- Simini F, González AMM, Barábasi AL A universal model for mobility and migration patterns. 2012. Nature
- Philippidis G., Resano-Ezcaray H. and Sanjuán-López A.I. . Capturing zero-trade values in gravity equations of trade: an analysis of protectionism in agro-food sectors. 2013. Agricultural Economics 44, 141-159
- Ercsey-Ravasz, M., Toroczkai, Z., Lakner, Z., and Baranyi, J. Complexity of the international agro-food trade network and its impact on food safety. 2012. PLoS ONE 7(5), e37810
- Réka A; Barabási, Albert-László. "Statistical mechanics of complex networks". Reviews of Modern Physics 74: 47–97. arXiv:cond-mat/0106096. 2002 Bibcode:2002RvMP...74...47A. doi:10.1103/RevModPhys.74.47
- Newman M. E. J.. "The structure and function of complex networks". 2003. SIAM Review 45 (2): 167–256. arXiv:cond-mat/0303516. Bibcode:2003SIAMR..45..167N. doi:10.1137/S003614450342480
- Ritter A, Muñoz-Carpena R. Performance evaluation of hydrological models: Statistical significance for reducing subjectivity in goodness-of-fit assessments. 2013. Journal of Hydrology 480: 33–45 doi: 10.1016/j.jhydrol.2012.12.004
- Phillips S, R. Anderson, and R. Schapire. Maximum entropy modeling of species geographic distributions. 2006. Ecological Modelling, 190(3-4):231–259, 10.1016/j.ecolmodel.2005.03.026
- FAS, (2014) Foreign Agricultural Service, USDA, Date of access: 02/01/2014
Reference Link - Olper, A., Pacca, L. and Curzi, D. Trade, Import Competition and Productivity Growth in the Food Industry. 2013. Paper Presented at the IATRC Symposium, Seville, Spain, 2-4 June 2013
Leave a Comment
You must be logged in to post a comment.