Abstract
Our knowledge of the avian tree of life remains uncertain, particularly at deeper levels due to the rapid diversification early in their evolutionary history. They are the most abundant land vertebrate on the planet and have been of great historical interest to systematists. Birds are also economically and ecologically important and as a result are intensively studied, yet despite their importance and interest to humans around 13% of taxa currently on the endangered species list perhaps as a result of human activity. Despite all this no comprehensive phylogeny that includes both extinct and extant species currently exists. Here we present a species-level supertree, constructed using the Matrix Representation with Parsimony method, of Aves containing approximately two thirds of all species from nearly 1000 source phylogenies with a broad taxonomic coverage. The source data for the tree were collected and processed according to a strict protocol to ensure robust and accurate data handling. The resulting tree topology is largely consistent with molecular hypotheses of avian phylogeny. We identify areas that are in broad agreement with current views on avian systematics and also those that require further work. We also highlight the need for leaf-based support measures to enable the identification of rogue taxa in supertrees. This is a first attempt at a supertree of both extinct and extant birds, it is not intended to be utilised in an overhaul of avian systematics or as a basis for taxonomic re-classification but provides a strong basis on which to base further studies on macroevolution, conservation, biodiversity, comparative biology and character evolution, in particular the inclusion of fossils will allow the study of bird evolution and diversification throughout deep time.
Funding Statement
KED was supported by NERC studentship: NER/S/A/2003/11241.Introduction
The class Aves contains an estimated 10,000 extant species1 occupying almost every geographical location, from ocean to desert. They originated within theropod dinosaurs during the Jurassic period2, with the earliest recognised stem group bird being the iconic Archaeopteryx lithographica, of which a number of 150 million year old fossils have been discovered in the famous Solnhofen lagerstätte of Germany. Regular new discoveries, particularly from the vertebrate rich Cretaceous deposits of China, continue to improve our understanding of the earliest birds3,4,5. Modern birds experienced a rapid radiation early in their evolutionary history, though the timing of this is contentious6, resulting in the remarkable diversity that we see today. This rapid radiation of deeper branches is, however, the main confounding factor in our attempts to find the “true” avian tree of life.
Birds are of great interest in a range of fields such as comparative biology, conservation and macroevolutionary studies. They are an economically important group, providing food for humans, as well as fertilizer, and some species are kept as pets. Yet human activity may be partly to blame for the 1,313 species currently on the IUCN Red List of threatened species7; there is a real risk of extinction to many bird species and much effort is being directed towards issues in conservation. Phylogenies are an important tool in conservation, as highlighted by Nee and May8, and allow testing of hypothetical extinction models to assess the loss of “phylogenetic diversity”. Large, well-resolved phylogenies are also vital when attempting to answering important macroevolutionary and macroecological questions yet surprisingly few attempts have been made to reconstruct the phylogeny of all birds and no comprehensive tree including fossil taxa has yet been published though it is well-known that the exclusion/inclusion of fossil taxa can have implications on the resulting phylogenetic tree. Many previous comparative studies have been based on Sibley and Ahlquist’s “tapestry”9, constructed using the much-criticised technique of DNA-hybridisation. Although a massive achievement at the time, this phylogeny contained just 1083 taxa, around a quarter of all birds, with most taxa at genus-level. A number of comparative studies using birds have been based on the tapestry of Sibley and Ahlquist; these include the tempo and mode of bird evolution10, the effect of generation time on rates of avian molecular evolution11, the evolution of avian mating systems and the association between mating systems and pair-bond length12. The dependence of these comparative analyses on the tapestry is troubling as there are concerns about the validity of the method used13,14,15. Although there have been more recent attempts at an inclusive bird phylogeny based on large molecular data sets these are still largely incomplete16. A recent large phylogeny of birds17 contains 9993 taxa but the use of the results of previous studies as a backbone is potentially problematic. In addition, approximately one third of the taxa were added manually post priori. These recent attempts were based on molecular loci and therefore, by definition, excluded extinct taxa. The inclusion of fossils is vital for macroevolutionary studies and investigations into the origins of modern birds.
There are two approaches used for creating large phylogenies. One is the supermatrix or “total evidence” method18,19,20. Here, all characters and taxa make up a single large matrix. A major drawback of this approach is that some types of data cannot be combined (e.g. immunological distance data and DNA-hybridisation data) and that combination of these data types introduces subjective decisions and is vastly time consuming. There is also the potential for a large amount of missing data when combining information in this way21. Bird systematists have employed hard and soft body morphology, behaviour, allozymes, nucleotide sequences, and DNA-hybridisation to elucidate avian phylogeny. Consequently, a supermatrix approach would a priori eliminate many of these data sources. Supertree methods offer a practicable approach to synthesising large numbers of smaller overlapping phylogenies. These “source trees” are built with primary data (e.g., character sets obtained from morphological features or from gene sequencing) or and can be constructed using any method and contain any number of taxa. Many supertree methods also allow conflict between source trees. Therefore supertrees give the widest possible view of phylogeny, both in terms of taxonomic coverage and the types of data incorporated. There are some well-documented issues in using supertree methods to construct large phylogenies, such as data quality and the reliance upon secondary rather than primary information22,23. We attempt to minimise these issues where possible by the use of a strict and robust data processing protocol22,24. Whilst this will not eliminate all possible issues, it allows the construction of an inclusive and large phylogeny. In the future combining supertree and supermatrix methods to complement each other is a potential solution to resolve some of the pitfalls of each method25.
Supertrees have now been produced for many groups of taxa including dinosaurs26, tetrapods27,28, grasses29, mammals30 and crocodiles31. Supertrees have also been produced for avian subsets such as the tube-nose seabirds32, shorebirds33, oscine songbirds34, the fowls35, and a 980 taxon supertree across all extant orders36 but no comprehensive supertree has yet been constructed for all of Aves. Our aim is to combine data from all sources, including both fossil and extant taxa, to create an inclusive phylogeny of birds that will help elucidate their origins and aid conservationists in concentrating their efforts in preserving so-called “biodiversity hotspots”.
Methods
Source tree collection
Potential source trees were identified initially from online resources. The Web of Knowledge Science Citation Index (http://wok.mimas.ac.uk) was searched using the search terms: phylog*, taxonom*, systematic* and clad* in conjunction with all scientific and common names of birds from order to family level. These searches were carried out from the year 1976 up to 2009. This is a significant update – an additional two year’s worth of data (118 published papers) – compared to the tree of Davis24. See conclusions for further comments on the scope, and limitations, of our search. Following the initial search all papers potentially containing phylogenetic trees were examined. In addition, the reference lists of these papers were checked to obtain any further potential source trees. All source trees, along with associated meta-data, were recorded in their original form exactly as they appeared in the source references. Meta-data includes information about source trees such as bibliographic details, characters used (molecular, morphological, behavioural etc.), methods used for tree building, and the taxa included in the analysis. These data were stored in XML file format while the trees were recorded using TreeView37. At this stage no corrections were made for synonyms or any other apparent errors or inconsistencies in the source trees.
Data quality is a big challenge in supertree construction22,23 therefore a strict protocol for data processing was implemented based on that first described by Bininda-Emonds et al.22 . This protocol was followed with some modifications24 and implemented using the Supertree Tool Kit (STK) software38. Source trees needed to meet several criteria for inclusion in the analysis: 1) it should be explicit that the author’s intention was to construct a phylogeny, 2) the characters and taxa used in the analysis must be clearly identifiable and 3) the tree should be based on an analysis of a novel, independent dataset. We defined non-independence as two or more studies that use the same character data and have identical taxa or two or more studies that use the same character data and where one taxa set is a subset of the other. In the case where one was a subset of the other the less comprehensive tree was removed from the dataset. Where this was not possible trees were combined to create a single tree for inclusion in the supertree analysis. Identification of potentially redundant data was automated through use of the STK software. Despite our first criterion we included a taxonomic backbone or “seed tree” as a source tree as studies have shown that the inclusion of a large taxonomically complete greatly improves the performance of supertree methods39. This approach is far more conservative than placing constraints on the dataset; the poorly resolved taxonomy tree acts only to improve overlap and will not over-ride stronger signals within the dataset. We created a very conservative tree, only including taxa that could be unambiguously assigned at order level, compiled using Howard and Moore Catalogue of Birds of the World40. Orders that are in a state of flux were either excluded entirely, (e.g., the “Bucconiformes”) or in other cases the core members of the order were included but taxa whose membership of that order is uncertain were excluded (e.g., the Pelecaniformes). Fossil taxa were added to the backbone tree using the Paleobiology Database (paleodb.org) as a guide.
Nomenclature and taxonomic consistency
OTUs (operational taxonomic units) were standardised to avoid the inclusion of higher taxa and vernacular names that would artificially inflate the number of taxa in the analysis and synonyms and misspellings that could lead to inconsistencies. Names were standardised according to Howard and Moore40, chosen for its conservative approach. Paraphyletic taxa were dealt with using the STK38, which calculates all possible positions of paraphyletic taxa in a source tree. Once all the possible, non-identical, permutations have been calculated, a mini-supertree can be created from them. Higher taxa and vernacular names were removed from source trees by substituting the constituent taxa in a polytomy. Where possible the actual species that the authors intended to represent were used. Where this was not indicated in the source reference all taxa that make up the higher taxa or vernacular name were used but only those that were already present in the dataset to avoid artificial inflation of the number of taxa. Definitions for higher taxa were also according to Howard and Moore. Some substitutions were necessarily very large, for example, a number of source trees contained the taxon “Neornithes” which requires the substitution of virtually every taxon contained within the supertree. The STK contains a tool that enables these to be substituted automatically using a text file containing a user-defined list of substitutions. This substitution stage should not introduce taxa that are not already contained within the dataset, the STK deals with this by checking the presence/absence of substituted taxa by checking the substitution file that is to be used against the source data and indicates any potential problem taxa. The final step for taxonomic/nomenclatural standardisation is the replacement of generic taxa to specific, again in the form of a polytomy containing all taxa of a given genus with the caveat that they are already present in the dataset. Once nomenclature had been standardised it was possible to check that the source trees have sufficient taxonomic overlap, we required each source tree to have least two taxa in common with at least one other source tree21. After all data processing had been completed checks were carried out to ensure that no errors had been introduced during data processing. Again this was implemented using the STK which checks the tree files against the meta-data held about the source trees. This guards against both software and human errors. After these final checks the dataset contained 6326 taxa from 1036 source trees. See additional file 141 for a list of papers containing the source trees and additional file 241 for a Nexus file containing all source trees.
Supertree construction
The most commonly used supertree method is Matrix Representation with Parsimony (MRP)42. Although more supertree methods have become available over the last few years, many of with them software implementation (e.g., SuperFine43, Matrix Representation with Compatibility44, Minimum Flip45, Modified MinCut46), they tend to be slow and unable to deal with large datasets within a reasonable time frame. We chose to use MRP for this analysis as it is still the only supertree construction method able to deal with a dataset of this size. In matrix-based supertree methods all taxa subtended by a given node in a source tree are scored as “1”, taxa not subtended from that node are scored as “0”, taxa not present in that source tree are scored as “?”. Trees are rooted with a hypothetical, all-zero outgroup47. We used standard Baum and Ragan MRP coding42 and the matrix creation was automated using the STK software38. See additional file 341 for the matrix in TNT format.
The matrix was analysed with TNT48 using the “xmult level=10” option, an aggressive search strategy devised to find the shortest trees in as little time as possible. The analysis was run on the Imperial College supercomputer CX1. We ran the analysis on 100 cores for 144 hours, which is equivalent to over two years of computational time on a single core. Each core ran an independent analysis, using a different random starting point for the heuristic search. In this way as much of the phylo-space as possible can be covered in as short a time as possible.
Support values were not calculated for the supertree. An attempt was made to calculate QS values49 for the tree, however CX1 ran out of memory after five days and was unable to complete the analysis. The calculation of V values50 faced similar computational limitations. Traditional support measures such as bootstrap and jack-knifing are of debatable relevance to supertrees51 and would face the same computational limitations.
Results
The analysis found nine MPTs of length 28834 (additional file 441 ). Some areas of the tree were poorly resolved with some odd taxon placement, on closer inspection many of these taxa were observed to be those that are poorly constrained within the source trees or poorly represented within the dataset (see discussion) therefore we calculated an agreement subtree. We were unable to calculate a Maximum Agreement Subtree in PAUP* 4.0b1052 due to memory limitations so we used the Approximate Agreement Subtree function in TNT48. This function uses a heuristic that accurately obtains an agreement subtree but does not guarantee to find the one with the greatest number of taxa (i.e. the MAST). The agreement subtree contained 5380 taxa and the resolution was greatly improved. Figure 1 shows the whole supertree with higher taxa indicated. This figure gives an indication of the size of the tree and the relative sizes of clades. For a simplified order-level tree see Figure 2. For an electronic version in which the whole tree can be viewed in detail see additional file 541
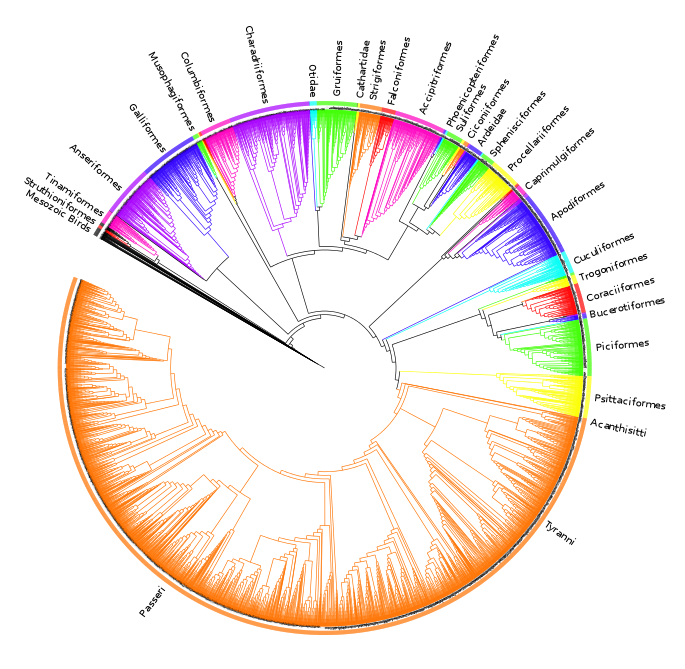
Fig. 1: Agreement subtree calculated for nine MPTs of length nine MPTs of length 28834.
Silhouettes are from http://phylopic.org.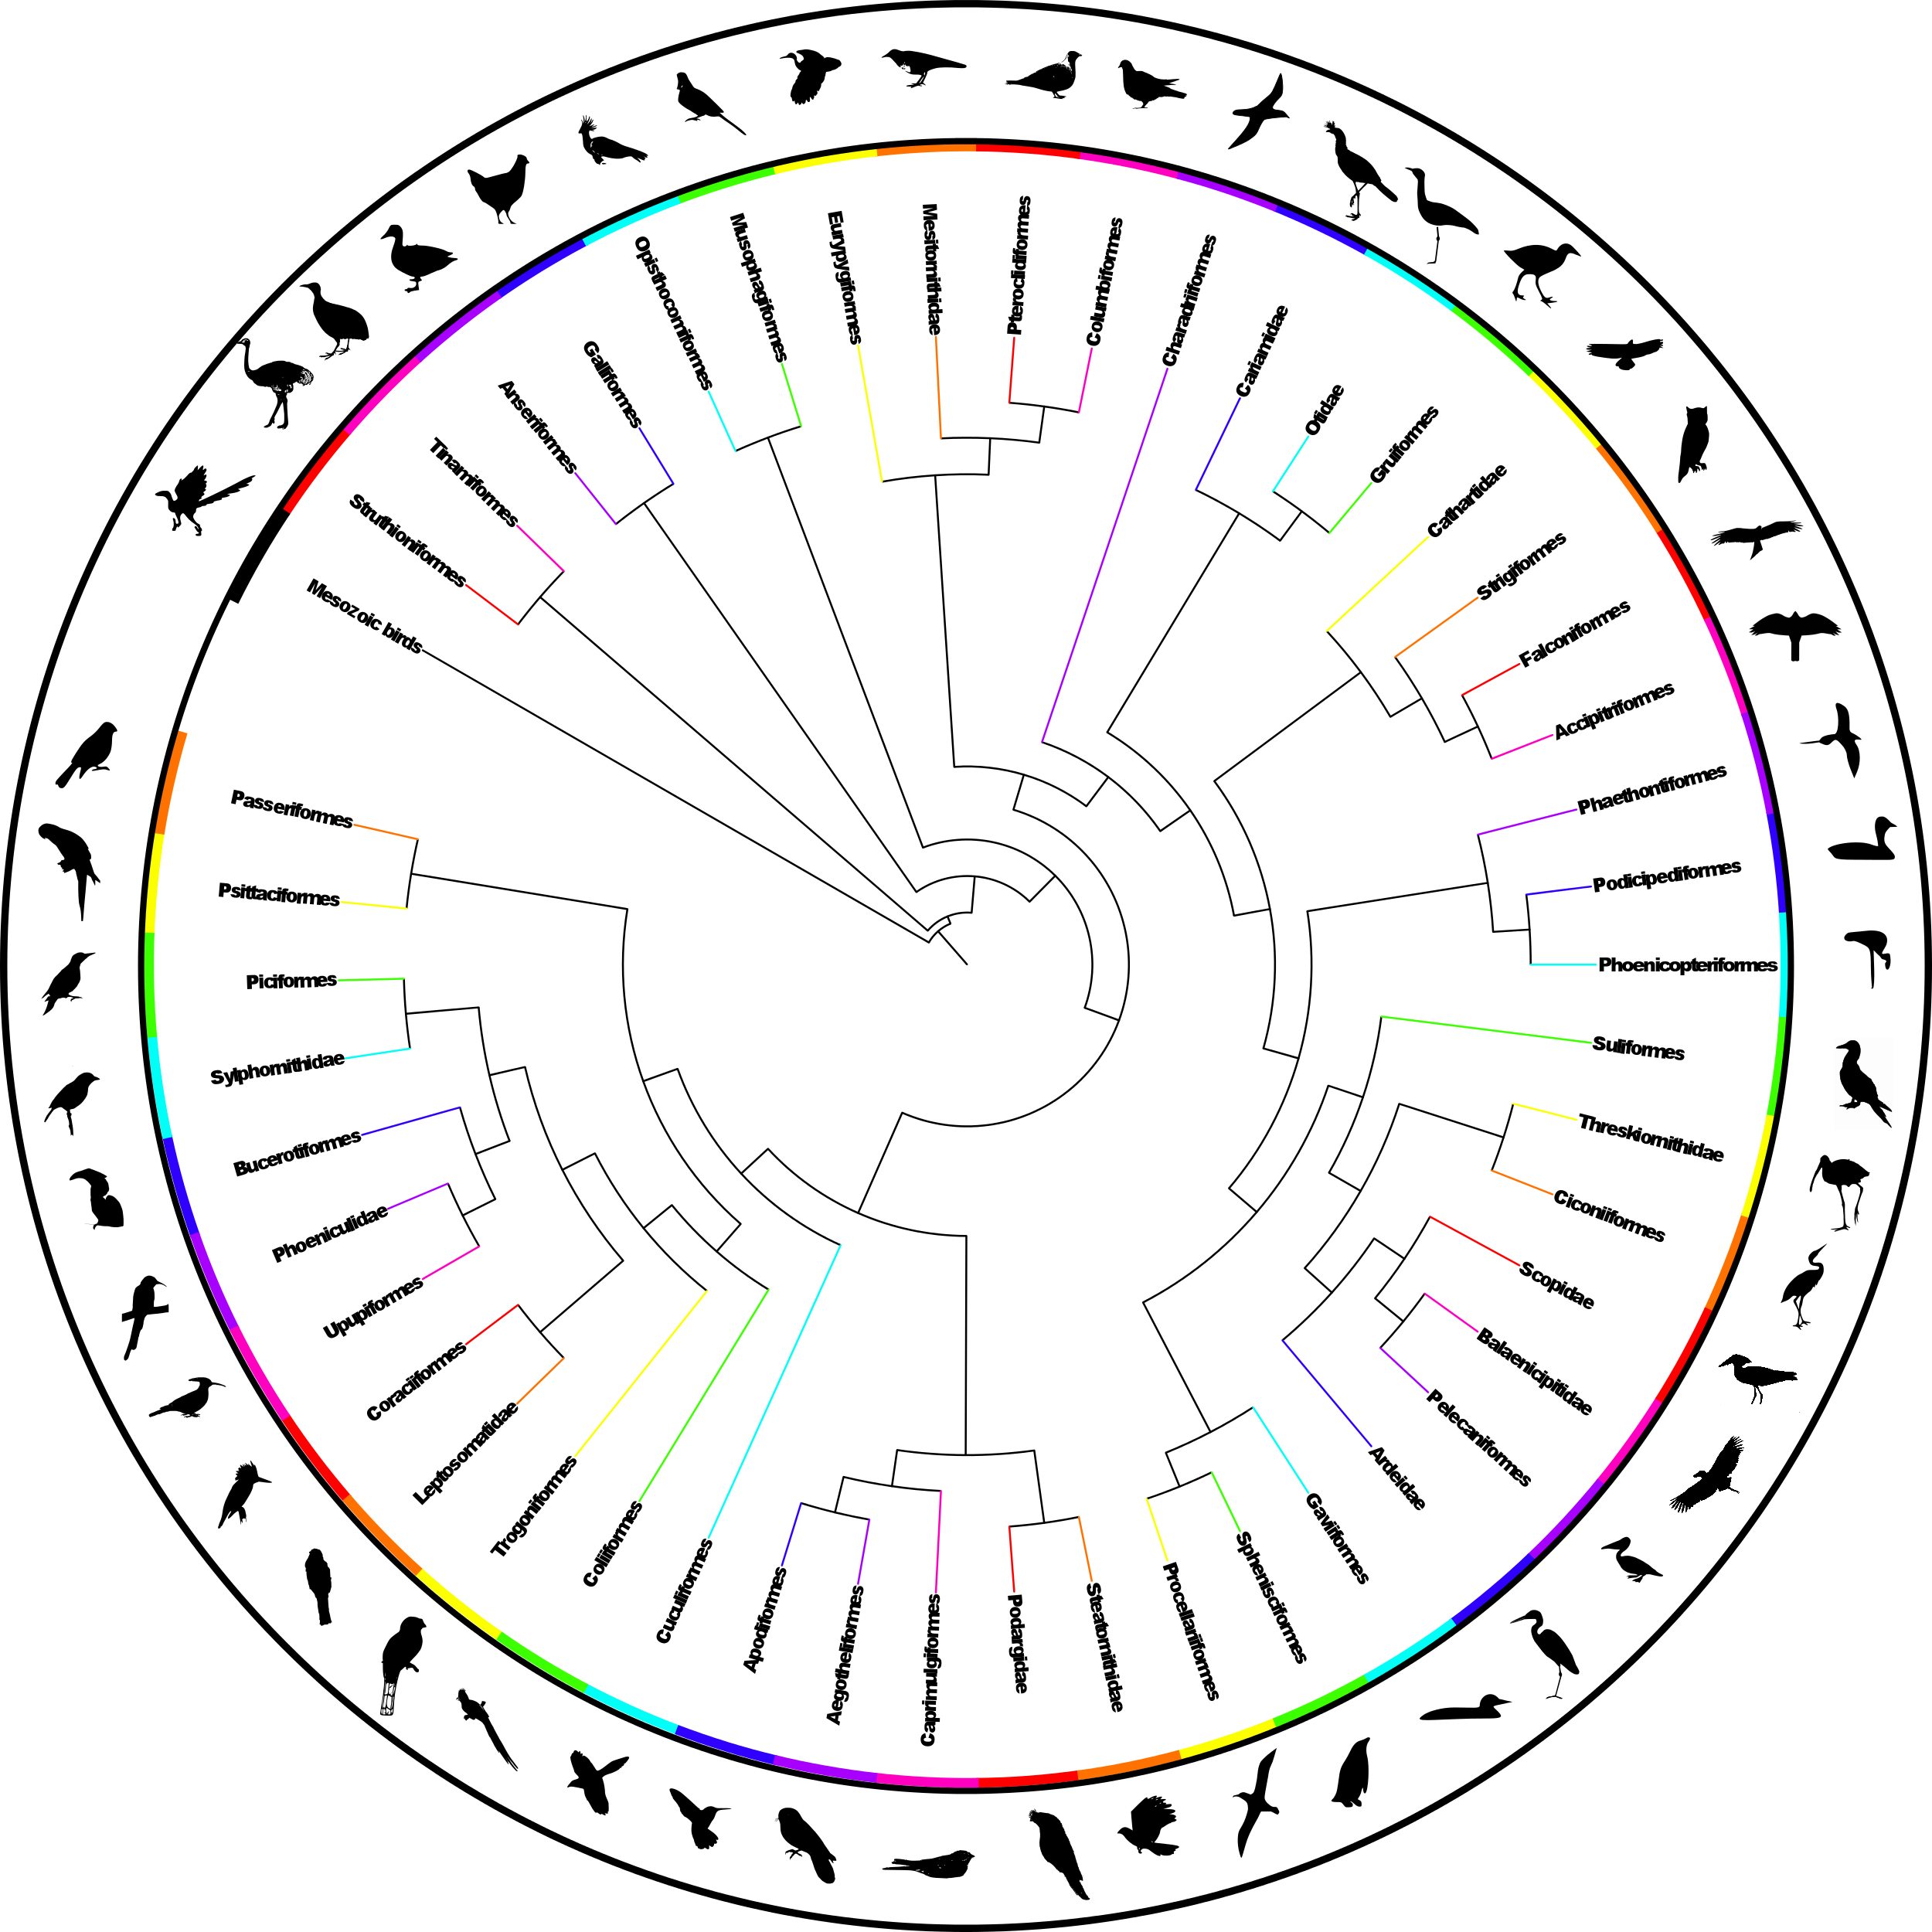
Fig. 2: Simplified summary supertree showing order-level relationships
Discussion
Taxonomic coverage, data types and resolution
The resulting supertree contains approximately two thirds of all known birds synthesised from source data from the years 1976 to 2008. The number of source trees from each year shows that the majority of data are derived from 2000 onwards (Figure 3). The vast majority of the source data comes from molecular sources (Figure 4) with cytochrome b being the single highest contributor to the data set with 38.9% (403 trees) of source trees built from cytochrome b sequences. See additional file 641 for further information on the composition of the data set. Published molecular studies more than doubled in the period from 2000 to 2009, quickly becoming the largest source of available data. The overall topology of the supertree is more consistent with molecular hypotheses, possibly due to the strong bias towards molecular analyses in the source data. Figure 5 shows the overall distribution of taxa sampled in source trees in the form of a data availability matrix. The density of data sampling is excellent with a large densely sampled area and very few trees and taxa with poor sampling. Resolution of the tree is very high (99.85%).
The number of avian phylogenies published, and included in the supertree analysis, is heavily skewed towards recent years with relatively few trees from pre-1995.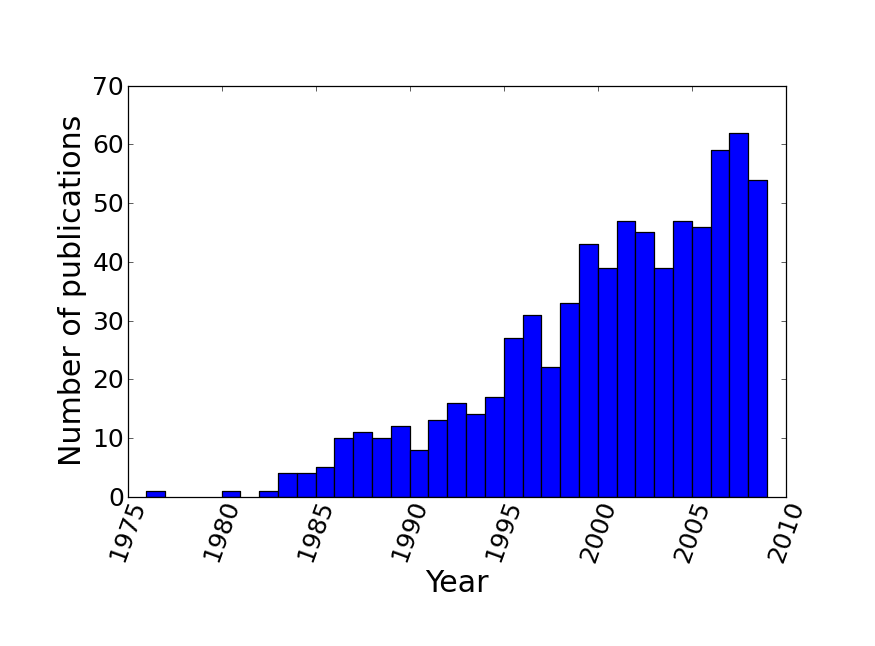
Fig. 3: Distribution of source trees by year of publication.

Fig. 4: Distribution of source trees by year of publication.
The number of avian phylogenies published, and included in the supertree analysis, is heavily skewed towards recent years with relatively few trees from pre-1995.
Source trees are sorted vertically and taxa are sorted horizontally both by frequency. Each dot represents the presence of a taxon in a given source tree. The most frequently occurring taxon, Gallus gallus, is at the bottom. The bottom left hand corner shows the most densely sampled area where many taxa are found in many source trees.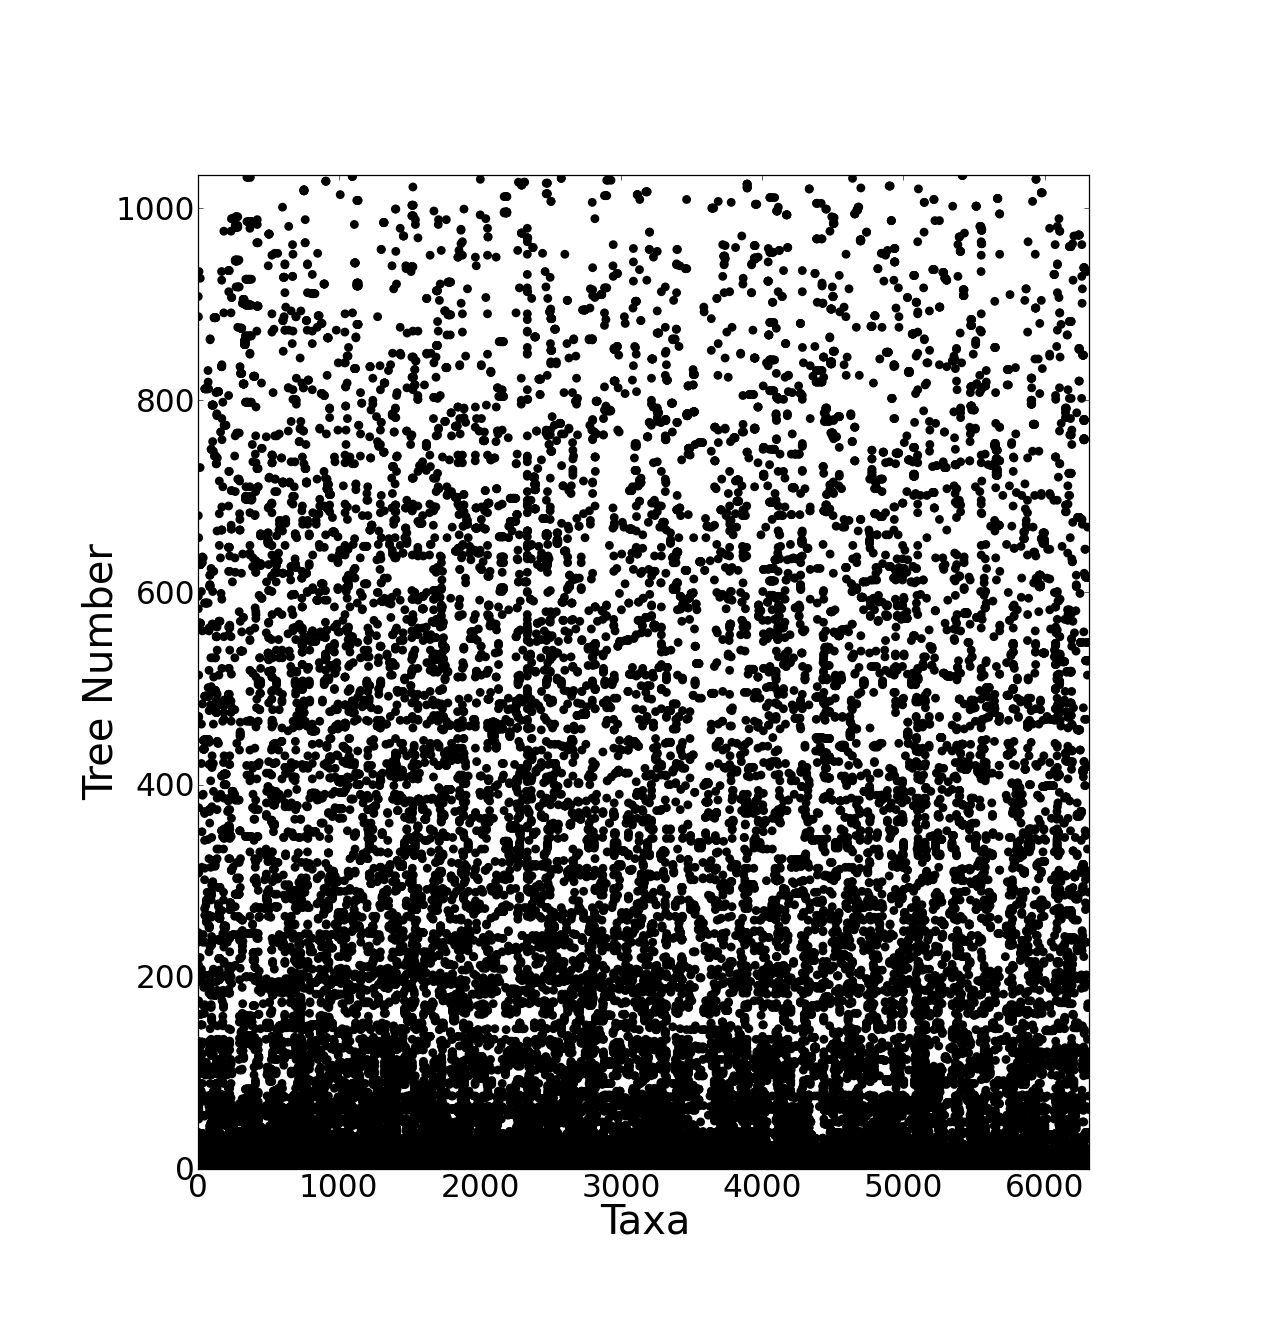
Fig. 5: Data availability matrix for the supertree source data.
MRP performance and novel clades
The MRP method cannot provide new information on relationships that is not already present in the source trees but it is a convenient and fast method for summarising the current state of phylogenetic knowledge. Although some spurious relationships may be recovered, eg., novel clades as discussed below, the majority of the relationships found in the supertree are well-supported by the source trees (see main discussion for details).
A small number (approximately 3%) of taxa are placed in novel clades; i.e. clades that are not supported by the source data. These novel clades tend to occur at the bases of large clades near the tips of the trees and therefore only affect the lower level relationships. The vast majority are found within the order Passeriformes, an order that has historically posed the biggest challenge to avian systematists34. An examination of these taxa and the corresponding source trees showed that these taxa, without exception, are characterised by one or more of the following:
See additional file 741 for a list of problematic taxa and their occurrence within the source trees. Post-Mesozoic fossil taxa are particularly poorly represented by the source data and as a result are commonly found in novel clades. Palaeopsittacus and Psittacopes for example are each only represented by one source tree53,54, therefore the algorithm is unable to accurately place them. Another observation made is that MRP has a tendency to place fossil taxa in highly derived positions, e.g., the Cretaceous anseriform fossil Vegavis is placed within a clade of extant ducks despite there being no source trees to support this relationship. These poorly constrained taxa are a big problem for supertree analyses and these “novel clades” are a well-known, but problematic, property of Matrix Representation with Parsimony49. Algorithms and software are becoming available to help reduce this problem by identifying potential rogue taxa either prior to running an analysis or post priori55 but, as is the case with support values, they cannot cope with the size of the present dataset and we find that the analysis is again necessarily limited by computational constraints. The size of the data set also makes manual identification of these taxa, as we have done here, extremely time-consuming and cumbersome.
Another problem is that many of the algorithms available only identify taxa that may be placed incorrectly as a result of many possible, equally parsimonious positions in the tree (e.g., Safe Taxonomic Reduction56) but this does not appear to be the sole problem with MRP and what is really needed is a leaf-based measure of support that would readily identify potential rogue taxa that occupy positions in the tree for which there is no evidence in the underlying data. In the meantime we suggest caution is used, particularly if fossil taxa are to be used for obtaining clade divergence dates.
Tree topology
The tree is well-resolved and stable at both order and family level with the majority of families and orders resolved as monophyletic; see discussion below for exceptions.
Deep divergences
The extinct Mesozoic birds are placed at the base of the tree with Archaeopteryx lithographica occupying the most basal position. Within these the Enantiornithes (“opposite birds”) form a distinct monophyletic clade. The Enantiornithes represent a separate radiation to the Ornithurae (the direct ancestors of modern birds) that subsequently became extinct at the Cretaceous-Tertiary boundary57,58,59,60. The earliest divergences of birds are amongst the least controversial61 and here the supertree supports the split of the crown group modern birds (Neornithes) into Palaeognathae + Neognathae with a further spilt of Neognathae into the Galloanserae landfowl/waterfowl clade + all other modern birds (Neoaves)62,63 as opposed to Sibley and Ahlquist’s9 non-monophyletic Neognathae in which the Galloanserae are sister group to the Palaeognathae.
Palaeognathae
The extinct Tertiary palaeognaths Lithornis and Palaeotis are basal to the extant palaeognath taxa. The supertree supports the hypothesis of Tinamidae + all other palaeognaths64. The extinct Madagascan elephant bird Aepyornis appears within the Struthioniformes at the base of the Struthionidae + Rheidae while the Dinornithidae of New Zealand appear at the base of the Struthioniformes clade. The New Zealand ratites, Apterygidae and Dinornithidae, do not form a monophyletic group. This has been suggested by Houde14 and Cooper et al.65 to have implications for vicariance biogeography providing evidence for a second colonisation of New Zealand by kiwis.
Galloanserae
The Galliformes + Anseriformes clade is well-supported by molecular works66. Within the Galliformes, the supertree supports the more recent view of Megapodidae as sister to the Cracidae + remaining Galliformes, which all constitute monophyletic families rather than the more traditional placement of a Megapodidae + Cracidae clade as sister to the rest of the Galliformes9. The Anseriformes are split into the three well-defined traditional, monophyletic families: Anhimidae, Anseranatidae and Anatidae.
“Waterbird” assemblage
The supertree recovers the “waterbird” clade containing the “Pelecaniformes”, “Ciconiiformes”, Procellariiformes, Sphenisciformes and Gaviiformes as found in the large molecular analyses of Ericson et al.67 and Hackett et al.16. Morphological evidence also supports this clade68. The Livezey and Zusi phylogeny68 also places the orders Phoenicopteriformes, Podicipediformes and Phaethontiformes within this assemblage, as can be seen in the supertree.
Within this assemblage the traditional “Pelecaniformes” are split into two groups, one comprising the Pelecanidae, the other the Fregatidae + Sulidae + Anhingidae + Phalacrocoracidae. In addition the Pelecanidae are grouped with the “ciconiiform” families Ardeidae, Balaenicipitidae and Scopidae. These findings are consistent with recent molecular studies16,71,72,73,69,67,70,71,72,73 in which it is proposed that the “Pelecanidae” group retains the name Pelecaniformes while the second group be given the name “Phalacrocoraciiformes”74. Some analyses also place Threskiornithidae with the Pelecaniformes which would result in only the Ciconiidae remaining in the Ciconiiformes. The placement here of Threskiornithidae + Ciconiidae may simply reflect the recent state of flux of these taxa.
The sister group relationship of Sphenisciformes + Procellariiformes has support from both morphology68 and molecular data16. There is limited evidence for the placing of Gaviiformes with these taxa75 but the relative positions of all three orders within the “waterbird” assemblage is far from resolved. There are a number of well-known fossil penguins (e.g., Delphinornis, Marambiornis, Perudyptes) which are all placed basally within the Sphenisciformes in the supertree. The Procellariiformes consist of well established monophyletic families.
The Phoenicopteriformes + Podicipediformes clade found by the supertree, termed “Mirandornithes” by Sangster76, is well supported by a large number of molecular studies16,67,69,72,77,78.
Gruiformes/Otididae/Charadriiformes
The positioning of the Gruiformes + Otidae and the Charadriiformes (including the Turnicidae) as sister groups to the “waterbird” assemblage is congruent with recent molecular hypotheses16,67,73. The Turnicidae were traditionally placed in the Gruiformes9,79 but are now understand to be part of the Charadriiformes63. It is less certain that the Cariamidae are genuinely part of the Gruiformes + Otididae clade. The Cariamidae were also part of the traditional “Gruiformes” but may actually be more closely related to the falconiform birds61. The core Gruiformes found here are composed of the Psophidae, Gruidae, Heliornithidae, Aramidae and Rallidae. Within the Charadriiformes the most basal lineages include the plovers and allies; Chionidiae, Burhinidae, Pluvianidae, Recurvirostridae, Ibidorhynchidae, Haematopidae and Charadriidae. The supertree divides the remaining Charadriiformes into monophyletic gull and sandpiper lineages.
Columbiformes/Mesitornithidae/Eurypygidae
Eurypygidae + Rhynchochetidae is well supported by morphological and molecular data16,67,68,80,81,82. The Columbidae + Pteroclididae is less certain but relatively well established83,84. The position of these taxa with the Mesitornithidae as part of the “Metaves” is suggested by recent molecular studies16,67. The supertree however does not support the “Metaves” clade and it has been suggested that the “Metaves” does not constitute a monophyletic group as discussed in Mayr61. The results found here are more congruent with Chojnowski et al.’s80 findings of an affinity between Columbiformes and the core Gruiformes + “waterbird” assemblage. The supertree places the extinct Raphidae (dodo and solitaire) within the Columbiformes.
Musophagiformes/Opisthocomus
The relationships of the hoatzin are controversial and poorly understood. Opisthocomus has previously been placed with the Cuculiformes (cuckoos, coucals and anis)85,86,87, the Gruiformes (crakes and rails) and Musophagiformes88,89. The supertree supports the Opisthocomus + Musophagiformes relationship. Other putative close relatives include the Columbiformes63 but the supertree does not recover this relationship.
Caprimulgiformes/Apodiformes
Mayr90 coined the term “Strisores” for the clade containing Caprimulgiformes and Apodiformes that has received a great deal of support from molecular data16,67,71,90. The supertree supports the monophyly of this proposed clade and places it as sister to the “landbird” assemblage as in Pratt et al. 200991; rather than as part of the “Metaves” as proposed elsewhere16,67,70 or as a polyphyletic group73. The sister group relationship of the “caprimulgiform” taxon Aegothelidae and the Apodiformes, resulting in a paraphlyletic “Caprimulgiformes” is well-supported by molecular and morphological data16,67,69,90,91,92,93,94. The Apodiformes contain a monophyletic Apodidae and Trochilidae, as in Sibley and Ahlquist’s9 “Trochiliformes” for hummingbird taxa. The association between the Apodiformes and “Trochiliformes” has long been recognised63,93,95,96 and is not contradicted by any of the source trees.
Falconiformes/Accipitriformes/Strigiformes
The Falconiformes and Accipitriformes represent a single lineage in the supertree. The Falconiformes and Strigiformes are united as in analyses based on osteology68,97. They are not however placed within the “landbird” assemblage as in recent large molecular studies16,67. New World vultures (Cathartidae) are not placed with the Ciconiiformes as in some early works but neither are they placed with the Old World Vultures (Accipitriformes)16,67 supporting the proposal that they might require an order level designation (“Cathartiformes”)67.
Coraciiformes/Alcediniformes/Piciformes/Psittaciformes
Recent large molecular analyses have proposed a “landbird” clade, the supertree recovers part of this clade but not in its entirety. The supertree does support a monophyletic clade containing the Coraciiformes, Alcediniformes and Piciformes which is well supported by molecular data16,67. The affinities of the Leptosomatidae are not well-understood61, the supertree places them within this “landbird” assemblage with the Coraciiformes. The Trogoniformes are a taxon for which higher level relationships are poorly understood, in the supertree they are placed as sister to the Coraciiformes + Alcediniformes + Piciformes clade with the Coliiformes and Cuculiformes also placed in this clade. The former is supported by molecular data68,98, however the latter is not well-supported.
The Piciformes are split into two distinct clades, one supporting the division into the monophyletic families Ramphastidae, Capitonidae, Megalaimidae (previously included within Capitonidae), Lybiidae and Semnornithidae99,100,101,102 and the second containing the monophyletic Picidae (woodpeckers) and the Indicatoridae (honeyguides) as in Simpson and Cracraft101, Swiersczewski and Raikow102 and Lanyon and Zink100.
The coraciiform clade contains the Brachypteraciidae, Coraciidae, Meropidae, Alcedinidae, Todidae and Momotidae. The Bucerotiformes, Bucorvidae, Bucerotidae and Phoeniculidae, are placed in a clade sister to the Piciformes. The Hoopoe, Upupa epops, is also placed within the Bucerotiformes in contrast to Sibley and Ahlquist’s9 suggestion of elevating it to a new order “Upupiformes”.
The Psittaciformes are traditionally considered to have no close living relatives9 but the supertree is consistent with more recent analyses that place them as the sister taxon to the Passeriformes16,67,69,89.
Passeriformes
The Passeriformes contain the majority of extant bird species and have undergone extensive reorganisation within the last decade. The supertree supports the division into three suborders: New Zealand Wrens (Acanthisitti) + all other passeriformes (Tyranni + Passeri). Monophyly of the Old and New World suboscines is well-documented103,104 and as expected the supertree splits the Tyranni (suboscines) into Old World (Eurylaimides) and New World (Tyrannides) groups, all of which contain well-established monophyletic families, the one exception being the Eurylaimidae which is now understood to be polyphletic105. In the supertree Smithornis and Calpytomena fall outwith the main Eurylaimidae clade. The neotropical Sapayoa aenigma was traditionally placed in the New World suboscines but has more recently been placed in the Old World suboscines in varying positions; the supertree places it at the base of the main Eurylaimidae clade (containing Eurylaimus)106,107,108. The New World suboscines are further split into two monophyletic superfamilies; the “bronchophone” suboscines and the Furnarioidea. The Oligocene fossils Zygodactylus and Primozygodactylus danielsi are placed at the base of the Passeriformes.
Sibley and Ahlquist9 split the Passeri into the Corvida and the Passerida but while the Passerida is retained it is now known that the “Corvida” do not comprise a monophyletic group69,109,110,111. Basal within the Passeri are the Menuridae and Atrichornithidae, sometimes designated as the superfamily Menuroidea9,112. The supertree also supports the superfamily status of the previously incertae sedis Ptilonorhynchoidea (Climacteridae + Ptilonorhynchidae)9,112,113, and supports a relationship between Orthonychidae + Pomatostomidae. The Meliphagoidea contains a monophyletic Maluridae, Pardalotidae, Acanthizidae and Meliphagidae.
The large well-supported110 superfamily Corvoidea includes the corvid birds that have radiated out from the Australo-Papuan region and diversified worldwide. As found in the previously published oscine supertree34Melanocharis and Paramythia berrypeckers, and Toxorhamphus longbills appear to belong to Corvoidea rather than to Passeroidea as suggested by Sibley and Ahlquist9 and Monroe and Sibley1. Other lineages placed within this clade include well-established members of the core Corvoidea. These include the Campephagidae, Paradisaeidae, Monarchidae, Oriolidae, Dicuridae, Laniidae and Corvidae. The Picarthatidae + Chaetopidae + Eupetidae clade (possible superfamily) and Petroicidae are at the base of the large infraorder Passerida. This placing of the Petroicidae reflects recent views on their position within the oscine birds110,114.
The supertree supports the identification of a number of recently proposed superfamilies within the monophyletic Passerida clade in addition to Sibley and Ahlquist’s9 original three: Sylvioidea, Muscicapoidea and Passeroidea. At the base of the Passerida are the Sylvioidea and the possible superfamily Paroidea. The Hyliotidae have recently been split from Sylviidae115 and are placed as sister to the Sylvioidea in the supertree. The Sylvioidea families have undergone a great deal of change in recent years, the supertree supports many of the newly suggested families and new delimitation of traditional families, for example the splitting of the “Timaliidae” into a core timaliid clade and a number of newly recognised lineages such as the Pellorneidae and Leiothrichidae116 and the splitting of the “Sylviidae” to recognise new families such as the Locustellidae and the Cisticoliidae117,118. Well-supported members of the Sylvioidea include Alaudidae, Hirundinidae, and Pycnonotidae109,117,119,120, while the supertree supports the inclusion of the Zosteropidae within the Timaliidae34.
The Muscicapidoidea and Certhioidea form a clade with the proposed Bombycilloidea and Reguloidea superfamilies. Muscicapoidea intra-relationships are well-supported by a number of analyses9,109,115,118,119,121 and the supertree finds the traditional families Mimidae, Cinclidae, Sturnidae, Turdidae and Muscicapidae along with the Buphagidae and Rhabbdornithidae also being placed as distinct families.
The Passeroidea is the largest passeriform superfamily. Along with finches, sparrows, weavers etc. it contains the nine-primaried oscines – songbirds with nine easily identifiable primary feathers on each wing. The nine-primaried oscines are a large radiation that contains approximately 10% of all extant species of birds122 and form a strongly supported monophyletic clade109,110,122. The supertree does not place the Peucedramidae within the nine-primaried oscines but with the Prunellidae. All the families are resolved as monophyletic with the exception of the Thraupidae/Cardinalidae clade which has undergone extensive reorganisation in recent years123. The supertree was unable to resolve the position of the Icteridae, the varying position of the Icteridae in the supertree as sister to either the Parulidae or the Emberizidae both have support from recent analyses109,119,124. In the simplified family level tree we have collapsed these three families to a trichotomy to reflect this uncertainty, which seems likely to be a reflection of its varying position in source trees rather than a true biological relationship. The supertree supports the separation of the estrildid finches and the true sparrows into two families the Estrildidae and Passeridae as in Christidis and Boles74. The Dicaeoidea (Nectariniidae + Dicaeidae) and Promeropidae are at the base of the Passeroidea. These may represent independent superfamilies or may be included as part of the Passeroidea.
Conclusions
The supertree is the first published species-level supertree of birds. It is also the first comprehensive phylogeny of birds to include fossils; both recently extinct and Mesozoic taxa, which are of vital importance for analyses requiring an understanding of the deep evolutionary history of birds. It is not intended to be the final word in avian systematics nor is it intended to be used as a basis for re-evaluating avian taxonomy. It does, however, provide a platform upon which further research can be based and will hopefully provide a useful resource for researchers studying avian macroevolution, conservation, biodiversity, comparative biology and character evolution. An earlier version of the supertree24 has already been used in a large number and variety of evolutionary studies125,126,127,128,129,130,131,132,133,134 and it is anticipated that this updated tree will provide a basis for further research of this nature and may be of particular use to macroevolutionary studies due to the inclusion of fossil taxa. We acknowledge that many additional papers have been published since our data collection ceased – avian systematics is a rapidly moving field. This tree does however represent a significant update compared to Davis24 and we anticipate that a further update will be published in the future; for now this tree is still the only large avian phylogeny available with a broad taxonomic coverage containing both fossil and extant taxa. This work highlights areas in which systematic knowledge is poor or inconsistent, suggesting a possible focus for future phylogenetic studies. We also identify the need for leaf-based measures of support to aid identification of rogue taxa in supertree analyses. The supertree represents a first attempt at a species-level avian supertree and will no doubt be improved upon as further data and better algorithms become available.
Availability of supporting data
All supplementary data are available at figshare: http://dx.doi.org/10.6084/m9.figshare.976113
Competing Interest Statement
The authors declare that no competing interests exist.
Acknowledgements
We are grateful to the HPC service at Imperial College London for use of their cluster to complete the analyses and also to an anonymous reviewer whose comments greatly improved the manuscript.References
- Monroe Jr BL & Sibley CG. 1993. A world checklist of birds. Yale University Press, New Haven.
- Chiappe LM. 2002. Basal bird phylogeny., p. 448-472. In Chiappe LM and Witmer LM (eds.), Mesozoic birds: Above the heads of dinosaurs. University of California Press, London.
- O’Connor JK, Zhang Y, Chiappe LM, Meng Q, Quanguo L & Di L. 2013. A new enantiornithine from the Yixian Formation with the first recognized avian enamel specialization. Journal of Vertebrate Paleontology, 33:1-12.
- Wang Y-M, O' Connor JK, Li D-Q, You H-L. 2013. Previously Unrecognized Ornithuromorph Bird Diversity in the Early Cretaceous Changma Basin, Gansu Province, Northwestern China. PLOS ONE. DOI:10.1371/journal.pone.0077693
- Zhou S, Zhou Z & O' Connor J. 2013. A new piscivorous ornithuromorph from the Jehol Biota Historical Biology: An International Journal of Paleobiology. DOI:0.1080/08912963.2013.819504
- Mayr G. 2013. The age of the crown group of passerine birds and its evolutionary significance – molecular calibrations versus the fossil record. Systematics and Biodiversity, 11:7-13.
- IUCN Red List of Threatened Species. Version 2013.2.
Reference Link - Nee S & May RM. 1997. Extinction and the loss of evolutionary history. Science, 278:692–694.
- Sibley CG & Ahlquist JE. 1990. Phylogeny and classification of birds. A study in molecular evolution. Yale University Press, New Haven and London.
- Nee S, Mooers AØ & Harvey PH. 1992 Tempo and mode of evolution revealed from molecular phylogenies. Proceedings of the National Academy of Sciences of the United States of America, 89:8322-8326.
- Mooers AØ & Harvey PH. 1994. Metabolic rate, generation time and the rate of molecular evolution in birds. Molecular Phylogenetics and Evolution, 3:344-350.
- Temrin H & Sillen-Tullberg B. 1994. The evolution of avian mating systems - a phylogenetic analysis of male and female polygamy and length of pair bond. Biological Journal of the Linnean Society, 52:121-149.
- Harshman J. 1994. Reweaving the tapestry - what can we learn from Sibley and Ahlquist (1990). Auk, 111:377-388.
- Houde P. 1987. Critical evaluation of DNA hybridisation studies in avian systematics. Auk, 104:17-32.
- Sheldon FH & Bledsoe AH. 1993. Avian molecular systematics, 1970s to 1990s. Annual Review of Ecology and Systematics, 24:243-278.
- Hackett SJ, Kimball RT, Reddy S, Bowie, RCK, Braun EL, Braun MJ, Chojnowski JL, Cox WA, Han K-L, Harshman J, Huddleston CJ, Marks BD, Miglia KJ, Moore WS, Sheldon FH, Steadman DW, Witt CC & Yuri T. 2008. A Phylogenomic Study of Birds Reveals Their Evolutionary History. Science, 320:1763-1768.
- Jetz W, Thomas GH, Joy JB, Hartmann K & Mooers AO. 2012. The global diversity of birds in space and time. Nature, 491:444–448.
- Kluge AG. 1989. A concern for evidence and a phylogenetic hypothesis of relationships among Epicrates (Boidae, Serpentes). Systematic Zoology, 38:7-25.
- Miyamoto M. 1985. Consensus cladograms and general classifications. Cladistics, 1:186-189.
- Nixon K & Carpenter J. 1996. On simultaneous analysis. Cladistics, 12:221-241.
- Sanderson M, Purvis A & Henze C. 1998. Phylogenetic supertrees: assembling the trees of life. Trends in Ecology and Evolution, 13:105-109.
- Bininda-Emonds ORP, Jones KE, Price SA, Cardillo M, Grenyer R & Purvis A. 2004. Garbage in, garbage out: data issues in supertree construction. In: Phylogenetic supertrees: Combining information to reveal the tree of life. Volume 3. Edited by Bininda-Emonds ORP. Kluwer Academic, Dordecht, The Netherlands, 267-280.
- Gatesy J, Baker CRH & Hayashi C. 2004. Inconsistencies in arguments for the supertree approach: supermatrices versus supertrees of Crocodylia. Systematic Biology, 53:342-355.
- Davis KE. 2008. Reweaving the Tapestry: A supertree of birds. [http://theses.gla.ac.uk/178/] PhD thesis, University of Glasgow.
Reference Link - Von Haesler A. 2012. Do we still need supertrees? BMC Biology, 10:13.
- Lloyd, GT, Davis KE, Pisani D, Tarver JE, Ruta M, Sakamoto M, Hone DW, Jennings R & Benton MJ. 2008. Dinosaurs and the Cretaceous Terrestrial Revolution. Proceedings of the Royal Society, Series B, 275:2483-90.
- Ruta M, Jeffery JE, Coates MI. 2003. A supertree of early tetrapods. Proceedings of the Royal Society, Series B, 270:2507-2516.
- Ruta M, Pisani D, Lloyd GT, Benton MJ. 2007. A supertree of Temnospondyli: cladogenetic patterns in the most species-rich group of early tetrapods. Proceedings of the Royal Society, Series B, 274:3087-3095.
- Salamin N, Hodkinson TR & Savolainen V. 2002. Building supertrees: An empirical assessment using the grass family (Poaceae). Systematic Biology, 51:134-150.
- Bininda-Emonds ORP, Cardillo M, Jones KE, Macphee RDE, Beck RMD, Grenyer R, Price SA, Vos RA, Gittleman JL & Purvis A. 2007. The delayed rise of present-day mammals. Nature, 446:507-512.
- Bronzati M, Montefeltro FC & Langer MC. 2012. A species-level supertree of Crocodyliformes. Historical Biology: An International Journal of Paleobiology, 24:598-606.
- Kennedy M & Page RDM. 2002. Seabird supertrees: Combining partial estimates of procellariiform phylogeny. Auk, 119:88-108.
- Thomas GH, Wills MA & Székely T. 2004. Phylogeny of shorebirds, gulls and alcids (Aves: Charadrii) from the cytochrome-b gene: Parsimony, Bayesian inference, minimum evolution and quartet puzzling. Molecular Phylogenetics and Evolution, 30: 516-526.
- Jonsson KA & Fjeldså J. 2006. A phylogenetic supertree of oscine passerine birds (Aves: Passeri). Zoologica Scripta, 35:149-186.
- Eo SH, Bininda-Emonds ORP & Carroll JP. 2009. A phylogenetic supertree of the fowls (Galloanserae, Aves). Zoologica Scripta, 38:465-481.
- Sibly RM, Witt CC, Wright NA, Venditti, C, Jetz W & James H. Brown. 2012. Energetics, lifestyle, and reproduction in birds. Proceedings of the National Academy of Sciences of the United States of America, 109:10937–10941.
- Page RDM. 1996. TreeView: an application to display phylogenetic trees on personal computers. Computer Applications in the Biosciences, 12: 357-358.
- Davis KE & Hill J. 2010. The Supertree Tool Kit. BMC Research Notes, 3:95.
- Bininda-Emonds ORP & Sanderson, MJ. 2001. Assessment of the accuracy of matrix representation with parsimony analysis supertree construction. Systematic Biology, 50:565-579.
- Howard R & Moore A. 2003. The Howard and Moore complete checklist of birds. London, Christopher Helm.
- Reweaving the Tapestry: A Supertree of Birds. Katie Davis, Roderic Page. figshare. Retrieved 16:21, Mar
27, 2014 (GMT)
Reference Link - Baum BR & Ragan MA. 2004. The MRP method. In: Phylogenetic supertrees: Combining information to reveal the tree of life. Volume 3. Edited by Bininda-Emonds ORP. Kluwer Academic, Dordecht, The Netherlands, 12-34.
- Swenson MS, Suril R, Linder CR & Warnow T. 2011. SuperFine: Fast and Accurate Supertree Estimation. Systematic Biology, 61:214-227.
- Ross HA & Rodrigo AG. 2004. An assessment of matrix representation with compatibility in supertree construction., p. 35-64. In O. R. P. Bininda-Emonds (ed.), Phylogenetic supertrees: Combining information to reveal the tree of life. Volume 3. Kluwer Academic, Dordecht, The Netherlands.
- Chen D, Eulenstein O, Fernández-Baca D & Burleigh JG. 2006. Improved Heuristics for Minimum-Flip Supertree Construction. Evolutionary Bioinformatics Online 2006, 2:347–356.
- Page RM. 2002. Modified MinCut Supertrees. Algorithms in Bioinformatics, Proceedings Lecture Notes in Computer Science, 2452:537-551.
- Ragan MA. 1992. Phylogenetic Inference Based on Matrix Representation of Trees. Molecular Phylogenetics and Evolution, 1: 53-58.
- Goloboff PA, Farris JS & Nixon KC. 2008. TNT, a free program for phylogenetic analysis. Cladistics, 24:774-786.
- Bininda-Emonds ORP. 2003. Novel versus unsupported clades: assessing the qualitative support for clades in MRP supertrees. Systematic Biology, 52:839-848.
- Wilkinson M, Pisani D, Cotton J & Corfe I. 2005. Measuring Support and Finding Unsupported Relationships in Supertrees. Systematic Biology 54:823-831.
- Pisani D, Yates AM, Langer MC & Benton MJ. 2002. A genus-level supertree of the Dinosauria. Proceedings of the Royal Society, Series B, 269: 915-921.
- Swofford DL. 2002. PAUP*. Phylogenetic Analysis Using Parsimony (*and other methods). Sinauer Associates, Sunderland, Massachusetts.
- Dyke GJ & Cooper JH. 2000. A new psittaciform bird from the London Clay (Lower Eocene) of England. Palaeontology, 43:271-285.
- Mayr G. 2005. A Fluvioviridavis-like bird from the Middle Eocene of Messel, Germany. Canadian Journal of Earth Sciences, 42:2021-2037.
- Ranwez V, Berry V, Criscuolo A, Fabre PH, Guillemot S, Scornavacca C & Douzery EJP. 2007. PhySIC: A Veto Supertree Method with Desirable Properties. Systematic Biology, 56:798-817.
- Wilkinson M. 1995. Coping with abundant missing entries in phylogenetic inference using parsimony. Systematic Biology, 44:501-514.
- Feduccia A. 1995. Explosive evolution in Tertiary birds and mammals. Science, 267:637-638.
- Hou L, Martin LD, Zhou Z & Feduccia A. 1996. Early adaptive radiation of birds: Evidence from fossils from Northeastern China. Science, 274:1164-1167.
- Sanz JL & Buscalioni AD. 1992. A new bird from the Early Cretaceous of Las Hoyas, Spain, and the early radiation of birds. Palaeontology, 35:829-845.
- Zhang FC, Zhou ZH, Hou LH & Gu G. 2001. Early diversification of birds: evidence from a new opposite bird. Chinese Science Bulletin, 46:945-950.
- Mayr G. 2011. Metaves, Mirandornithes, Strisores and other novelties – a critical review of the higher-level phylogeny of neornithine birds. Journal of Zoological Systematics and Evolutionary Research, 49:58–76.
- Cracraft J. 1998. Early evolution of birds. Nature, 331:389-390.
- Van Tuinen M, Sibley CG & Hedges SB. 2000. The early history of modern birds inferred from DNA sequences of nuclear and mitochondrial ribosomal genes. Molecular Biology and Evolution, 17:451-457.
- Harshman J, Braun EL, Braun MJ, Huddleston CJ, Bowie RCK, Chojnowski JL, Hackett SJ, Han K-L, Kimball RT, Marks BD, Miglia KJ, Moore WS, Reddy, Sheldon FH, Steadman DW, Steppan SJ, Witt CC & Yuri T. 2008. Phylogenomic evidence for multiple losses of flight in ratite birds. Proceedings of the National Academy of Sciences USA, 105:13462–13467.
- Cooper AC, Mourer-Chauviré C, Chambers GK, Von Haeseler A, Wilson AC & Pääbo S. 1992. Independent origins of New Zealand moas and kiwis. Proceedings of the National Academy of Sciences USA, 89:8741-8744.
- Caspers G-J, de Weerd DU, Wattel J & de Jong WW. 1997. α-crystallin sequences support a galliform/anseriform clade. Molecular Phylogenetics and Evolution, 7:185-188.
- Ericson, PGP, Anderson CL, Britton T, Elzanowski A, Johansson US, Kallersjo M, Ohlson JI, Parsons TJ, Zuccon D & Mayr G. 2006. Diversification of Neoaves: integration of molecular sequence data and fossils. Biology Letters, 2:543-547.
- Livezey BC & Zusi RL. 2007. Higher-order phylogeny of modern birds (Theropoda, Aves: Neornithes) based on comparative anatomy. II. Analysis and discussion. Zoological Journal of the Linnean Society, 149:1-95.
- Cracraft, J, Barker FK, Braun MJ, Harshman J, Dyke G, Feinstein J, Stanley S, Cibois A, Schikler P, Beresford P, García-Moreno J, Sorenson MD, Yuri T & Mindell DP. 2004. Phylogenetic relationships among modern birds (Neornithes): Toward an avian tree of life. In: Assembling the tree of life. Edited by Cracraft J, Donoghue MJ. Oxford University Press, New York, 468-489.
- Fain MG & Houde P. 2004. Parallel radiations in the primary clades of birds. Evolution, 58:2558–2573.
- Mayr G. 2008. Avian higher-level phylogeny: well-supported clades and what we can learn from a phylogenetic analysis of 2954 morphological characters. Zoological Systematics and Evolutionary Research, 46:63–72.
- Van Tuinen M, Butvill DB, Kirsch JAW & Hedges SB. 2001. Convergence and divergence in the evolution of aquatic birds. Proceedings of the Royal Society, Series B, 268:1345-1350.
- Brown JW, Rest JS, Garcia-Moreno J, Sorenson MD & Mindell DP. 2008. Strong mitochondrial DNA support for a Cretaceous origin of modern avian lineages. BMC Biology, 6:6.
- Christidis L & Boles WE. 2008. Systematics and Taxonomy of Australian Birds. CSIRO Publishing, Collingwood.
- Olson SL. 1985. The fossil record of birds. In: Farner DS, King JR, Parkes KC (eds), Avian Biology, vol. 8. Academic Press, New York, pp 79–238.
- Sangster G. 2005. A name for the flamingo-grebe clade. Ibis 147:612– 615.
- Chubb AL. 2004. New nuclear evidence for the oldest divergence among neognath birds: the phylogenetic utility of ZENK (i). Mol ecular Phylogenetics and Evolution, 30:140–151.
- Morgan-Richards M, Trewick SA, Bartosch-Harlid A, Kardailsky O, Phillips MJ, McLenachan PA & Penny D. 2008. Bird evolution: testing the Metaves clade with six new mitochondrial genomes. BMC Evolutionary Biology, 8:20.
- Fürbringer M. 1888. Untersuchungen zur Morphologie und Systematik der Vögel, zugleich ein Beitrag zur Anatomie der Stütz- und Bewegungsorgane, 2 Volumes. Amsterdam, Holland.
- Chojnowski JL, Kimball RT & Braun EL. 2008. Introns outperform exons in analyses of basal avian phylogeny using clathrin heavy chain genes. Gene 410:89–96.
- Houde P, Cooper A, Leslie E, Strand AE & Montano GA. 1997. Phylogeny and evolution of 12S rDNA in Gruiformes (Aves). In: Mindell DP (ed), Avian molecular evolution and systematics. Academic Press, San Diego, CA, pp 121–158.
- Mayr G & Ericson P. 2004. Evidence for a sister group relationship between the Madagascan mesites (Mesitornithidae) and the cuckoos (Cuculidae). Senckenbergiana biologica, 84:119–135.
- Paton T, Baker AJ, Groth JG, Barrowclough GF. 2003. RAG-1 sequences resolve phylogenetic relationships within charadriiform birds. Molecular Phylogenetics and Evolution, 29: 268-278.
- Rotthowe K & Starck JM. 1998. Evidence for a phylogenetic position of button quails (Turnicidae: Aves) among the Gruiformes. Journal of Zoological Systematics and Evolutionary Research, 36:39-51.
- Hedges SB, Simmons MD, Van Dijk MA, Caspers M, Gert-Jan de Jong WW & Sibley CG. 1995. Phylogenetic relationships of the hoatzin, an enigmatic South American bird. Proceedings of the National Academy of Sciences USA, 92:11662-11665.
- Hughes JM. 2000. Monophyly and phylogeny of cuckoos (Aves, Cuculidae) inferred from osteological characters. Zoological Journal of the Linnean Society, 130:263-307.
- Johnson KP, Goodman SM & Lanyon SM. 2000. A phylogenetic study of the Malagasy couas with insights into cuckoo relationships. Molecular Phylogenetics and Evolution, 14:436-444.
- Hughes JM & Baker AJ. 1999. Phylogenetic relationships of the enigmatic hoatzin (Opisthocomus hoazin) resolved using mitochondrial and nuclear gene sequences. Molecular Biology and Evolution, 16:1300-1307.
- Sorenson MD, Oneal E, García-Moreno J & Mindell DP. 2003. More taxa, more characters: The hoatzin problem is still unresolved. Molecular Biology and Evolution, 20:1484-1499.
- Mayr G. 2010. Phylogenetic relationships of the paraphyletic 'caprimulgiform' birds (nightjars and allies). Journal of Zoological Systematics and Evolutionary Research, 48:126–137.
- Pratt RC, Gibb GC, Morgan-Richards M, Phillips MJ, Hendy MD, & Penny D. 2009. Toward resolving deep Neoaves phylogeny: data, signal enhancement, and priors. Molecular Biology and Evolution, 26:313–326.
- Barrowclough GF, Groth JG & Mert LA. 2006. The RAG-1 exon in the avian order Caprimulgiformes: phylogeny, heterozygosity, and base composition. Molecular Phylogenetics and Evolution, 41:238–248.
- Mayr G. 2002. Osteological evidence for paraphyly of the avian order Caprimulgiformes (nightjars and allies). Journal für Ornithologie, 142:82-97.
- Mayr G, Manegold A & Johansson U. 2003. Monophyletic groups within ‘‘higher land birds’’ – comparison of morphological and molecular data. Journal of Zoological Systematics and Evolutionary Research, 41:233–248.
- Bleiweiss R, Kirsch JAW & Lapointe F-J. 1994. DNA-DNA hybridisation-based phylogeny for "higher" nonpasserines: Reevaluating a key portion of the avian family tree. Molecular Phylogenetics and Evolution, 3:248-255.
- Johansson US, Parsons TJ, Irestedt M, & Ericson PGP. 2001. Clades within the "higher land birds", evaluated by nuclear DNA sequences. Journal of Zoological Systematics and Evolutionary Research, 39:37-51.
- Mayr G & Clarke J. 2003. The deep divergences of neornithine birds: a phylogenetic analysis of morphological characters. Cladistics 19:527–553.
- Espinosa de los Monteros A. 2000. Higher-level phylogeny of Trogoniformes. Molecular Phylogenetics and Evolution, 14:20-34.
- Lanyon SM & Hall JG. 1994. Reexamination of barbet monophyly using mitochondrial-DNA sequence data. Auk, 111:389-397.
- Lanyon SM & Zink RM. 1987. Genetic variation in piciform birds: Monophyly and generic and familial relationships. Auk, 104:724-732.
- Simpson SF & Cracraft J. 1981. The phylogenetic-relationships of the Piciformes (class Aves). Auk 1981, 98:481-494.
- Swierczewski EV & Raikow RJ. 1981. Hind limb morphology, phylogeny and classification of the Piciformes. Auk, 98:466-480.
- Irestedt M, Fjeldså J, Johansson US & Ericson PGP. 2002. Systematic relationships and biogeography of the tracheophone suboscines (Aves: Passeriformes). Molecular Phylogenetics and Evolution 2002, 23:499-512.
- Irestedt M, Johansson US, Parsons TJ & Ericson PGP. 2001. Phylogeny of major lineages of suboscines (Passeriformes) analysed by nuclear DNA sequence data. Journal of Avian Biology 2001, 32:15-25.
- Prum RO. 1993. Phylogeny, Biogeography, and Evolution of the Broadbills (Eurylaimidae) and Asities (Philepittidae) Based on Morphology. Auk, 110:304-324.
- Chesser RT. 2004. Molecular systematics of new world suboscine birds. Molecular Phylogenetics and Evolution , 32:11-24.
- Fjeldså J, Zuccon D, Irestedt M, Johansson US & Ericson PGP. 2003. Sapayoa aenigma, a new world representative of "old world suboscines”. Proceedings of the Royal Society, Series B, 270:238-241.
- Prum RO. 1990. Phylogenetic analysis of the evolution of display behavior in the neotropical manakins (Aves: Pipridae). Ethology, 84:202-231.
- Barker FK, Cibois A, Schikler P, Feinstein J & Cracraft J. 2004. Phylogeny and diversification of the largest avian radiation. Proceedings of the National Academy of Sciences of the United States of America, 101:6.
- Ericson PGP, Irestedt M & Johansson US. 2003. Evolution, biogeography, and patterns of diversification in passerine birds . Journal of Avian Biology, 34:3–1.
- Ericson PGP & Johansson US. 2003. Phylogeny of Passerida (Aves: Passeriformes) based on nuclear and mitochondrial sequence data. Molecular Phylogenetics and Evolution, 29:126-138.
- Ericson PGP, Christidis L, Irestedt M & Norman JA. 2002. Systematic affinites of the lyrebirds (Passeriformes: Menura), with a novel classification of the major groups of passerine birds. Molecular Phylogenetics and Evolution, 25:53-62.
- Christidis L, Leeton PR & Westerman M. 1996. Were bowerbirds part of the New Zealand fauna? Proceedings of the National Academy of Sciences USA, 93:3898-3901.
- Ericson PGP, Johansson US, Parsons & TJ. 2000. Major divisions in oscines revealed by insertions in the nuclear gene c-myc: a novel gene in avian phylogenetics. Auk, 117:1069–1078.
- Fuchs J, Fjeldså J, Bowie RCK, Voelker G & Pasquet E. 2006. The African warbler genus Hyliota as a lost lineage in the Oscine songbird tree: Molecular support for an African origin of the Passerida. Molecular Phylogenetics and Evolution, 39:186-197.
- Gelang M, Cibois A, Pasquet E, Olsson U, Alström P & Ericson PGP. 2009. Phylogeny of babblers (Aves, Passeriformes): major lineages, family limits and classification . Zoologica Scripta, 38:225–236 .
- Alström P, Ericson PGP, Olsson U & Sundberg P. 2006. Phylogeny and classification of the avian superfamily Sylvioidea. Molecular Phylogenetics and Evolution, 38:381–397.
- Beresford P, Barker FK, Ryan PG & Crowe TM. 2005. African endemics span the tree of songbirds (Passeri): molecular systematics of several evolutionary "enigmas". Proceedings of the Royal Society, Series B, 272:849-858.
- Barker FK, Barrowclough GF & Groth JG. 2002. A phylogenetic hypothesis for passerine birds: Taxonomic and biogeographic implications of an analysis of nuclear DNA sequence data. Proceedings of the Royal Society, Series B, 269:295-308.
- Sheldon FH & Gill FB. 1996. A reconsideration of songbird phylogeny, with emphasis on the evolution of titmice and their sylvioid relatives. Systematic Biology, 45:473-495.
- Cibois A & Cracraft J. 2004. Assessing the passerine "tapestry": Phylogenetic relationships of the Muscicapoidea inferred from nuclear DNA sequences. Molecular Phylogenetics and Evolution, 32:264-273.
- Klicka, J, Johnson NK & Lanyon SM. 2000. New world nine-primaried oscine relationships: Constructing a mitochondrial DNA framework. Auk, 117:321-336.
- Yuri T & Mindell DP. 2002. Molecular phylogenetic analysis of Fringillidae, New World nine-primaried oscines" (Aves: Passeriformes). Molecular Phylogenetics and Evolution, 23:229-243.
- Bledsoe AH. 1988. Nuclear DNA evolution and phylogeny of the new world nine-primaried oscines. Auk, 105:504-515.
- Cornwallis CK, West SA, Davis KE & Griffin AS. 2010. Promiscuity and the evolutionary transition to complex societies. Nature, 466:969-974.
- Galvan I & Møller AP. 2011. Brain size and the expression of pheomelanin-based colour in birds . Journal of Evolutionary Biology, 24:999–1006.
- Gasc A, Sueur J, Jiguet F , Devictor V, Grandcolas P, Burrow C, Depraetere M & Pavoine S. 2013. Assessing biodiversity with sound: Do acoustic diversity indices reflect phylogenetic and functional diversities of bird communities? Ecological Indicators, 25:279–287.
- Hawkins BA, McCain CM, Davies TJ, Buckley LB, Anacker B, Cornell HV, Damschen EI, Grytnes J-A, Harrison S, Holt RD, Kraft NJB & Stephens PR. 2011. Different evolutionary histories underlie congruent species richness gradients of birds and mammals . Journal of Biogeography, 39: 825–841.
- Mabry KE, Shelley EL, Davis KE, Blumstein DT & Van Vuren DH. 2013. Social Mating System and Sex-Biased Dispersal in Mammals and Birds: A Phylogenetic Analysis . PLOS ONE, 8:3.
- Møller AP, Vagasi CI & Pap PL. 2013. Risk-taking and the evolution of mechanisms for rapid escape from predators . Journal of Evolutionary Biology, 26:1143–1150.
- Overington SE, Morand-Ferron J, Boogert NJ & Lefebvre L. 2009. Technical innovations drive the relationship between innovativeness and residual brain size in birds . Animal Behaviour, 78:1001–1010.
- Rutkowska J, Lagisz M, & Nakagawa S. 2012. The long and the short of avian W chromosomes: no evidence for gradual W shortening . Biology Letters, 8:636–638.
- Sol D, Garcia N, Iwaniuk A, Davis KE, Meade A, Boyle WA & Székely T. 2010. Evolutionary Divergence in Brain Size between Migratory and Resident Birds. PLOS ONE, 5:3.
- Strubbe D, Broennimann O, Chiron F, & Matthysen E. 2013. Niche conservatism in non-native birds in Europe: niche unfilling rather than niche expansion. Global Ecology and Biogeography, 22: 962-970.
Leave a Comment
You must be logged in to post a comment.