Introduction
Flooding is a common natural disaster 1, leading all other natural disasters with respect to the number of people affected and in resultant economic losses 2. The Centre for Research on the Epidemiology of Disasters (CRED) reported 164 floods claimed the lives of 4,731 people in 2016, with a further 77.8 million people affected 3. Drowning is a leading cause of death during times of flood 4, with floods estimated to have claimed the lives of over 500,000 people between 1980 and 2009 globally 5.
Rivers have been identified as a leading location for drowning internationally 5 and in Australia 6, and flooding is a known risk factor 7. Flooding results in the drowning deaths of 13 people, on average, per year in Australia 7.
Geographical remoteness (which includes isolation from major services such as medical assistance) is a risk factor for flood-related drowning in Australia 7. People in remote and very remote areas experience 80 and 229 times the risk respectively of drowning in a flood-related incident compared to major cities 7. An exploration of how to prevent drowning incidents during floods in rural and remote Australia is vital to reducing the risk and loss of life.
Driving through floodwaters is the leading activity prior to drowning in floodwaters, both in Australia 7,8 and internationally 9, 10. Recreational interaction with floodwaters, such as for swimming, also claims lives domestically in Australia 7, 11, as well as around the world 12, 13.
The need for systematic data collection for the prevention of loss of life during disasters has been identified, rather than data collected on an ad-hoc basis at the time of the emergency 10. To guide prevention efforts, including identifying those most at risk, this study aimed to survey river users on previous participation in two flood-related behaviours; driving through floodwaters and swimming in a flooded river.
Methods
A self-reported survey of adult river users (18 years and older) at four river locations was conducted in January and February 2018 (summer, school holidays, wet season), namely Alligator Creek in Queensland (classified as Outer Regional) and the Murrumbidgee (Inner Regional), Murray (Inner Regional) and Hawkesbury (Major Cities) rivers in New South Wales. Alligator Creek was located in a national park (no cost to enter), whereas the other three sites were on public land. All locations had BBQ facilities, public toilets and the Hawkesbury site featured a boat ramp. All locations were previously identified as blackspots for fatal drowning.
Potential respondents were randomly approached and asked to participate. Once informed consent was obtained, respondents were asked a range of demographic and river usage questions, as well as questions about knowledge of drowning risk factors and alcohol consumption questions. All river users who completed a survey were also breathalysed, whereby their blood alcohol content (BAC) was estimated by recording the alcohol on their expired breath 14. For analysis, the results of the breathalysing were classified as BAC positive yes/no (i.e. a BAC ≥0.001%) and BAC contributory yes/no (i.e. a BAC ≥0.05%).
The focus of this study is the self-reported flood-related behaviour of river users in Australia. Respondents were asked two questions on flood-related behaviour: ‘Have you ever driven through floodwaters?’ and ‘Have you ever swum in a flooded river?’ Respondents could answer yes or no. This study forms part of a wider study on river usage 15 and alcohol consumption 6, 16.
The survey was administered as both paper-based forms and online through SurveyGizmo (www.surveygizmo.com) using iPads. Those surveys completed on paper were then transferred into SurveyGizmo on the same day the paper-based survey was undertaken. The final dataset was downloaded from SurveyGizmo into IBM SPSS V20 for analysis. To check accuracy of data entry, every tenth paper-based survey (n=56) was checked (by authors AEP and RCF). This resulted in the checking of 56 x 34 questions, resulting in a 0.7% error rate. These errors were corrected prior to analysis.
In SPSS, remoteness classification of the respondent’s postcode was coded using the Australian Standard Geographical Classifications (ASGC) 17. Residential postcode was coded to its remoteness classification using the Doctor Locator website (www.doctorconnect.gov.au).
Residential postcode of the respondent was also coded to the Index of Relative Socio-economic Advantage and Disadvantage (IRSAD) 18. The Index is ranked from 1-10, with a low score indicating relatively greater disadvantage (e.g. many people with low incomes and many people in unskilled occupations), compared to a high score which indicates a relative lack of disadvantage. For ease of analysis, IRSAD was categorised as low (rank 1-3), high (rank 8-10) and other/unknown.
Univariate analysis was undertaken as was chi square analysis with a 95% confidence interval (p<0.05). Chi square analysis was run using yes or no for each flood-related behaviour. Chi square analysis excluded the unknown variable.
Ethics approval for this study was granted by the James Cook University Human Research Ethics Committee (HREC – H7249).
Results
Of the 688 people surveyed, 98.3% (n=676) answered the question about driving through floodwaters and 98.0% (n=674) answered the swimming in a flooded river question. There were 35.7% of respondents who had driven through floodwaters. Males (43.9%) were more likely to have driven through floodwaters than females (27.8%) (X2=19.0; p<0.001) (Figure 1).

Fig. 1: Figure 1: Two flood-related behaviours by sex of river users surveyed
People aged 75+ years (42.9%), 65-74 year olds (40.7%) reported the highest proportion of respondents, who had driven through floodwaters; however age group did not impact likelihood of having driven through floodwaters. (Table 1)
Please note the unknown variable was excluded from chi square analysis
Total
Driven through floodwaters – yes
Driven through floodwaters – no
X2 (p value)
N
%
N
%
N
%
Total
676
100.0
241
35.7
435
64.3
–
Sex
Male
326
48.1
143
43.9
183
56.1
18.969 (p<0.001)
Female
350
51.9
98
27.8
254
72.2
Age group
18-24 years
190
28.1
67
35.3
123
64.7
0.017 (p=0.895)
25-34 years
144
21.3
55
38.2
89
61.8
0.516 (p=0.473)
35-44 years
124
18.3
44
35.5
80
64.5
0.002 (p=0.966)
45-54 years
120
17.8
38
31.7
82
68.3
1.010 (p=0.315)
55-64 years
64
9.5
23
35.9
41
64.1
0.003 (p=0.960)
65-74 years
27
4.0
11
40.7
16
59.3
0.318 (p=0.573)
75+ years
7
1.0
3
42.9
4
57.1
0.160 (p=0.689)
Country of birth
Australia
571
84.5
216
37.8
355
62.2
7.598 (p=0.006)
Outside of Australia
105
15.5
25
23.8
80
76.2
Remoteness classification of residential postcode
Major Cities
123
18.2
34
27.9
89
73.0
4.906 (p=0.027)
Inner Regional
388
57.4
143
36.9
245
63.1
0.130 (p=0.718)
Outer Regional
136
20.1
58
42.6
78
57.4
2.999 (p=0.083)
Remote and Very Remote
6
0.9
2
33.3
4
66.7
0.023 (p=0.880)
Unknown
23
3.4
4
17.4
19
82.6
–
IRSAD classification of residential postcode
Low
117
17.3
42
35.9
75
64.1
0.877 (p=0.349)
High
113
16.7
34
30.1
79
69.9
Other/Unknown
446
66.0
165
37.0
281
63.0
–
Alcohol contributory (BAC ≥0.05%)
Yes
49
7.2
28
57.1
21
42.9
10.855 (p=0.001)
No
627
92.8
213
34.0
414
66.0
Respondents born in Australia were significantly more likely to have driven through floodwaters (37.8% yes; X2=7.6; p=0.006). Respondents residing in outer regional areas had the highest proportion of people driving through floodwaters (42.6%) compared to major cities (27.9%), with residents of major cities significantly less likely to have performed the behaviour (X2=4.9; p=0.027). Respondents classified as residing in low IRSAD areas reported a slightly higher proportion of respondents having driven through floodwaters (low 35.9%; high 30.1%). (Table 1)
Nineteen percent (19.2%) of those who self-reported having driven through floodwaters recorded a positive BAC reading, with 60.9% of those recording a BAC at contributory levels. Those who had driven through floodwaters were significantly more likely to record a BAC at contributory levels (X2=10.9; p=0.001). (Table 1)
Of all respondents to the swimming in a flooded river question, 18.7% stated they had swum in a flooded river. Males were significantly more likely to have swum in a flooded river (X2=26.5; p<0.001). Respondents aged 18-24 years were significantly more likely to self-report having ever swum in a flooded river (X2=17.9; p<0.001), while 45-54 year olds were significantly less likely to report having done so (X2=12.0; p=0.001). (Table 2)
Please note the unknown variable was excluded from chi square analysis.
Total
Swum in a flooded river – yes
Swum in a flooded river – no
X2 (p value)
N
%
N
%
N
%
Total
674
100.0
126
18.7
548
81.3
–
Sex
Male
326
48.4
87
26.7
239
73.3
26.537 (p<0.001)
Female
348
51.6
39
11.2
309
88.8
Age group
18-24 years
191
28.3
55
28.8
136
71.2
17.893 (<0.001)
25-34 years
143
21.2
33
23.1
110
76.9
2.294 (p=0.13)
35-44 years
124
18.4
18
14.5
106
85.5
1.745 (p=0.186)
45-54 years
120
17.8
9
7.5
111
92.5
12.036 (p=0.001)
55-64 years
63
9.3
6
9.5
57
90.5
3.845 (p=0.050)
65-74 years
26
3.9
2
7.7
24
92.3
2.154 (p=0.142)
75+ years
7
1.0
3
42.9
4
57.1
2.717 (p=0.099)
Country of birth
Australia
571
84.7
113
19.8
458
80.2
2.950 (p=0.086)
Outside of Australia
103
15.3
13
12.6
90
87.4
Remoteness classification of residential postcode
Major Cities
122
18.1
21
17.2
101
82.8
0.084 (p=0.772)
Inner Regional
388
57.6
54
13.9
334
86.1
11.462 (p=0.001)
Outer Regional
136
20.2
43
31.6
93
68.4
21.086 (p<0.001)
Remote and Very Remote
5
0.7
0
0.0
5
100.0
1.116 (p=0.291)
Unknown
23
3.4
8
34.8
15
65.2
–
IRSAD classification of residential postcode
Low
115
17.1
20
17.4
95
82.6
0.448 (p=0.503)
High
113
16.8
16
14.2
97
85.8
Unknown
446
66.2
90
20.2
356
79.8
–
Alcohol contributory (BAC ≥0.05%)
Yes
49
7.3
19
38.8
30
61.2
13.913 (p<0.001)
No
625
92.7
107
17.1
518
82.9
Inner regional dwelling respondents were significantly less likely to have swum in a flooded river (X2=11.5; p=0.001); whereas those residing in outer regional areas were significantly more likely to have done so (X2=21.1; p<0.001). Country of birth and IRSAD did not significantly impact likelihood of having swum in a flooded river. (Table 2)
Twenty-two percent (22.2%) of those who self-reported ever swimming in a flooded river recorded positive BAC readings when breathalysed. Of these, 67.9% recorded BACs at contributory levels. There was a statistically significant link between those who reported having swum in a flooded river and both positive BACs (X2=4.4; p=0.037) and BACs at contributory levels (X2=13.9;p<0.001). (Table 2)
Discussion
Flooding is one of the most deadly, and costly, of all natural disasters 2, 3, the frequency of which is likely to increase due to climate change 19. Minimising the impact of such disasters, including people’s interaction with floodwaters, will reduce loss of life. This study found that 36% of river users surveyed had driven through floodwaters and 19% had swum in a flooded river. Both activities were more common among males, with 18-24 year olds and people residing in outer regional areas significantly more likely to report having swum in a flooded river. There was a statistically significant link found between respondents who self-reported having participated in both risk flood-related behaviours and recording BACs at contributory levels when breathalysed at the river.
The movement of people during floods is a challenge for those living in rural Australia. Previous research 20, 21,22, 23 exploring factors impacting driving through and avoiding driving through floodwaters, has highlighted the issue of fatigue, a particularly important factor as an alternate route can add significant time to a journey and thus tempt drivers to cross flooded roads 20. Reduced investment in infrastructure such as bridges in regional and remote areas 24 may also contribute to an increased need to drive through floodwaters.
Simply discouraging people from driving through floodwaters is unlikely to be practical in rural Australia, particularly in areas with regular low-level flooding. More effective prevention strategies may include improved education on when it is safe to drive through (low depth, still water, stable road base) and when it is not (e.g. deep water, moving water and unstable road base). However there are challenges in identifying a stable road base and current prevention messages take a didactic approach advising “If it’s flooded, forget it” (https://floodwatersafety.initiatives.qld.gov.au/) and not to drive through.
Outer regional residents were found to have the highest proportion of respondents who self-reported having ever driven through floodwaters, as well as being significantly more likely to have previously swum in a flooded river. This may be due to the lack of infrastructure, lower initial awareness of the risk or over-familiarity with flooding leading to an underestimation of the risk. The link between participation in risky flood-related behaviours and outer regional residents requires further investigation.
Internationally, males are overrepresented in drowning statistics 5, accounting for 80% of fatal drownings overall, and fatal river drowning in Australia 6. Males have been identified as having poorer swimming skills 25 and lower levels of water safety knowledge than their female peers 26, as well as being more prone to risk-taking behaviour 27, 28. However, this proportion is higher than the proportion of 60% male for flood-related fatalities due to driving through floodwaters 7, although it reflects the number of people reporting in this study (i.e. the 59% of male respondents to this survey who reported having driven through floodwaters). Thus highlighting that the risk is about exposure (i.e. driving through floodwaters) rather than related to the sex of the person who drowns. While different messaging for each sex may be appropriate for the effective delivery of prevention messages, there is a need for strategies to mitigate the likelihood of people driving through floodwaters targeted at flood-prone locations, regardless of gender.
Although age was not found to be a statistically significant indicator of likelihood of having driven through floodwaters, respondents in the oldest age groups recorded the highest proportion of respondents who had undertaken the activity, with 43% of 75+ year olds and 41% of 65-74 year olds self-reporting having driven through floodwaters. As the questionnaire did not define a timeframe within which to have performed the activity (i.e. had the respondent ever driven through floodwaters), this may reflect a relatively greater number of flood seasons through which the respondent has lived and therefore, had the opportunity to drive through floodwaters, rather than any riskier behaviour being undertaken by the older age group. Further research may be warranted exploring attitudes towards driving through floodwaters among the older age group.
This study identified one in five respondents had swum in a flooded river. Unlike driving through floodwaters where as people aged, the likelihood of driving through floodwater increased (greater chance of encountering floodwater), young people (18-24 years) were more likely to report swimming in a flooded river. This dichotomy may suggest an element of risk-taking in youth, however this appears to be a recent activity, as older people were less likely to report swimming in floodwaters. Swimming in floodwaters is a poorly understood behaviour with little previous research. The survey tool did not examine the context within which the respondent had swum in a flooded river (e.g. out of necessity, skylarking or performing a rescue). Further research should examine the reasons behind this behaviour. With those residing in outer regional areas found to be more likely to have swum in a flooded river, prevention strategies must take into account the regional and remote context 29.
Alcohol is a known risk factor for drowning and aquatic-related injury 30. This study identified a statistically significant link between alcohol consumption, in particular respondents recording BACs at contributory levels, and self-reported participation in both risky flood-related behaviours being analysed. While the survey questionnaire did not ask if the respondent was under the influence of alcohol at the time of participating in these risky flood-related behaviours, it may be that alcohol contributes to a person’s decision to take risks in and around floodwaters. This is worthy of further research to better understand the motivations underlying a person’s decision to interact with floodwaters in such a way. Such information will add a helpful layer to the development of preventative messaging and campaigns 23.
As with all self-reported surveys there are limitations. These include recall bias, the survey being administered in English and the survey not defining what was meant by floodwaters (for driving through) or a flooded river (for swimming). Respondent were asked if they had ‘ever’ undertaken the two flood-related behaviours, and as such caution should be used when interpreting the age group analysis as the age at which the behaviours were performed was not captured. This study did not examine frequency of the behaviours undertaken. This was a cross-sectional study and does not determine cause and effect. The sample was a random convenience sample and therefore results represent the views of those attending the four river locations only. The survey was administered in the summer and wet season months and may impact recall. Refusals were not recorded.
Conclusion
Preventing drowning in floodwaters is an international challenge, made more difficult by people driving through, or swimming in, floodwaters. Practical strategies to reduce loss of life due to driving through floodwaters are required, including skills to assess the risk and make informed decisions on when it is safe to drive through and when it is not. Swimming in floodwaters is a little researched topic. While this study has identified one in five people have undertaken the behaviour, commonly at a young age, there is a need for further research to understand the context of the behaviour and the motivations for engaging in it, including the role of alcohol. Such knowledge would allow for effective, regionally-specific drowning prevention strategies to be developed, targeting those most at-risk, in order to reduce loss of life during times of flood.
Data Availability Statement
Due to ethical constraints imposed by the Ethics Committee that granted approval for this study, the data is unable to be publicly uploaded. Data requests can be made by contacting [email protected] and quoting the ethics approval number H7249.
Competing Interests Statement
The authors have declared that no competing interests exist.
Corresponding Author
Amy Peden, Royal Life Saving Society – Australia and James Cook University ([email protected])
Methods: PubMed, Google Scholar, and the Cochrane Library were searched from September, 2001 through July, 2016. Reviewers identified eligible studies and synthesized odds ratios (ORs) using a random-effects model.
Results: The meta-analysis included findings from 7 studies (29,930 total subjects). After adjusting for multiple comparisons, depressive symptoms were significantly associated with minority race/ethnicity (OR, 1.40; 99.5% Confidence Interval [CI], 1.04 to 1.88), lower income level (OR, 1.25; 99.5% CI, 1.09 to 1.43), post-9/11 social isolation (OR, 1.68; 99.5% CI, 1.13 to 2.49), post-9/11 change in employment (OR, 2.06; 99.5% CI, 1.30 to 3.26), not being married post-9/11 (OR, 1.59; 99.5% CI, 1.18 to 2.15), and knowing someone injured or killed (OR, 2.02; 99.5% CI, 1.42 to 2.89). Depressive symptoms were not significantly associated with greater age (OR, 0.86; 99.5% CI, 0.70 to 1.05), no college degree (OR, 1.32; 99.5% CI, 0.96 to 1.83), female sex (OR, 1.24; 99.5% CI, 0.98 to 1.59), or direct exposure to WTC related traumatic events (OR, 1.26; 99.5% CI, 0.69 to 2.30).
Discussion: Findings from this study suggest that lack of post-disaster social capital was most strongly associated with depressive symptoms among the civilian population after the 9/11 WTC terrorist attacks, followed by bereavement and lower socioeconomic status. These risk factors should be identified among civilians in future disaster response efforts.
]]>Introduction
The mental health consequences of the September 11, 2001 (9/11) World Trade Center (WTC) terrorist attacks in New York City (NYC) have been the focus of a substantial number of research endeavors over the past 15 years.1 A majority of this research has documented the etiology, prevalence, treatment, and risk factors for posttraumatic stress disorder (PTSD) in particular, as PTSD is reported to be the most common post-disaster associated condition.2 According to the Fifth Edition of the Diagnostic and Statistical Manual of Mental Disorders (DSM-5), PTSD is a conditional disorder that can develop among individuals after a qualifying trauma exposure.3 Qualifying trauma exposure must result from directly experiencing a traumatic event, being an eyewitness to trauma as it occurred to others, learning that a close associate suffered from a traumatic event, or experiencing repeated or extreme exposure to aversive details of a traumatic event.3
Probable depression is another commonly studied post-disaster mental health outcome. Probable depression refers to a positive screen on a depression symptom screening instrument, such as the Patient Health Questionnaire.4,5 PTSD and probable depression among trauma-exposed groups of the WTC terrorist attacks have been thoroughly described.6,7,8,9,10 Examples of frequently studied trauma exposed groups include firefighters, police, emergency medical technicians, first responders, and recovery and cleanup workers.
In contrast to trauma-exposed groups, the general civilian population of NYC, comprised of survivors, NYC residents, people working in the area, and passers-by on the day of the attacks, is an example of a mixed-exposure group. After the WTC terrorist attacks, members of the civilian population suffered from varying levels of exposure to trauma. Many of these exposures may have not met DSM-5 trauma exposure criteria.11,12 The general civilian population is not always included in studies of prevalence estimates and risk factors for post-disaster PTSD and probable depression because disaster mental health research is typically interested in understanding mental disorders in relation to trauma exposure.13 In particular, comprehensive analyses of post-disaster probable depression among civilians are lacking in the literature.
The unpredictable nature of terrorist attacks have introduced new definitions of affected populations in disaster mental health research, as the purpose of terrorism is to invoke fear and anxiety among civilians in general.14 Moreover, probable depression is not dependent on qualifying trauma exposure, so the population susceptible to probable depression after a disaster such as a terrorist attack is larger than the population susceptible to PTSD.5 Carefully identifying risk factors for probable depression among the civilian population that were associated with the 9/11 WTC terrorist attacks may better inform future disaster preparation efforts.
Over the past 15 years, a number of studies have screened for probable depression among affected populations and stratified their analysis of trauma-exposed groups and civilians, or sampled cohorts of civilians specifically.15,16,17,18,19,20,21 The aim of this study was to synthesize the results from research on 9/11-affected survivors, residents, and passers-by, summarize the influence of probable depression among these cohorts, and evaluate the associations between probable depression and various risk factors.
Methods
Search Strategy
We conducted a meta-analysis following the Preferred Reporting Items for Systematic Reviews and Meta-Analyses (PRISMA) Statement.22 PubMed, Google Scholar, and the Cochrane Library were searched without language restriction from September, 2001 through July, 2016. Search terms included “World Trade Center”, “WTC”, “World Trade Center Disaster”, “WTCD”, “September 11”, “9/11”, “Depression”, “Major Depression”, “Probable Depression”, and “Mental Health” in various relevant combinations. Both published and unpublished sources of data were considered. References of studies and review articles were also manually searched to yield additional studies not found through the original search.
Study Inclusion/Exclusion Criteria
Two reviewers (A.C., and S.B.) screened the search results for eligibility. Disagreements between reviewers regarding the inclusion or exclusion of a study were resolved by a third reviewer (J.P.). Studies were eligible based on the following inclusion criteria: 1) original research article; 2) focused on the effects of the WTC terrorist attacks; 3) focused on adult populations based on age at the time of interview; 4) focused on civilians or reported separate analysis of civilians; 5) screened for depression using validated diagnostic criteria; 6) documented probable depression prevalence (number of patients in the cohort screening positive for depressive symptoms) or odds ratio (OR) among civilians in response to pre-defined risk factors; and 7) conducted within the NYC metropolitan area.
Data Extraction
Reported risk factors for probable depression were extracted and compared across studies. Our main exposure variables consisted of only risk factors that were similarly defined among at least two studies included in the meta-analysis. Probable depression prevalence, ORs, and standard errors corresponding to each risk factor were then extracted from each study. Our primary outcome was the OR for the association between the development of depression symptomatology and each risk factor. All ordinal and categorical risk factor variables were dichotomized to simplify outcome synthesis; the Cochran-Mantel-Haenszel method was used to evaluate ORs based on probable depression prevalence among combined groups and Woolf’s method was used to combine weighted averages of log ORs.23,24 Other data elements that were extracted from each article were author surname, publication year, inclusion criteria, method and time period of cohort recruitment, sample size, baseline demographic characteristics of the sample, and overall prevalence of depressive symptoms.
Statistical Analysis
We used the DerSimonian and Laird (DL) random-effects model25 to calculate pooled ORs and corresponding standard errors for each included risk factor. These pooled estimates were interpreted as summary effect sizes that expressed the common odds of screening positive for probable depression with the presence of a risk factor, versus absence of a risk factor. Weights were calculated by the inverse variance method.
Heterogeneity across studies was investigated by the Cochran Q test and measured using I² and H² statistics. We interpreted I² values of 0-25%, 26-50%, 51-75%, and 76-100% as unimportant, moderate, substantial, and considerable heterogeneity, respectively.26 Publication bias was evaluated visually by examining symmetry in funnel plots. Egger regression27 and the Begg-Mazumdar test28 were used to quantify asymmetry by providing an estimate of correlations between effect sizes and corresponding variances. All analyses were performed using R software version 3.2.3 with the metafor package.29
We conducted sensitivity analysis by stratifying studies by the type of diagnostic criteria used and the recruitment period midpoint. This allowed us to evaluate whether structured diagnostic interviews and symptom screening instruments yielded different findings, and whether more recent event exposure had a stronger influence on depressive symptoms. Prevalence estimates were weighted for the sample size of each study within a particular strata and averaged. Variance weighted least squares regression was used to test for temporal trend. Sensitivity analysis was also conducted by assessing how responsive our summary measures were to individual data. We repeatedly fit the DL model for each risk factor while censoring one study at a time.30
To account for multiple tests, corresponding to the number of risk factors identified, we applied the Bonferroni correction31 to adjust the width of our confidence intervals (CIs) while testing for significance. Associations were considered significant at an α = 0.05/10 = 0.005 level.
Results
Electronic Search and Selection of Studies
We screened 2,103 search results and excluded 2,058 articles on the basis of their titles or abstracts for not being WTC related, not being an original research article, or not investigating depression symptomatology (Figure 1). We then identified 5 additional studies after screening references of reviews. Of the remaining 50 studies, 43 were excluded for using self-reported prior diagnosis or unclear screening measures of depression (n = 7), not reporting sufficient data that could be pooled for analysis (n = 11), focusing solely on responders or not separating civilians in their analysis (n = 19), using a sample that overlapped with another study and reported the same risk factors (n = 5), or not being conducted within the NYC metro area (n = 1). The remaining seven studies met the inclusion criteria for our meta-analysis.

Fig. 1: PRISMA Flow Diagram of Study Selection
Study Characteristics
The 7 studies included were prospective cohort studies of civilians with sample sizes ranging from n = 149 to n = 22,026 (Table 1). Each study cohort was recruited independently from the civilian population, making the possibility of subjects participating in multiple studies, or overlap in the samples, unlikely. Study cohorts were also recruited at different times, and the mid-point of their recruitment periods were on average 2.94 years post 9/11.
Table 1: Baseline Characteristics of Studies that Satisfied the Inclusion Criteria
Across studies, the average age of subjects at the time they were interviewed was 44.5 years, 61% were non-Hispanic white, and 54% were female. Probable depression prevalence ranged from 9.4% to 31.0%, and the overall prevalence was 15.9%. Of the 7 studies, 4 used a full Structured Clinical Interview for DSM-IV (SCID), which is considered the gold standard for diagnosing Major Depressive Disorder.32 The remaining studies used screening instruments to identify depression symptomatology, which is why we refer to our outcome as “probable depression” rather than as “clinically diagnosed depression”. The three studies reporting probable depression all used different screening instruments. Results from Caramanica et al. were adapted using Wave 3 of the WTC Health Registry,16,20 which used the 8-item Patient Health Questionnaire (PHQ-8), applying a cutoff at scores ≥ 10. This criteria has been shown to have sensitivity = 0.99 and specificity = 0.92 relative to SCID.33 Boscarino et al.17 used the Brief Symptom Inventory-18 (BSI-18), which has been shown to have sensitivity = 0.71 and specificity = 0.87,34 and Neria et al.18 used the Primary Care Evaluation of Mental Disorders (PRIME MD) Questionnaire, which has been shown to have sensitivity = 0.85 and specificity = 0.75,35 all relative to structured clinical interviews.
Identification of Risk Factors
There were 10 risk factors that were reported in more than one study. These 10 risk factors were divided into 3 categories: baseline demographic characteristics, post-disaster attributes, and exposure characteristics. Demographic characteristics included greater age, female sex, minority race/ethnicity (non-white or Hispanic/Latino ethnicity), no college degree, and lower income level. Post-disaster attributes included post-9/11 social isolation, post-9/11 change in employment status, and not being married post-9/11 at the time of interview. Exposure characteristics included knowing someone injured or killed during the attacks and direct exposure to 9/11 traumatic events.
Not all risk factors were defined identically in each study. No college degree, minority race/ethnicity, post 9/11 social isolation, not being married post-9/11, and direct exposure were reported both as multilevel categorical variables and as dichotomous variables comparing the presence of a risk factor to its absence. To facilitate pooling together these results, multi-level variables were dichotomized.
Association between Probable Depression and Risk Factors
Among the baseline demographic risk factors, only minority race/ethnicity (OR, 1.40; 99.5% CI, 1.04 to 1.88) and lower income level (OR, 1.25; 99.5% CI, 1.09 to 1.43) were significantly associated with elevated odds of probable depression (Figure 2). The pooled ORs for greater age (OR, 0.86; 99.5% CI, 0.70 to 1.05), female sex (OR, 1.24; 99.5% CI, 0.98 to 1.59), and no college degree (OR, 1.32; 99.5% CI, 0.96 to 1.83) indicated that these risk factors were not significantly associated with odds of probable depression.

Fig. 2: Forest Plot of Odds Ratios Stratified by Risk Factor.
All three post-disaster attributes (social isolation, change in employment, and not being married) were significantly associated with elevated odds of probable depression, and their pooled ORs were among the largest summary effect sizes of the ten evaluated. The largest effect size in this category was the pooled OR for post-9/11 change in employment status (OR, 2.06; 99.5% CI, 1.30 to 3.26). The second largest effect size in this category was the pooled OR for social isolation (OR, 1.68; 99.5% CI, 1.13 to 2.49), and the smallest effect size was the pooled OR for not being married post-9/11 (OR, 1.59; 99.5% CI, 1.18 to 2.15).
Knowing someone injured or killed by the attacks and direct exposure to traumatic events were classified as exposure characteristics. The former significantly increased odds of probable depression (OR, 2.02; 99.5% CI, 1.42 to 2.89) while the latter was not significantly associated with probable depression (OR, 1.26; 99.5% CI, 0.69 to 2.30).
Sensitivity Analysis for Diagnostic Criteria, Time from Disaster, and Removal of Individual Data
Out of the 7 studies included, 4 used full structured diagnostic interviews and 3 used symptom screening instruments. Studies using symptom screeners detected higher rates of probable depression prevalence (Table 2). All associations for risk factors that were statistically significant in the primary analysis remained statistically significant in both sub-groups of diagnostic criteria. Additionally, while the magnitude of the estimates remained comparable, in the sensitivity analysis female sex was a significant risk factor based on structured interviews, and lack of college degree and direct exposure were significant risk factors among studies that used symptom screeners.
Table 2: Study Outcomes Stratified by Type of Diagnostic Instruments Used
We evaluated the prevalence of probable depression among all civilians included in studies that conducted interviews (midpoint of interview period) within a particular year (Supplementary Table). Although there were few studies included for each year, there was no significant temporal trend in depression prevalence (P = 0.25). We also assessed how stable our results were by evaluating the DL model for each risk factor after removing one study at a time (Table 3). This was only conducted for risk factors where results from more than two studies were synthesized. The female sex, minority race/ethnicity, no college degree, lower income level, and not being married post 9/11 risk factors lost or gained significance after removal of an individual study, however, all point estimates remained within the 95% confidence intervals of the original pooled estimates.
Table 3: Leave-One-Out Sensitivity Analysis for Each Risk Factor
Publication Bias
Visual inspection of funnel plots for each risk factor and for all studies combined did not reveal any notable publication bias (Supplementary Figures 1 & 2). Additionally, neither the Begg-Mazumdar rank correlation test (Kendall’s τ = 0.19, P = 0.10) nor the Egger regression test (z = 1.06, P = 0.29) detected statistically significant publication bias, although it is possible that the small number of included studies limits the power of this test.
Discussion
This study draws attention to probable depression after the 9/11 WTC terrorist attacks among civilians in the NYC metro area. We meta-analyzed effect sizes for various factors associated with probable depression from studies conducted over the past 15 years. Our analysis identified baseline demographic characteristics, exposure types to the WTC terrorist attacks, and post-disaster attributes, and quantified their association with post-9/11 probable depression.
The prevalence of probable depression varied considerably across studies included in our meta-analysis. This can partly be attributed to differences in the characteristics of each cohort and the type of diagnostic criteria employed. We observed disparities between results yielded by symptom screening instruments and full structured diagnostic interviews that could have implications for future studies of post-disaster probable depression. Symptom screening instruments, which generally have high sensitivity for diagnosis of major depression,33,34,35 detected higher rates of overall probable depression prevalence (16.6%) compared to full structured diagnostic interviews (11.7%). Moreover, although all risk factors that were significantly associated with probable depression in the primary analysis remained significant in the sensitivity analysis, the associations for some risk factors, including female sex, no college degree, and direct exposure, were not consistent across diagnostic criteria. The magnitude of these differences were small, however, and can partially be explained by high heterogeneity or lack of power since just two studies were present in subgroups that were inconsistent with the primary analysis.
Of the baseline demographic characteristics that we evaluated, only being of a minority race/ethnicity and earning lower income were significantly associated with elevated odds of probable depression. Since race/ethnicity and income are known to correlate with socioeconomic status,36 our results may indicate an important association between post-disaster socioeconomic status and elevated risk of probable depression after a terrorist attack among civilians. Minority race/ethnicity has also been reported to be a risk factor for probable PTSD and depression among responders.6,7,8 Taken together, lower socioeconomic status could be used to identify target populations of mental health interventions so that the effect of intervention is maximized.
We also evaluated the association between WTC terrorist attack-related experiences and probable depression by focusing on two types of exposures: direct exposure to trauma, or knowing someone killed or injured by the attacks. Suffering the latter did not require being physically present in the vicinity of the attacks while they occurred, however, it was still significantly associated with elevated odds of probable depression. This finding strengthens evidence that probable depression may not be geographically constrained to the area affected after a disaster,13 and that bereavement may play an important role in driving the development of probable depression associated with terrorist attacks.18 Furthermore, the finding that direct exposure to 9/11 trauma was not significantly associated with elevated odds of probable depression suggests that terrorist attacks that expose few civilians directly to trauma may still lead to meaningful community-wide depressive symptoms.
An important limitation surrounding our discussion of the association between trauma exposure and probable depression is the definition of traumatic exposure that each study used. The studies included in this meta-analysis mainly found that traumatic exposure was not significantly associated with elevated odds of probable depression, but studies that used lenient definitions of what constituted trauma may have underestimated this association. We found, however, that the North et al.13 study used the most stringent definition of exposure to trauma, using “careful categorization of 9/11 trauma exposures based on the DSM-IV-TR definition,” and still did not find a significant association between exposure to trauma and elevated odds of probable depression. As categorization of trauma became more careful and strict among the studies included in this meta-analysis, the effect size for its association with probable depression did not increase. Therefore, it is difficult to argue that inconsistent criteria for what constituted trauma in different studies explains the lack of association with elevated odds of probable depression observed.
We also classified social isolation, post-9/11 change in employment status, and not being married post-9/11 as post-disaster attributes and identified their association with probable depression. Social support is the perception that one belongs to a supportive social network and has access to a variety of social integration sources.37 In the studies we encountered, social support was reported as the perceived number of social integration sources and was variably categorized. Our results suggest that a lack of social support, or social isolation, may play an important role in the development of probable depression after a terrorist attack; civilians without social support suffered 68% increased odds of probable depression after the WTC terrorist attacks. Similar results were observed for post-9/11 change in employment status and not being married post-9/11 as risk factors. The magnitudes of the pooled ORs for these three risk factors were among the four largest of the ten summary effect sizes evaluated in our study. Social integration resources, employment, and marriage are pivotal forms of social capital that influence how psychological stress affects civilians.38 We found that access to these resources generally had a stronger association with probable depression than exposure or baseline demographics after the 9/11 WTC terrorist attacks. The causal direction of this association, however, remains uncertain as social capital and probable depression were both measured at the same time in the studies included.
These results must also be interpreted in the context of the study’s limitations. Primarily, we could not include pre-existing psychopathology as a risk factor due to large inconsistencies in how studies addressed it when reported. Pre-existing psychopathology has been strongly associated with post-disaster depression and other mental health outcomes.5,30 Its exclusion is not intended to undermine the need to consistently identify, screen, and triage patients with pre-existing mental disorders requiring treatment after a disaster such as a terrorist attack. Second, we could not consistently adjust for several confounding factors, such as prior trauma, when calculating ORs from reported data in the included studies. Some studies adjusted for covariates and provided adjusted ORs, but these adjustments may vary for the included studies. Third, there was between-study variability in the time of cohort recruitment and questionnaire administration. Although we evaluated the influence of more recent event exposure in a sensitivity analysis and could not discern a significant trend in depression prevalence among cohorts with less recent event exposure, there may have been unaccounted confounding with cohort characteristics and specific risk factors. Fourth, we observed high heterogeneity in specific subgroups when calculating pooled ORs. This may stem from individual variation in the effect of the risk factor, but it also may be caused by variation in the original classification of risk factors among different studies. Being able to differentiate between the influence of being a direct eyewitness to trauma and being physically harmed during the events would have been useful in this context. Differentiating between changes in employment status that were related to the WTC terrorist attacks, versus changes in employment status that occurred for other reasons, is another example of how having more specific classification of risk factors in different studies may have strengthened our analysis.
Conclusions
This meta-analysis identified risk factors for probable depression associated with the WTC terrorist attacks among mixed-exposure groups from the civilian population in the NYC metro area that was not directly involved in rescue or recovery efforts. We found that social isolation, change in employment, and not being married after the WTC terrorist attacks were three of the four most strongly associated risk factors for probable depression. Furthermore, we found that direct exposure to WTC related traumatic events was not significantly associated with probable depression, while knowing someone injured or killed by the attacks was. Knowing someone injured or killed was the second most strongly associated risk factor for probable depression in this meta-analysis, suggesting that probable depression among civilians after a terrorist attack may primarily be bereavement driven. Finally, we identified minority race/ethnicity and lower income as the only baseline demographic characteristics that predicted elevated odds of probable depression. This association suggests that further efforts are necessary to understand and address the influence of socioeconomic status and probable depression among civilians after terrorist attacks.
Our analysis allows for a better understanding of the associations between probable depression and risk factors among civilians who were not involved in rescue or recovery efforts by providing quantitative estimates for each association. The strong association between lack of social capital and depressive symptoms suggests that monitoring employment status and the availability of support should be points of focus in future studies and intervention efforts. We further recommend that persons of lower socioeconomic status or difficulties coping with bereavement receive greater attention, irrespective of exposure to trauma, after terrorist attacks. These efforts could improve the efficiency at which high-risk persons from the civilian population are identified in future mental health interventions and disaster response efforts.
Corresponding Author
Abhinaba Chatterjee
Department of Healthcare Policy and Research
Weill Cornell Medicine
402 E 67th St
New York NY, USA 10065
Email: [email protected]
Funding
This work was supported in part by NIH R01 MH105384. The funders had no role in study design, data collection and analysis, decision to publish, or preparation of the manuscript.
Competing Interests
The authors have declared that no competing interests exist.
Data Availability
All relevant data are reported in the manuscript.
Ethics Statement
This analysis used only de-identified, publicly available, and previously published data sources. The need for informed patient consent was waived by the institutional review board and ethical committee at Weill Cornell Medicine.
Appendix
Supplemental Figure 1. Funnel plot of all effect sizes extracted from studies included.
Supplemental Figure 2. Funnel plots of effect sizes for each risk factor.
Supplemental Table. Temporal Trend in Prevalence of Probable Depression.
Methods. A survey of accessible areas, which were largely urban and government controlled, was undertaken from April - June 2016 to identify unmet needs and assistance priorities. A cluster design with probability sampling was used to attain a final sample of 2,405 households from ten of fourteen governorates; 31 of 65 (47.7%) districts were included that are home to 38.1% of people in need (PiN).
Results. Overall 45% of households received assistance in the preceding month; receipt of aid was lowest in al-Hasakeh (17%). Shelter was a concern, with 48% of households having shelter need(s); the unmet shelter needs were highest in the West Coast, Rif Damascus and al-Hasakeh. Food security was a major concern where 64% had unmet food needs and 65% at least one indicator of concern; food insecurity was most severe in Rif Damascus and the West Coast. Water was also a concern with 36% of households reporting inconsistent access and 48% no access to water for several day periods; water needs were highest in Aleppo.
Discussion. This assessment included accessible populations in predominantly urban and government controlled areas, which are likely to have better access to services and fewer needs than populations in rural locations or areas not controlled by the government. The humanitarian situation in inaccessible and non-government controlled areas is likely to be considerably worse, thus findings should not be generalized. An expanded humanitarian response is desperately needed for Syrians to better endure the conflict.
]]>Introduction
With an estimated 13.5 million people in need (PiN) of humanitarian assistance and 6.6 million internally displaced people (IDPs), Syria is the country with the world’s largest IDP population and among the most severe ongoing emergencies.1,2 At the start of 2016, of the 13.5 million PiN, 6.5 million (48%) resided in areas controlled by the Government of Syria, 4.5 million PiN were in hard-to-reach areas, and an estimated 8.7 million people had acute needs across multiple sectors.2 Humanitarian needs are ever-increasing while an inability to maintain humanitarian corridors and ceasefires continue to limit assistance to populations in areas where needs are greatest.3,4 Many needs remain unmet, and if assistance is provided, it is often insufficient in terms coverage or quantities distributed; for those with multiple needs, assistance may be received in one sector whilst other needs remain unaddressed.5,6,7
The 2016 Syria Humanitarian Response Plan (HRP) set out three guiding objectives for the humanitarian response: (i) saving lives and alleviating suffering, (ii) enhancing protection, and (iii) building resilience.8 While the operational challenges to implementing a widespread response in an environment with poor security and access limitations are well known, financing is another less discussed barrier; only 33% of the nearly US$ 3.5 million needed to fund the 2016 Syria HRP is pledged.2,9 In light of the protracted nature of the conflict, immense humanitarian needs, and dearth of large-scale data, this assessment was undertaken to characterize unmet needs and inform humanitarian response in government controlled areas of Syria.
Methods
Sample size calculations were based on objectives of identifying unmet needs and assistance priorities and used the most conservative prevalence rate (50%), 80% power (1-β), and design effect of 1.5. A minimum sample of 1600, which allowed for ±3% precision, was increased to 2400 to provide increased power for regional comparisons. Few consistently reported and reliable population figures are available for Syria. A stratified multi-stage cluster design with probability proportional to size sampling was used, both because of challenges in attaining accurate population data and of the desire for region-specific estimates and comparisons. Accessible areas were divided into seven survey areas with, to the extent possible, PiN of similar size.
A 120 cluster x 20 household design was used; clusters were allocated using a stratified approach, where areas with larger PiN were assigned 20 clusters and smaller PiN 10 clusters to allow for similar probability of selection across areas. Within each area, clusters were assigned proportionally at district and sub-district levels using recent population data from the UN Office for the Coordination of Humanitarian Affairs which was perceived to be most reliable.10 The assessment incorporated ten of fourteen governorates (Deir-ez-Zor, ar-Raqqa, Idleb, and Quneitra were not accessible), however, not all areas of included governorates were accessible (Table 1).11In total, 31 of 65 (47.7%) districts were included that are home to 38.1% of PiN and a population of 4.1 million.2 Accessible areas were predominantly urban city centers (60%) with fewer clusters in peri-urban areas/remote cities (21%) and rural areas (19%). This distribution is reflective of the predominantly urban population (70%), high levels of urban need, and resulting urban-focused humanitarian response.8
Table 1. Overview of the Syrian Crisis, Affected Population and Assessment Coverage Areas
ARC GIS was used to identify random start points within sub-districts; those in unpopulated areas when reviewing Google Earth imagery were excluded. In developed areas, the nearest intersection, usually within 0.5km, served as the start point; the field team then reviewed start points to ensure accessibility. Every third household in several directions was sampled; replacement sampling was used and no more than two households within an apartment building were included. Back up coordinates were provided and an alternate start point used in the event that planned location was insecure.
To the extent possible, existing content from instruments used with Syrian populations was adapted to improve validity and comparability.1112,13,14,15,16 Pilot testing was conducted with Syrian refugees in Lebanon and in Damascus to ensure appropriateness of content and translation. A Training-of-Trainers approach was used where team leaders and study coordinators received five days of training in Lebanon; they later oversaw two days of interviewer training in their respective survey areas. Most interviewers and all team leaders had prior experience conducting humanitarian assessments in Syria.
The assessment was conducted between April and June 2016 by a US-Based international non-governmental organization (iNGO) and a Syrian partner with training and remote support from Johns Hopkins School of Public Health (JHSPH). Interviews ranged from 20 to 45 minutes. To protect anonymity, unique identifiers were not collected and verbal informed consent was used. Data was collected on tablets using the Magpi mobile data platform (Datadyne LLC, Washington, DC). Partner organizations’ staff supervised interviewers and JHSPH performed real-time data review to ensure quality.
Data was analyzed using Stata 13 (College Station, TX) with the ‘svy’ command to account for clustering. Exploratory analysis was conducted to assess if differing non-response rates (0-21%) needed to be accounted for and it was found unnecessary. Summary statistics were not weighted because sampling survey area probabilities were similar and confidence in data used to estimate probabilities low. Sectoral severity scales were developed based on key indicators; cut points were determined by reviewing point estimates and categorizing to attain a distribution. Severity levels were assigned based on select sectoral indicators and the proportion of the population identified as at risk/affected by one or more indicators.
The primary purpose of the assessment was to inform partners’ humanitarian programming and the assessment was conducted by partner organizations’ staff. Permissions to conduct the survey were attained from local community leaders as needed in Syria by partner organizations and survey supervisors. The Johns Hopkins School of Public Health Institutional Review Board determined that JHSPH was not engaged in human research because JHSPH had no interaction with human subjects and was not obtaining identifiable data.
Results
A total of 2,681 households were approached to participate, of which 10.3% (n=276) declined, yielding a final sample of 2,405 households (response rate=89.7%). The average household head was 51 years old (range 16-103) and 17.7% (CI:15.7-19.8) of households were female-headed. Educational attainment was low with 60.0% (CI:55.9-63.9) of household heads not completing secondary schooling. Less than half (42.7%, CI:37.8-47.7) of households were displaced and 2.0% (CI:1.1-3.5) were returnees. Average household size was 5.1 (CI:4.9-5.3, range 1-22). A majority of households (65.4%, CI:61.9-68.7) had children ≤17 years and 29.3% (CI:26.3-32.4) had children <5 years of age; 37.1% (CI:34.3-40.0) had older adults. The population age distribution is presented in Figure 1. The most common vulnerable group was those with chronic health conditions, reported by 43.3% (CI:40.5-46.1) of households; 12.6% (CI:11.1-14.2) had disabled members and 7.7% (CI:6.5-9.2) had pregnant or lactating women.
Figure 2. Age Distribution of the Population
Humanitarian Assistance and Unmet Needs. Humanitarian assistance was received by 45.1% of households in the preceding month; only 11.6% received multiple types of aid (Table 2, Figure 2). The most frequent assistance received were food items (42.7%) and hygiene kits (6.4%); ≤2.5% received aid in all other categories. Receipt of assistance differed significantly by region: more than half (52-57%) of households in Aleppo, Rif Damascus, the South, and the Central areas received assistance compared to 35% in Damascus and West Coast and 16.5% in al-Hasakeh (p<0.001). Unmet needs were nearly ubiquitous with 96.5% reporting one or more unmet need. The most frequently reported priority needs included more food (29.4%), rent support/improved shelter (15.4%), health services/medications (11.2%), improved security (10.8%) and better quality food (9.4%). Food (64.1%), non-food items (NFIs) (29.3%), health (26.8%), and shelter (24.4%) were the sectors with highest reported unmet needs. The proportion of households with unmet needs was similar across regions (p=0.208); however, priority needs varied by location (p<0.001). Of note were the large proportions in al-Hasakeh and Aleppo reporting food (70.0% vs 38.8% overall) and security (43.5% vs. 10.8% overall), respectively, as priority needs.
Figure 3. Severity of Humanitarian Assistance Needs by Sector and Region
Table 2. Receipt of Humanitarian Assistance and Unmet Needs
Shelter. Most households resided in an unshared houses or apartments (89.2%) with smaller proportions residing in unfinished buildings/construction sites/warehouses (4.8%), rented rooms (3.0%), or other accommodations (3.0%) (Table 3, Figure 2). More than half owned (56.3%) and many rented (31.8%) or were hosted (10.2%). Over half (62.1%) of households reported dwellings in good condition and 37.9% had a concern about their dwelling or needed shelter repairs; the most frequent problems included high humidity (27.0%), water leakage (10.4%), and poor ventilation (7.3%). Crowding was not a major concern; only 11.6% of households reported ≥5 people per sleeping room. Differences by geographic area were significant. The greatest need for repairs was in the West Coast (63.2%), crowding was most frequent in al-Hasakeh (30.5%), and a high proportion of Rif Damascus households (13.8%) lived in construction sites, unfinished buildings, or warehouses. Overall, shelter needs were greatest in the West Coast, al-Hasakeh, and Rif Damascus where more than half of households had at least one shelter indicator of concern.
Table 3. Shelter and Living Conditions
Food Security. Food security was assessed using the Food Consumption Score (FCS);12 7115.9% of households had an acceptable FCS (mean=55.2) (Table 4, Figure 2). Lack of food or insufficient means to buy food in the preceding month was reported by 38.1% and 56.7% reported no food stocks. Food assistance reliance was low with 72.4% reporting <25% of their diet from aid. Use of any and extreme coping strategies[1] in the preceding month were reported by 84.9% and 54.3% of households, respectively. Most frequent were reliance on less preferred/expensive foods (54.0%), spending savings (53.5%), credit/borrowing (40.1%) and reduced portion size (34.4%). A minority (12.8%) spent >75% of total expenditures on food. There were statistically significant differences in food security by region. Using FCS, food insecurity was highest in Rif Damascus, the Central and West Coast survey areas where 31.1-34.8%of households did not have an acceptable FCS. Both Rif Damascus and the West Coast had high prevalence of coping mechanism use with 67.5%-71.9% using extreme coping strategies. In al-Hasakeh, nearly half (47.7%) reported that >75% of total expenditures on food. Overall, food insecurity was most severe in Rif Damascus and the West Coast, moderate in Aleppo and the Central area, and lowest in Damascus and the South. In all areas, half to three-quarters (49.0-78.4%) of households were food insecure by one or more indicator making food insecurity the area of greatest unmet need.
Table 4. Household Food Security
Water & Sanitation. The most frequent drinking water source was an inside tap supplied by municipal water networks (79.6%) followed by paid tanker/truck water (11.8%); similarly, an inside tap was also the most frequent source of water for other purposes (90.4%) (Table 5, Figure 2). Water access was fair with 36.4% reporting not having access to water 24 hours a day; those without regular access reported having water for 12 hours daily. When running water was not available, sources included stored water (49.3%) or trucked water (34.3%); nearly all (97.9%) were able to store water and 72.5% had storage capacity >500L. Water access was perceived as a problem by 72.2% of households and nearly half (48.0%) reported no access for several days at a time in the three preceding months. With respect to sanitation, flush toilets (45.6%) and improved latrines (40.3%) were the most common; 18.1% of households did not have improved sanitation and 5.9% reported sharing toilet facilities.1716 Water and sanitation indicators differed significantly by region. The need for improved water access and water storage was greatest in Aleppo where the majority (88.8%) did not have continuous access to running water and 95.5% experienced several days without water in the 3 preceding months. Sanitation was the worst in the West Coast and Rif Damascus where 27.1% and 21.7% of households, respectively, lacked improved sanitation.
Table 5. Water, Sanitation, and Hygiene (WASH)
[1][1] Including reducing portion size; reducing number of meals eaten per day; reduced adult consumption to allow children to eat; restricting consumption of female household members; going entire days without eating; selling household assets, productive assets, house or land; withdrawing children from school; involving children in income generation; engaging in high risk/socially degrading jobs; sending members to eat elsewhere; and child marriage.
Discussion
To our knowledge this is the only recent quantitative multi-sectoral assessment that covers a significant proportion of Syria. The assessment was undertaken in areas that were predominantly government controlled which are less likely to have experienced direct effects of conflict, such as violence and infrastructure destruction, than inaccessible and non-government controlled areas. Basic services, such as health, education and utilities are likely to be more accessible and functioning in in areas included in the assessment as compared to elsewhere in Syria; furthermore, the participants were from predominantly urban areas which are likely to have better access to services than rural areas. Assessment findings should not be generalized to Syria more broadly because of contextual differences and it is likely that humanitarian needs in non-government controlled areas are significantly greater than in the locations included in this assessment.
The ability to compare results with other sources is limited because accessible areas and measurement methods vary widely. The 2016 Humanitarian Needs Overview (HNO) and Syria Dynamic Monitoring Reports (DMR) have similarly wide geographic coverage and report on all sectors, but rely on secondary data or assorted other methodologies.1718,19 A number of sector-specific assessments and program evaluations are available, but there were no peer reviewed publications with primary data collected in 2015 or 2016.1920,21,22,23
Shelter needs were greatest in the West Coast, Rif Damascus, and al-Hasakeh, though concerns differed greatly by region. Residing in construction sites or warehouses was common in Rif Damascus whereas dwelling repairs and crowding were predominant concerns in the West Coast and al-Hasakeh, respectively. One potential reason for the high levels of crowding in al-Hasakeh is that displacement in al-Hasakeh was more recent than in other survey areas, where 69% of IDPs were displaced in/after 2015 compared to <10% in other survey areas. The June 2016 DMR indicated shelter needs were most severe in Rif Damascus, aligning with findings from this assessment; Homs also had higher shelter needs in the DMR. Comparison with other recent assessments suggest that our findings may underestimate shelter needs; in this assessment 38% were found to lack adequate shelter compared with 79% in the DMR and 59% reported by OCHA.19,2418
Food security was a major concern. Despite high levels of assistance, 64% of households had unmet food needs which is greater than our 2014 survey where 50% reported unmet food needs.2322 Food insecurity was greatest in Rif Damascus and the West Coast; Aleppo and the Central area were moderately food insecure and Damascus and the South were areas of lesser concern. Findings are relatively aligned with other sources; 85% of households reported using negative coping strategies compared to 79% in a June 2016 food security review.2524 Food consumption, which was acceptable in 76% of households, was slightly better than in a 2015 WFP report where only 65% had an acceptable FCS; this is difference is not likely to reflect a situational improvement and is probably results from differences in coverage areas.2122,23 High food prices and receipt of insufficient quantities of food, both previously identified concerns, are likely contributing factors to the observed high food expenditures and food insecurity.18,22,26,27
172125More than one-third (36%) of households did not have consistent access to running water and 48% reported no access to water for several day periods. Water access was worst in Aleppo and reported to be a problem by 72% of households overall. Sanitation was a lesser concern with 86% having improved sanitation and little sharing (6%); sanitation needs were greatest in the West Coast and Rif Damascus. Findings from this assessment, where Aleppo had the greatest WASH needs, are supported by previous assessments; however, Hama and Homs were ranked as having similarly high WASH needs in the HNO but moderate needs in this assessment.10,18 Of note, our assessment reports on access to water but could not assess water quality which is also a known concern, where 70% of Syrians are estimated not to have access to safe drinking water.18
Limitations. Triangulation and the stratified design may have reduced sampling bias, but given the limitations of available population data and ongoing displacement, it is likely the sample is unrepresentative. Many areas were inaccessible, thus findings are not nationally representative and probably present a better-than-actual characterization of the situation where the most severely affected areas with the greatest unmet needs were inaccessible; this was especially true in Aleppo, one of the most severely impacted areas, where the majority of the city was inaccessible.2827 The training-of-trainer method, particularly given the extended period between trainings, and use of paper questionnaires in some locations may have contributed to poor data quality. Because of length limitations; key sectors including health, NFIs, education and protection were not assessed in sufficient depth and had limited indicators that could be used to develop severity scales and thus are not presented.
Conclusions
Timely and accurate report of needs in emergencies is a persistent challenge. Situational reporting is often anecdotal or based on information provided by convenience samples, key informants, projections or a combination of these approaches. This assessment is the only large-scale multi-sectoral assessment conducted in Syria in the past two years that uses a random sample of households, thus findings are more scientifically rigorous than most other available sources.
The greatest levels of unmet humanitarian needs were observed in the West Coast, Rif Damascus, and al-Hasakeh. Of note, was the finding that Lattakia and Tartous had high unmet needs in both the shelter and food security sectors and moderate water and sanitation needs which contrasts with other recent reports indicating lower levels of need in those governorates.1817 Lattakia and Tartous are mostly government controlled, however, the proportion of households receiving assistance was among the lowest of all survey areas which may explain the higher than anticipated levels of unmet need. Al-Hasakeh differed from other areas included in the assessment in that displacement was more recent and coverage of humanitarian assistance was low, which is largely due to aid organizations having poor access (though indications are this may be improving). The high prevalence of coping mechanism use and other indicators suggest the population in al-Hasakeh is in need of additional support and that an expanded response could prevent future deterioration.
When considering these findings, it is important to note they are representative of accessible populations in predominantly urban areas which are likely to have better access to services and fewer needs than populations in rural locations or areas not controlled by the government. The humanitarian situation in inaccessible areas is likely to be considerably worse, thus findings presented here likely underestimate the true scope of humanitarian needs which will continue to exceed response capacity, both due to access limitations and funding shortfalls.1817 Extreme destruction and violence, widespread humanitarian law violations, and lack of progress towards peace portend a deteriorating situation. Sustained support from the international community and an expanded humanitarian response are desperately needed for Syrians to better endure the conflict.
Competing Interests
Shannon Doocy is on the Editorial Board at PLoS Currents. There are no other conflicts of interest.
Funding Disclosure
The study was funded by international donor contributions for humanitarian operations by a US-Based international non-governmental organization that wishes to remain unnamed. The funders had no role in study design, data collection and analysis, decision to publish, or preparation of the manuscript.
Corresponding Author
Shannon Doocy: [email protected]
Data Availability
Minimal underlying data for this manuscript is deposited publicly in the Humanitarian Data Exchange and can be accessed at: https://data.humdata.org/dataset/humanitarian-needs-in-government-controlled-areas-of-syria
Methods: We implemented a pre-SIA survey in 135 randomly-selected households in Kobanê using a vaccination history questionnaire for all children <5 years. We conducted a VPD Risk Analysis using MSF ‘Preventive Vaccination in Humanitarian Emergencies’ guidance to prioritize antigens with the highest public health threat for mass vaccination activities. A Measles SIA was then implemented and followed by vaccine coverage survey in 282 randomly-selected households targeting children <5 years.
Results: The pre-SIA survey showed that 168/212 children (79.3%; 95%CI=72.7-84.6%) had received one vaccine or more in their lifetime. Forty-three children (20.3%; 95%CI: 15.1-26.6%) had received all vaccines due by their age; only one was <12 months old and this child had received all vaccinations outside of Syria. The VPD Risk Analysis prioritised measles, Haemophilus Influenza type B (Hib) and Pneumococcus vaccinations. In the measles SIA, 3410 children aged 6-59 months were vaccinated. The use of multiple small vaccination sites to reduce risks associated with crowds in this active conflict setting was noted as a lesson learnt. The post-SIA survey estimated 82% (95%CI: 76.9-85.9%; n=229/280) measles vaccination coverage in children 6-59 months.
Discussion: As a result of the conflict in Syria, the progressive collapse of the health care system in Kobanê has resulted in low vaccine coverage rates, particularly in younger age groups. The repeated displacements of the population, attacks on health institutions and exodus of healthcare workers, challenge the resumption of routine immunization in this conflict setting and limit the use of SIAs to ensure sustainable immunity to VPDs. We have shown that the risk for several VPDs in Kobanê remains high.
Conclusion: We call on all health actors and the international community to work towards re-establishment of routine immunisation activities as a priority to ensure that children who have had no access to vaccination in the last five years are adequately protected for VPDs as soon as possible.
]]>Introduction
The on-going, protracted conflict in Syria has led to a large scale breakdown of health services with a decrease in life expectancy and an increase in childhood mortality since the war began that has obliterated the public health gains being made in the past 1,2,3. Despite moderately high pre-conflict vaccine preventable disease (VPD) vaccination coverage rates in Syria 4 , recent reports of outbreaks of acute flaccid paralysis and measles have become increasingly common 5,6,7. While much has been documented about the health status of Syrians who are hosted as refugees in other countries, insufficient information is available about the effects of the conflict on the health of the population inside Syria 8 .
Kobanê (formerly Ayn al-Arab) is a town in Aleppo governorate in northern Syria. It participated in the full national Expanded Program of Immunization (EPI) prior to 2011. The implementation of EPI deteriorated as the conflict progressed and the programme was discontinued nationwide by mid-2014 9. Since then only some supplementary immunization activity (SIA) with oral polio vaccine was carried out by local authorities and supported by UNICEF.
The majority of the population of Kobanê fled the town at the end of 2014 following the takeover by the Islamic State (ISIS) with the majority of the 60,000 inhabitants taking refuge in neighbouring Turkey. In Turkey, some children re-started EPI as refugees. By the first half of 2015, people started returning to Kobanê as active fighting had subsided and as access improved, Médecins Sans Frontières (MSF) restarted healthcare activities in the region. A population census that was conducted by MSF and a local community-based organisation in May 2015 indicated that 24,000 people were living in Kobanê city at that time, across 4400 households.
In May 2015, continued population movement, limited access to health services and poor water and sanitation created ideal conditions for outbreaks of VPD amongst the returning population. Given the complete lack of routine vaccination, absence of recent coverage data and the risk of VPD transmission in this setting, MSF conducted a vaccine coverage survey in order to make an informed decision about prioritisation of public health interventions, particularly vaccination.
Based on the results of the survey and the VPD risk assessment that followed, measles SIA (i.e. a mass vaccination campaign) was carried out in Kobanê city and the surrounding county by the Kobanê Health Administration (KHA) with the support of MSF. This was followed by a post vaccination coverage survey to monitor the success of the SIA.
We describe the methodological processes and findings of the initial vaccination coverage survey, VPD risk analysis, mass measles vaccination program and subsequent post-campaign vaccination coverage survey in this conflict affected area. The information highlights the impact of the conflict on the vaccination status of Syrian children and the grave public health risks associated with this.
Methodology
Pre-SIA Vaccine Coverage Survey
Target population and sample size
Children less than 5 years old (0-59 months) and living in Kobanê city at the time of the survey in June 2015 were included. The required sample size was calculated as 135 households, using ‘ENA for SMART’ software and the following assumptions: 17.1% of population of Kobanê city under 5 years old, 40% of children under 5 years fully vaccinated for their age, precision of 10%, design effect 1 (random sampling of households), average household size 5.4 and 10% non-response of households 10. The assumption of 40% coverage in the target population was based on the knowledge that the largest possible sample size for such a survey would be based on 50% coverage.
Sampling strategy
Simple random sampling was undertaken using Epop (Epicentre, Paris, France) software and Google Earth to generate 135 random geographic points within demarcated city limits. If the house nearest the point was not inhabited (many houses in Kobanê remained abandoned at this time), the next-nearest-front-door method was used to find another household. All children under 5 years in the selected households were included in the survey.
Data collection and analysis
The vaccination history questionnaire covered demographics of children under 5 in the house, vaccination history (verbal or from vaccination card and, for Bacille Calmette Guerin (BCG), presence or absence of BCG scar), and reasons for non‑vaccination (if not fully vaccinated). Verbal vaccination histories involved asking the care taker to describe each occasion that child had received vaccination(s), including age of child at the time, whether needle or drops were given, and into what limb(s).
Where the caretaker had no vaccination card and did not recall the name of vaccines given but the child had received all vaccines in Kobanê, a former local vaccination supervisor and a medical doctor compared the reported vaccination history with the EPI schedule previously used in Kobanê, and, where possible, determined what antigens were most likely to have been given. For instance, where a carer reported the child received vaccinations around 3, 4 and 5 months of age and involved two needles, it was assumed that these represented the pentavalent and inactivated polio vaccines on the Kobanê EPI schedule. A time lag of up to 1 month (before or after due date) for vaccinations due in the first year of life, and a time lag of up to 3 months for those vaccines due at 18 months was used as the range of tolerability. If reported vaccination episodes fell outside of these ranges then the antigen received in that vaccine episode was considered unidentifiable.
Parents/guardians of unimmunised or partially immunised children were asked the reason(s) for incomplete vaccination.
The World Health Organization (WHO) definition of a ‘fully immunized’ child was used to define full immunisation 11. Data collectors were daily workers from the town who all had university degrees and could speak Kurdish and Arabic (the local languages). They received two days of training on childhood vaccinations, sampling and data collection using the survey tools. They were supervised by the MSF public health liaison officer and the vaccination nurse and the team was led by a public health doctor who conducted intermittent field visits and was otherwise available over teleconferencing.
Data analysis was performed using Microsoft Excel and STATA (v.14.0). Vaccination coverage was calculated as the proportion of children that reported receiving the vaccine in the survey sample divided by the total number of children in the target vaccination age in the survey sample, with respective 95% confidence intervals (95%CI) calculated in STATA, taking into consideration the standard errors for that proportion.
VPD Risk Analysis
MSF Internal Guidelines ‘Preventative Vaccination in Emergencies’ and the WHO SAGE document ‘Vaccination in Acute Humanitarian Emergencies’ were used to prioritize antigens with the highest public health threat and guide decisions on vaccination activity 12,13.
The MSF risk analysis process involves examining six contextual risk factors in the target population (overcrowding; malnutrition; poor water, hygiene and sanitation systems; low access to health services; high birth rate; burden of HIV/AIDS/chronic disease) and grading each as: not a concern at the moment (grade 0), concerning (grade 1) or serious (grade 2). An automated scoring system then assigns a ‘spread likelihood’ score (from 0 to 8) for each of 12 VPDs for each contextual risk factor. This ‘spread likelihood’ score for each factor and disease combination represents the relative importance of the particular risk factor in promoting the spread of the particular disease. For instance, if a user assigns the factor ‘overcrowding’ the grade of 2 (serious), the tool gives measles a spread likelihood score of 8 for that factor (as serious overcrowding has high relevance for the spread of measles), and gives Hib a score of 4 (as serious overcrowding has a moderate relevance for the spread of Hib) and Yellow Fever a score of 2 (as serious overcrowding has a low relevance for the spread of Yellow Fever). The scores for each of the six spread factors for each disease are added together to give a total Spread Likelihood score for that disease in this context.
The scoring system was developed by the MSF International Working Group, based expert input plus the WHO SAGE’s ‘relevance of each general risk factor to each VPD’ scale published in its document ‘Vaccination in Acute Humanitarian Emergencies’.
The next step of the risk analysis is to look at aggravating epidemiological factors for each of the 12 VPDs, in terms of geographical or seasonal threats, population immunity and burden of the disease. Combining the results of these two steps produces a list of priority antigens to consider for preventative vaccination. To select those antigens that will be delivered in the context, a feasibility assessment is undertaken considering the window of opportunity for intervention, characteristics of each vaccine, target population, vaccination strategies, operational/logistical constraints and ethical issues.
Measles SIA
The KHA, with the support of MSF, aimed to vaccinate 95% of children aged 6-59 months in Kobanê city for measles (4560/4800 children). All children aged 6-59 months were offered measles vaccination unless a vaccination card showing two previous doses of measles or Measles Mumps Rubella (MMR) vaccine could be shown by the child’s parent/guardian. Each vaccinated child received a vaccination card and had their left index finger marked with an indelible ink pen for identification in the subsequent vaccination coverage survey. Skilled medical staff and support staff were identified by KHA and trained by MSF. Simultaneously, community sensitisation was conducted through printed pamphlets, meeting with various authorities, and messaging via loudspeakers, social media and door-to-door visits. Four geographically representative, public locations across Kobanê (schools and health centres) were chosen as vaccination sites. A 22m3 cold room powered by a generator was set up to store all the cold chain items. Tally sheets recording the number of vaccinations administered and vaccine vial consumption were used. Administrative vaccination coverage for the target population was calculated at the end of each day and at the end of the campaign using tally sheet data. Surveillance for Adverse Events Following Immunization (AEFI) was undertaken and a line list maintained.
Post-SIA Vaccine Coverage Survey
Target population and sample size
All those aged 6-59 months living in Kobanê city, Syria, during the time of the SIA were included in the target population. The required sample size was calculated as 282 households, using OpenEpi software and the following assumptions: 15% of population of Kobanê aged 6-59 months, 80% measles vaccination coverage from the campaign, precision of 5%, design effect of 1 and 20% non-response rate 14.
Sampling strategy
Similar to the vaccination coverage survey described earlier, we conducted simple random sampling with Epop mapping software to generate 282 random geographic points within demarcated city limits. If the house nearest the point was not inhabited the next-nearest-front-door method was used to find another household.
Data collection and analysis
A standardized questionnaire was used to collect the following data for each child: demographic data (age and sex), vaccination status for the Measles SIA (confirmed verbally by caretaker and/or by vaccination card and/or ink-marked finger) and reasons for non-vaccination in this SIA. Local data collectors who conducted pre-SIA survey were used for interviews after a refresher training. Data analysis was performed using Microsoft Excel and OpenEpi. Vaccination coverage was calculated as the proportion of children that reported receiving the vaccine in the survey sample divided by the total number of children in the target vaccination age in the survey sample with respective 95% confidence intervals (95%CI).
Ethical approval
The results described in this paper are purely observational and were done as part of monitoring, implementation and evaluation of routine activities in the MSF project in Kobanê, Syria. The study was conducted with permission from the Medical Director of MSF-OCA and exempted from ethical review by The MSF Ethics Review Board.
Results
Pre-SIA Vaccine Coverage Survey
The survey was implemented in June 2015 and included 212 randomly selected children under 5 years of age from 135 households (100% response rate; 1 household contained no children under 5 years). The mean age of the children was 27 months (median age: 25 months; interquartile range: 13-42 months) and 49.1% (n=104) were female. Fifty three children (25.0%; 95%=18.8-32.4%) had a vaccination card available.
Of the 212 children, 168 (79.3%; 95%CI=72.7-84.6%) had received one vaccine or more in their lifetime and 43 (20.3%; 95%CI: 15.1-26.6%) had received all vaccines due by their age. Of the 43 fully vaccinated children, only one was under 12 months old; this child had received all their vaccinations outside of Syria.
Table 1 shows overall vaccination coverage for the main EPI antigens among children under five years in Kobanê; Table 2 shows vaccination coverage for these antigens by age sub-group.
NB: DTP=Diptheria+Tetanus+Pertussis; MMR= Measles + Mumps + Rubella; Time-lags are explained in the methods section; *According to Government of Syria EPI schedule used in Kobanê until vaccination ceased in 2014; ~Defined as those who have completed the month when vaccine is due, i.e. if vaccine is due at 3 months, includes all children 4 months and older; **Polio 1 and 2 were IPV (inactivated polio vaccine) and Polio 3 was OPV (oral polio vaccine).
Antigen
Vaccination
Age at which vaccine should be administered*
Number of children eligible to have received vaccine (according to age)~
Number who received vaccine
Vaccination coverage [% (95%CI)]
BCG
BCG
Birth (within first month of life)
207
127
61.3 (53.7-68.4)
DTP
DTP1
3 months
198
107
54.0 (46.1-61.8)
DTP 2
4 months
196
77
39.3 (31.9-47.2)
DTP 3
5 months
193
52
26.9 (20.5-34.5)
Polio**
Polio 1
3 months
198
144
72.7 (65.3-79.1)
Polio 2
4 months
196
108
55.1 (47.5-62.4)
Polio 3
5 months
193
71
36.8 (29.5-44.7)
MMR
MMR 1
12 months
160
55
34.4 (26.9-42.7)
Vaccination coverage by age group % (95%CI; proportion)
Antigen
Vaccination
0-11 Months
12-23 Months
24-35 Months
36-47 Months
48-59 Months
BCG
BCG
19.6 (10.6-33.3; 10/51)
63.3 (47.8-76.4; 31/49)
70.6 (51.9-84.2; 24/34)
84.1 (69.3-92.5; 37/44)
73.5 (55.2-86.2; 25/34)
DTP & Hib
DTP 1/Hib 1
9.8 (4.0-22.1; 5/51)
53.1 (38.2-67.4; 26/49)
64.7 (46.0-79.8; 22/34)
70.5 (53.8-83.0; 31/44)
67.7 (49.2-81.9; 23/34
DTP 2/Hib 2
5.9 (1.8-17.3; 3/51)
38.8 (25.4-54.1; 19/49)
38.2 (23.1-56.1; 13/34)
47.7 (32.4-63.5; 21/44)
61.8 (43.4-77.2; 21/34)
DTP 3/Hib 3
2.0 (0.2-13.4; 1/51)
12.2 (5.4-25.4; 6/49)
14.7 (5.9-32.2; 5/34)
45.5 (30.4-61.4; 20/44)
58.8 (40.6-74.9; 20/34)
Polio
Polio 1
21.6 (12.1-35.5; 11/51)
73.5 (58.7-84.4; 36/49)
88.2 (71.2-95.8; 30/34)
86.4 (71.9-94.0; 38/44)
85.3 (67.9-94.1; 29/34)
Polio 2
9.8 (4.0-22.1; 5/51)
42.8 (28.9-58.0; 21/49)
64.7 (47.7-78.7; 22/34)
75.0 (58.3-86.6; 33/44)
79.4 (61.4-90.3; 27/34)
Polio 3
7.8 (2.9-19.7; 4/51)
22.5 (12.5-36.9; 11/49)
35.3 (20.2-54.0; 12/34)
52.3 (36.5-67.6; 23/44)
61.7 (43.4-77.3; 21/34)
MMR
MMR 1
–
8.2 (3.0-20.5; 4/49)
29.4 (15.6-48.4; 10/34)
50.0 (34.4-65.6; 22/44)
55.9 (38.8-71.7; 19/34)
Fully vaccinated for age
2.0 (0.3-13.5; 1/51)
4.1 (1.0-15.6; 2/49)
8.8 (2.7-25.4; 3/34)
40.9 (26.4-57.2; 18/44)
55.9 (38.8-71.7; 19/34)
Sixty eight of the 212 children (32.1%; 95%CI: 25.4-39.6%) had received one or more doses of polio vaccine as part of a mass vaccination campaign (whether in Syria, or as a refugee in Turkey or Iraq). Of the 209 children who spent some time as a refugee in Turkey or Iraq as a result of the conflict in Kobanê, 47 (22.5%; 95%CI: 16.8-29.4%) received one or more vaccines whilst a refugee. Fifty four out of 212 children (25.5%; 95%CI: 19.8-31.9%) received more than 3 polio doses (between 4 and 7 doses in total) most likely during polio SIAs.
Coverage rates for vaccinations were not different between female and male children, for instance, coverage of the DTP1 vaccine was 50.9% for males (95%CI: 41.1-60.7%) and 50.0% for females (95% CI: 40.0%-0.0%), and for Polio3 was 32.4% for males (95%CI: 23.7-42.1%) and 34.6% for females (95%CI: 25.6-44.6%).
Reasons for not vaccinating were given by 107 of the 111 parents/guardians of incompletely vaccinated children. The most commonly cited reasons were: vaccination not available (when in Syria) (39.6%; 95%CI: 30.9-49.0%); vaccination not available (when a refugee) (14.4%; 95%CI: 8.8-21.9%); child was ill at the time of vaccination (11.7%; 95%CI: 6.7-18.7%); and because they did not know the place or time for vaccination (when a refugee) (9.0%; 95%CI: 4.7-15.5%).
VPD Risk Analysis
The first step of the MSF VPD risk analysis (assessing contextual risk factors) suggested that measles, cholera, pneumococcal disease and Haemophilus influenzae (Hib) pneumonia were the VPDs with the greatest spread likelihood in this context, given the concerning (but not serious) state of water/hygiene/sanitation, low access to health care and high birth and chronic disease rates (see Table 3).
* These diseases are usually included in the EPI; PCV = pneumococcal vaccine; WHS = Water, hygiene and sanitation
Overcrowding
Malnutrition
Poor WHS
Low Access
High birthrate
High chronic disease
Spread likelihood
Epidemic prone
Measles*
0
0
2
4
4
2
12
Cholera
0
0
4
4
1
1
10
Polio*
0
0
4
1
1
1
7
Diphtheria*
0
0
1
2
1
1
5
Pertussis*
0
0
1
2
4
1
8
Burden
PCV
0
0
1
4
4
4
13
Hib*
0
0
2
4
4
2
12
Region/ Season
Typhoid
0
0
4
2
1
2
9
Meningitis A
0
0
1
4
1
2
8
Yellow Fever
0
0
2
1
1
1
5
Japanes Encephalitis
0
?
2
2
2
1
7
The second step of the analysis (assessing aggravating risk factors) highlighted the limited data available on health and vaccination coverage for this area since the conflict began. However, available anecdotal evidence highlighted: low vaccine coverage levels for all antigens; reported cases of measles polio, typhoid and Hepatitis A in the country; and very high levels of respiratory tract infection in the area.
Taking into account the findings of steps one and two, and contextual restrictions (e.g. current absence of EPI vaccination; that prevention of/response to a waterborne disease outbreak would focus on water and sanitation measures before vaccination), it was concluded that the most important vaccinations to consider were measles, Hib and PCV. The decision to not conduct SIAs for PCV was based on the fact that this antigen was not currently approved under the Syrian Ministry of Health guidelines for the Extended Programme for Immunisation (EPI) and thus could not be imported into the country. The decision to not conduct a mass vaccination campaign for Hib was based on the practical considerations that there were not enough supplies on the ground at the time to be able to achieve an acceptable level of coverage. However, pentavalent vaccination (which includes Hib) was immediately installed as part of the EPI activities within MSF health facilities. Based on the low coverage from the vaccination coverage survey for measles, and the above-mentioned considerations, MSF recommended that a measles (and polio) mass vaccination campaign be undertaken. The polio vaccination remained under the coordination of other international stakeholders (United Nations Children’s Fund (UNICEF) and the WHO).
Measles SIA
During the measles SIA in August 2015, tally sheet records indicated that a total of 3410 children aged 6-59 months were vaccinated. This gives an administrative vaccination coverage of 71.0%. Of these 3410 children, 1637 (48.0%) were female and 290 (9.8%) resided outside of Kobanê city (SIA activities were carried out by the KHA in the surrounding canton in the following days). Two cases of fever after vaccination were reported which were symptomatically managed and followed up. No other adverse effects following immunization were reported. Observations on the challenges faced in implementing this SIA were made by MSF staff and are considered in the Discussion section below.
Post-SIA Vaccine Coverage Survey
In September 2015, 282 households containing 306 children aged 6-59 months were included in the post SIA vaccine coverage survey. The response rate was 100%. The mean age was 30 months (median age: 24 months; interquartile range: 12-48 months); 49.7% (n=152) were female. Two hundred and eighty children were included in the final analysis as 26 children had returned to Kobanê after the SIA. Of these 280 children, 229 were reported to have received a measles vaccination in the SIA, giving a coverage of 81.8% (95%CI: 76.9-85.9%). An SIA vaccination card was available for 94.8% (n=217); 8 children (3.5%) still had a visible ink marking on the left fifth finger. The most common reason for non-vaccination amongst the 51 children who had not been vaccinated was that the caretaker was busy during the campaign (n=22, 43.1%, 95%CI: 30.1-56.9%). The next most common reasons were that the caretaker did not know about the vaccination campaign and that the child was sick during the vaccination campaign (n=7, 13.7% each; 95%CI: 6.2-25.3%).
Discussion
The impact of the Syrian crisis on public health in the country is evident from these results: in Kobanê, the vaccination coverage for all vaccine antigens included in the EPI schedule of Syria was poor with only 1 in 5 (20.3%) children under 5 years demonstrating complete vaccination coverage for their age.. In fact, only one out of 51 children (2.0%) less than 12 months of age was fully vaccinated for age, as compared to 19 out of 34 (55.9%) in the 48-59 month age group, highlighting the fact that younger children were more severely affected by a progressively crippled health system. Compared to data from 2010 from the Syrian Ministry of Health where greater than 80% of the target age group was reported to be vaccinated the difference in coverage rates is striking 15. The results highlight beyond any doubt how the collapse of the functioning health system during the current conflict is impacting children 16.
The low rates of MMR, polio, PCV and Hib coverage in all children under 5 years of age in Kobanê illustrate the high level of susceptibility that children have towards these diseases which we know can have serious medical consequences ranging from pneumonia to respiratory failure and sometimes death.
The choice by MSF to recommend a measles and polio vaccination campaign in Kobanê following the return of a large proportion of the population in 2015 was based on the low vaccination coverage rates for polio and MMR in the returning population. However, it also took into consideration a careful risk assessment around VPDs in Kobanê at that time. In difficult humanitarian conditions, the possible impact of a measles outbreak on a vulnerable population in Kobanê could have been disastrous and was thus prioritised. Polio vaccination was already being planned by other partners with the support of the World Health Organisation (WHO). Other important VPDs highlighted in this risk assessment like PCV were de-prioritised as they were not included in the official EPI schedule of the Syrian Ministry of Health and thus could not be imported into the country within the available time window. These were therefore put forward as recommendations by MSF to the KHA to include these antigens in the EPI programme of Kobanê as soon as it was operational again.
The strength of the VPD risk assessment tool is that it is a rapid, comprehensive and easy to use tool that provides an approach for deciding which vaccines, if pre-emptively and properly delivered at the outset of an emergency would constitute high priority public-health interventions and would reduce avoidable death and disease. Our inability to deliver pneumococcal vaccination in Northern Syria (despite being prioritised by use of the tool) as it wasn’t yet approved in the Syrian immunisation schedule is an example of local practical implementation difficulties that are not taken into account by the tool.
Maintaining adequate vaccination coverage levels in any population is difficult without a well-functioning EPI system. In many countries, the use of SIAs is commonly employed in order to catch up with vaccination coverage for target diseases in a rapid way. However, during active conflict and therefore a continuous flux of displaced populations, maintaining the immunity levels will remain a challenge even with the SIA approach.
All public health stakeholders in Kobanê agreed that the SIA for measles was important and that there was a small window of opportunity present to implement it. However, hesitance remained as a result of the 2014 tragedy in Idlib city, Syria, where 15 children died when an error was made with the measles vaccine diluent and the measles vaccination campaign had to be stopped prematurely 17. The SIA in Kobanê was therefore the first time (to our knowledge) since that event that a measles vaccination campaign was implemented in the region.
The exodus of qualified health workers from Syria since the war began meant that the few left behind had to take on additional responsibilities beyond their expertise or experience3. Repeated attacks on health structures across the country in defiance of the tenets of the Geneva Conventions had left MSF with no alternative other than to have limited or no international staff presence in their field locations 18. This provided practical challenges in training, supporting, implementing and monitoring a SIA and placed an increased burden on the remaining health care system.
There was also the possibility of terror attacks on fixed vaccination sites that had to be recognised and a contingency plan put into place. To circumvent this, doing measles vaccination from house to house was also discussed but considered not feasible at the time. It was then decided that four decentralised sites across Kobanê town would be established and vaccination run over 5 days to avoid large crowds at any given time.
The need for surveillance and early warning systems for outbreaks of VPDs – including those using non-formal reporting channels –is increasingly important. Only with rapid alerting of suspected cases and clusters of measles, polio and other VPDs can response measures to mitigate their impact be implemented. Adequate response would then require the ability to transport vaccines, medical supplies (syringes, cooling boxes etc.) and other healthcare related supplies into northern Syria; something which has been impossible for the majority of 2016 due to near-complete border closures.
In the post-vaccination survey, 8.5% of those sampled had not been present in Kobanê at the time of the SIA, again highlighting the fact that, unless routine immunization services are restored, maintaining an acceptable level of measles coverage will be very challenging when a significant proportion of the population is mobile due to insecurity. Despite not achieving the targeted 95% coverage that we usually aim for in emergency settings, the result from the SIA was encouraging when taking into considerations the contextual challenges for its implementation.
The post-SIA coverage of 82% differed from that expected by administering measles vaccine to 3410 of 4800 (71%) children. In emergency situations it is common place to conduct post vaccination coverage surveys to have a more accurate understanding of the vaccination coverage levels achieved during the vaccination campaign as population numbers used to plan such campaigns are often flawed due to significant population movements.
The use of GPS based sampling for surveys in emergency contexts is not uncommon and has been used effectively in insecure environments or where traditional census data is absent to use as a sampling frame for random household selected 19. The possible limitation around this method is that it favours households located in sparsely populated areas compared to densely populated areas. We do not think this potential bias affected the pre and post SIA significantly as Kobane town is very small and we assumed that the population was therefore homogeneously distributed within the boundaries of the town that we generated.
While in this manuscript, we describe an SIA that MSF managed to conduct, the situation in Syria does indeed limit the use of SIAs primarily in two ways. 1. SIAs are much delayed in their implementation due to security and logistic constraints and one has to wait for a window of opportunity in the form of a favorable environment to conduct the SIA. 2. The geographical area in which SIAs are conducted is much smaller than what is needed and often occur in relatively safer areas closer to the international borders with neighboring countries rather than deeper into Syrian territory where the armed conflict may be more active.
Conclusions
Access to EPI vaccination for children is a key example of preventative public health interventions that have been curtailed in Northern Syria since the start of the conflict.
These findings demonstrate that collapse of the formal public health system has led to an increasingly large group of children who are susceptible to infectious diseases with serious consequences, with younger children most vulnerable.
We call on all health actors and the international community to work towards re-establishment of EPI activities as a priority to ensure that children who have had no access to vaccination in the last five years are adequately protected for VPDs as soon as possible.
Data Sharing
Data are available on request in accordance with MSF’s data sharing policy due to the sensitivity of the data. Requests for access to data should be made to [email protected]. For more information please see:
MSF’s Data Sharing Policy: https://fieldresearch.msf.org/msf/handle/10144/306501
Funding
Médecins Sans Frontières – Operational Centre Amsterdam (MSF-OCA) funded the humanitarian response activity described in this manuscript. MSF-OCA had no role in the study design, data analysis, decision to publish or preparation of the manuscript. The authors received no specific funding for this work.
Corresponding Author
Alan de Lima Pereira: [email protected]
Communications can also be addressed to Annick Lenglet: [email protected].
Competing Interests
The authors have declared that no competing interests exist.
Introduction
In January 2011, landslides and floods followed heavy rain in Serrana Region (Região Serrana), the mountainous region of Rio de Janeiro State in southeastern Brasil. This led to the largest natural disaster registered in Brazilian recent history. It claimed the lives of around 918 people and left 30 thousand homeless in 11 municipalities, with seven declaring Estado de Calamidade (Calamity State – on direct translation). A 2014 report counting 845 immediate deaths indicated that 75% were dead by mud burial and 25% by drowning.1 The three most affected municipalities were Petrópolis, Teresópolis and Nova Friburgo, with significant immediate damage to the transport and communication systems, as well as to health infrastructure. Furthermore, the local economy suffered with major impacts from the damage to local industry and agriculture; since both urban and rural areas were affected2.
Serrana Region is located in the tropical zone, in the central part of the Rio de Janeiro state. It is a mountainous region with altitudes ranging from 400 meters to 2292 meters. The accumulated precipitation of rain in the region can be above 2500 mm in certain municipalities, whereas it is bellow 1300 mm in others3. Before the mentioned event, there was accumulated rainfall in order of 241.8 mm in 24 hours, with a peak of 61.8 mm in one hour. The region encompasses 16 municipalities that have medium and high Human Development Index – HDI (0,611 and 0,745)4, with a total population of 911,383 inhabitants. It is one of the 9 health administrative regions of Rio de Janeiro State, which is one of the 27 Brazilian federal units. Rio de Janeiro state has an area of 43,780,172 km2 and had a population in 2010 of approximately 16 million inhabitants, while Brazil had 190.755.799 inhabitants(Brazilian Institute of Geography and Statistics – IBGE Census 2010)5. See Fig1.

Fig. 1: Map of South America, with Rio de Janeiro State indicated. Zooming in to Rio de Janeiro State map with the municipalities borders depicted by black thin lines, and the 9 health administrative regions highlighted by different colours. Serrana Region is highlighted in red.
The rainy season in the mountain range region of Rio de Janeiro State (Região Serrana), as in many areas of the south and south eastern regions of Brazil, is during the summer months. Many locations are repeatedly affected by floods and landslides during this period, leading authors to point it as a region under extensive disaster risk2 (“risk of low-severity, high-frequency hazardous events and disasters” as suggested by the United Nations terminology). This assumpion is supported by data extracted from the S2iD plataform (Sistema Integrado de Informaçao Sobre Desastres), a Brazilian public access databank on disasters, which registered 241 events in Rio de Janeiro State in 2009 and 2010, leading to 339 deaths and 162.904 people affected6 .
Brazil’s public health system called Sistema Único de Saúde – “SUS”, was created with the constitution of 1988, integrating the legislative goal of universal health coverage. 7 The same constitution gave space for a private supplemental system. A 2013 report by the World bank points out that direct out-of-pocket spending declined over time, but still accounted for around 30 percent of total health spending, while the expenditure on private plans rose and accounted for over 20 percent8.Data extracted from the World Bank open access data-bank show that from the US$1,055.8 per capita Brazil invested in health in 2011, 54,8% came from the private sector. Furthermore, according to IBGE´s open access data from the Research in Medical-Sanitary Assistance 2009, from the 282 psychiatric institutions present in Rio de Janeiro State in 2009, 147 were public (52%), 135 private (47,8%) and 39 public-private mix(13,8%)9.
The extensive risk condition leads to direct impact on material losses and potentially high mortality rates along the time. Additionally, the impact of these events may be potentiated through secondary stressors, which are defined in a 2012 systematic review10 as “circumstances, events or policies that are indirectly related or non-inherent and consequential’ to the index extreme event” . Some examples are: loss of income, impact on housing value, exposure to negative media reports, physical and mental abuse, loss of social network and lack of access to health and psychosocial care. A report estimates the cost of damage to housing caused by hydrometeorological disasters in Brazil between 2010 and 2014 in R$194 billion (around US$ 95 billion)11. Furthermore, two studies evaluated indirect effects of the 2011 disaster in the Serrana Region reporting an important increase in the occurrence of dengue and leptospirosis in the 1-year period following the disaster. 12,13
Most people experience distress after a disaster and less frequently mental disorders can develop following the event. What determines the path to distress that will eventually resolve or to mental illness is not clear, but data suggest it depends on psychosocial resilience and social support10. The association between extreme events and mental disorders has been studied in different areas of the world, regarding different types of events, environments and affected populations. For instance, a paper suggested that there was great mental health morbidity after Sarno’s 1998 landslides, in southern Italy. The data suggests that, people in the affected area had higher scores on different domains, like: Anxiety/Sleep Disturbance, subjective efficiency, depression, social impairment and higher incidence of Post-Traumatic Stress Disorder (PTSD)14. In a study conducted 33 years after the Aberfan disaster, when a coal slag heap collapse onto a school in Wales, the authors suggested that PTSD was more prevalent between the survivors than in the control group15. It is important to notice that the incident still evoked intense feelings and thoughts in many of the survivors who took part of the study. A paper studying psychotic experiences in the population of Sri Lanka, showed that its incidence tends to be higher in those affected by civil conflicts and by the 2004 Tsunami.16
Despite all the effort, data on mental illness following landslides are scarce as is shown in a systematic review17. The authors discussed that the lack of data may come from the fact that most of the landslides occur in remote regions and poor countries and, frequently landslides come associated to other events such as earthquakes and floods.
To understand an extreme event and its consequences, immediate and long term assessment, taking into account primary and secondary stressors, are beneficial, since the literature shows that the intensity and persistency of both can increase the incidence of mental illness11 . This study reviewed the consequences of the 2011 disaster in the Serrana Region, evaluating the demand for mental health care in the SUS, comparing public mental health assistance data from two time periods – two years before and two years after the event. With that we aimed to identify changes on the demand for mental health services provided by the SUS in the affected region.
METHODS
Study design:
We performed an ecologic study, analysing the aggregate data from Serrana Region during the period before (Jan 2009 to Dec 2010) and after the disaster (Jan 2011 to Dec 2012). We used the aggregate data from the other 8 regions of Rio de Janeiro state as a control group.
Source of data:
We exported data from SUS public access databases using Tabnet, a software developed by DATASUS (Departamento de Informática do SUS, Brazil)18. To evaluate outpatient visits, we assessed the Outpatient Information System (“Sistema de Informações Ambulatoriais – SIA”), the database that contains all data from outpatient visits of the public system. We defined visits due to mental disorders based on which coding the health care workers inputted when the delivered care occurred, the codes are not based on ICD. We defined a priori 35 codes linked with mental illness, excluding those related directly to health problems induced by drugs and alcohol. From the 35 codes, 9 had at least 1 entry, none of them for reasons directly related to drugs and alcohol. All data were retrieved by region of reported address instead of health care facility attendance, because many people may have looked for help or have been referred to other regions of the state.
Mortality and hospital admissions were retrieved from the Mortality Information System (Sistema de Informações sobre Mortalidade – “SIM”) and the Hospitals Information System (“Sistema de Informações Hospitalares do SUS – SIH/SUS”). Demographic data from the Rio de Janeiro state was obtained at IBGE, as the data to build up the region map. The data was exported in May 2016.
Primary outcome: Mental health care demand
We assessed the primary outcome in two additional approaches. In order to correct for possible migration of population, we calculated the proportion of visits due to mental health care (number of mental health care visits / total number of health care visits). In order to correct for possible changes in the availability of health care units, we calculated the monthly absolute number of mental health care visits per each CAPS – “Centro de Atenção Psicossocial” (Psychosocial Care Centre), (total number of mental health care visits / total number of CAPS).
Secondary outcomes:
We evaluated the total number of deaths by any reason, and the total number of hospitalizations. With this we aimed to have a general health impact assessment of the landslides in the studied period and we could also compare the proportion of mental health problems related to the total burden of health problems.
Ethical considerations:
Using ethically agreed principles on open data, it was determined that ethical approval was not needed for this study, since it is anonymised and open to public access on the web.
Statistical plan of analysis:
We reported monthly aggregated data grouped by the affected region (“Serrana Region”) and by non-directly affected region (“Other regions”). Data are presented as mean and standard deviation.
We compared the period before disaster occurrence (Jan 2009 to Dec 2010) with the period after the disaster occurrence (Jan 2011 Dec 2012). We calculated the mean difference and its 95% confidence between the periods and used independent t tests to compare both periods.
To analyse the effect of the disaster on our primary outcome, we also performed a quasiexperimental design using interrupted time series (ITS) to control for secular trends in the affected region. The ITS design is a robust design for evaluating the effects of time delimited interventions, allowing adjustments for time trends, estimating changes in baseline levels and account for autocorrelation and seasonal effects19 . We used autoregressive integrated moving average (ARIMA) model, with two parameters to define each segment (before and after the disaster) of our time series. One parameter is the level, which is the value of the series at the beginning of a given time interval. Other parameter is the trend, which is the rate of change of a measure (slope) during a segment. To examine the results, we should analyse whether there are changes in level and trend following an event (i.e, disaster). In general, a change in level constitutes an immediate event effect, and a change in trend represents a gradual variation in the outcome.
We checked the assumptions for the ARIMA model using Phillips-Perron, the Kwiatkowski-Phillips-SchmidtShin and Augmented Dickey-Fuller tests. The autocorrelation was checked by visual inspection of autocorrelograms and partial autocorrelograms of the series and its residuals. The Ljung-Box Q test was run to evaluate a lack of fit of the final ARIMA model.
We considered a P <0.05 to be statistically significant for all of the analyses. The R free source statistical package version 3.2.2 (The R Project for Statistical Computing, Vienna Austria), and the SPSS 21.0 (IBM SPSS, Chicago, IL, USA) were used in all of the analyses.
RESULTS
We obtained data from the 9 administrative regions of Rio de Janeiro State (Baia da Ilha Grande, Baixada Litorânea, Centro-Sul, Médio Paraíba, Metropolitana I, Metropolitana II, Noroeste, Norte and Serrana) from 48 months, totalizing the expected 4 years period of observation. The data from the not directly affected areas were then grouped (Other regions).
The monthly average number of outpatient visits due to mental disorders was increasing in the affect region before the event, wich is in accordance with data from the Brazilian Ministry of Health that shows an increase in oupatient visits and a decrease in hospitalizations for mental health disorders in Brazil from 2002 to 201420. However, there was a sharp increase in the region in the period after the disaster. Indeed, from Jan 2011 to Jul 2011, there was an important increase in the rate of visits from 13,875 to 17,690, reaching its maximum one year after the event totalizing 21,980 visits (Dec 2011).
In the other regions, there was virtually no change in the average number of visits in the period. We observed a sharp decrease in the last 2 months (November and December 2012) of the time-series from both regions. Fig 2.
 and the brown line shows the number of outpatient visits from the affected area (right y-axis scale)")
Fig. 2: Mental health care visits over time. The green line shows the number of outpatient visits from the not direclty affected area (left y-axis scale) and the brown line shows the number of outpatient visits from the affected area (right y-axis scale)
We also evaluated our primary outcome in two different ways aiming to correct by possible changes that could confound our analysis. First, we observed the proportion of the total outpatient visits that was due to Mental Disorders, thus adjusting for possible migration in the affected region. It was observed that the proportion of visits due to mental disorders increased after the event in the Serrana Region, whereas it kept the same level in the other regions of the state (Figure 3-A). In order to adjust for the number of health care units specialized in mental care, we divided the number of mental health visits by the number of mental health units in the region over time. We observed two moments when there was an important increase in mental disorder visits: immediately after the disaster and around 6 months after it (Figure 3-B). Two health care units were installed in the region in the 3 months following the event; this fact probably attenuated the demand in the region.

Fig. 3: Proportion of outpatient visits due to Mental Disorders in Serrana Region The green line shows the number of outpatient visits from the not direclty affected area and the brown line shows the number of outpatient visits from the affected area.

Fig. 4: Number of outpatient visits due to Mental Disorders per Psychosocial Care Centre in Serrana Region and Other Regions over time. The green line shows the number of outpatient visits from the not direclty affected area and the brown line shows the number of outpatient visits from the affected area.
There was an underlying natural trend for higher mental health care visits in the affected region before the event (Coefficient 196.5, p=0.005), and we identified a change in the level of the time series immediatly after the landslide period (Coefficient 3293.1, p=0.017). We could not observe a statistically significant change in the slope of the time series after the event (Coefficient -63.8, p=0.550) (Figure 4).

Fig. 5: Interrupted times series analysis for the primary outcome.
We did not observe any change associated with hospitalization by any reason. Nevertheless, we observed an important peak on the number of deaths immediately after the landslides occurrence (Figures 5 and 6).

Fig. 6: Hospitalizations due to any reason in the Rio de Janeiro state aggregated in the affected and not affected areas over the 4 years period The green line shows the number of outpatient visits from the not direclty affected area (left y-axis scale) and the brown line shows the number of outpatient visits from the affected area (right y-axis scale).

Fig. 7: Number of deaths due to any cause in the Rio de Janeiro state aggregated in the affected and not affected areas over the 4 years period The green line shows the number of outpatient visits from the not direclty affected area (left y-axis scale) and the brown line shows the number of outpatient visits from the affected area (right y-axis scale).
Average impact of the disaster in the “Serrana region”
Before
After
Mean difference (95% CI)
P value
Primary outcomes
Mean(standard deviation)
Mean(standard deviation)
Monthly average number of outpatient visits due to Mental Disorders, n
11,262 (2358)
18,183 (2980)
6921 (5360 to 8482)
<0.001
Monthly average proportion of outpatient visits due to Mental Disorders (Mental disorders / Any reason), %
1.08% (0.2)
1.74% (0.3)
0.67% (0.51 to 0.81)
<0.001
Monthly average number of outpatient visits due to Mental Disorders per each health care unit specialized in Mental Care per month, rate (n/centre)
904 (185)
1197 (203)
293 (181 to 406)
<0.001
Number of health care units specialized inMental Care (“CAPS”)
13 (1)
15 (1)
3 (2 to 3)
<0.001
Secondary outcomes
Monthly average number of outpatient visits due to any reason
1,046,258 (77971)
1,051,011 (106,174)
4,752 (-49,372 to 58,877)
0.860
Monthly average number of hospitalizations due to any reason
4218 (299)
3884 (457)
-332 (-554 to -110)
0.004
Monthly average number of hospitalizations due to emergencies
2851 (214)
2787 (353)
-64 (-234 to 105)
0.449
Population estimated
920,724 (9542)
919,690 (2764)
-1034 (-5116 to 3048)
0.613
Average impact of the disaster in the not affected region
Before
After
Mean difference (95% CI)
P value
Primary outcome
Mean(standard deviation)
Mean(standard deviation)
Monthly average number of outpatient visits due to Mental Disorders, n
98,237 (8409)
108,792 (7286)
10,555(5984 to 15127)
<0.001
Monthly average proportion of outpatient visits due to Mental Disorders (Mental disorders / Any reason), %
0.63% (0.1)
0.56% (0.1)
0.06% (-0.09 to -0.04)
<0.001
Monthly average number of outpatient visits due to Mental Disorders per each health care unit specialized in Mental Care per month, rate (n/centre)
844 (42)
806 (59)
-38(-67 to -8)
0.015
Number of health care units specialized in MentalCare (“CAPS”)
116 (8)
135 (4)
19 (15 to 22)
<0.001
Secondary outcomes
Monthly average number of outpatient visits due to any reason
15,819,301 (1,871,855)
19,456,431 (1,567,391)
3,637,130 (2,633,996 to 4,640,264)
<0.001
Monthly average number of hospitalizations due to any reason
50,293 (3239)
47,854 (7464)
-2440 (-5783 to 904)
0.149
Monthly average number of hospitalizations due to emergencies
36,828 (2198)
34,922 (5434)
-1906 (-4314 to 502)
0.118
Population estimated
15,079,434 (907)
15,252,332 (57,856)
172,898 (149123 to 196673)
<0.001
DISCUSSION
We observed an increase in the demand for public mental health care after the landslides in Serrana Region in 2011, which was not followed by the unaffected area of the state, used as a control. The number of mental health visits remained above the predicted for an almost two-year period after the event. Furthermore, the number of mental health visits per CAPS increased and remained above the baseline for most of the studied period after the landslides. These data indicate that it is likely that the mental health units were busier than previously. We hypothesize that, if surge capacity strategies were not discussed beforehand, the population may have had insufficient support, with worsening of the provided services. This could have contributed, as a secondary stressor, to the impact on the affected population´s mental health.
It is important to notice that the World Health Organization (WHO)21 states that “Landslides cause high mortality and few injuries” and that is supported by data from the Landslides in Chuuk 2002, when 90% of the decedents died immediately 22. As well as by the data on the 2014 report by Pereira et al, where they estimate that 136 patients were triaged yellow or red in the hospitals of Serrana Region in the first 24 hours after the landslides, whereas 845 people were considered immediately dead1 . In our study, it is evidenced by a sharp peak in mortality rate right after the event.
This study adds to a field where there is paucity of data – mental health consequences of landslides. In the 2015 Systematic Review of Heath Impacts of Landslides17 they categorized the included studies on mental health impacts in three categories: two studies on psychosocial support and the moderating effects of family roles, six on the prevalence of psychiatric disorders and one addressing the needs of firefighters who intervened on a landslide. They do not mention any study addressing specifically public mental health assistance impacts. However, the World Health Organization (WHO), has mental health assistance as a major concern after landslides, as mentioned on their News after the 2014 Badakhshan landslide on north-eastern Afghanistan23 .
Many of the trends in global disaster risk expressed on the United Nations’ 2015 Global Assesment Report on Disaster Risk Reduction (GAR2015)24 are present in our analysis of the herementioned phenomenom: extensive risk, underestimation of risk, indirect disaster losses and impact on future development of underdeveloped countries. Previous analyses and data support the idea that the 2011 Disaster in Serrana Region was linked to important social vulnerability and its consequences should not be addressed merely as a product of chance. For instance, the Pan American Health Organization (PAHO) estimates that 73% of the population and 67% of the health facilities in Latin America and the Caribbean were located in risk zones in 201211. In a 2011 analysis from the Brazilian Ministry of Health in four of the affected municipalities by the 2011 Landslides, 81% of the health facilities were in risk zones2. Data from the Brazilian Ministry of the Environment shows that 92% of the 657 landslides recorded during the 2011 event occurred in areas where the vegetation was not well preserved, and they suggest that part of the damage could be minimized if there weren´t people living less than 30 metres away from rivers and in the steeper portions of the region.25
Moreover, we see this paper as relevant, since few studies addressed the impacts of the 2011 event in Serrana Region, and many localities in southern and southeastern Brazil are likewise under extensive risk of flood and landslides. Therefore, evaluating the impact of these events is of great importance, since part of the lowered perception of risk could be linked to the lack of long term interventions and secondary stressors identification, issues that we try to analyse in this paper. In conclusion, our study is an effort to address what the Sendai Framework considers a priority: Understanding disaster risk. We observed that the 2011 Landslides in Serrana Region led to a higher burden to public mental health care and that this event is part os a series of events that have been happening in the region as in other areas of the country for a long time.
Recommendation: Recognising this study has shown significant impacts in time and space on mental health, it may be helpful to consider using similar methodologies to repeat this work to see if it is a consistent finding from other landslides, extreme weather events or other incidents. It would also be important to design studies to identify vulnerable populations, and evaluate the difference in mental health access between the population with access to private health services and those that rely exclusively on SUS.
LIMITATIONS
Our study has important limitations. One limitation of our study is the fact that we collected the data retrospectively and part of the input of data was during and following a disaster, which could impact the accuracy of reported data. Another limitation we need to point out is that we only used data from the public health system and, in Brazil, the private sector accounts for an important part of health assistance. We should also point out that the increase in demand for mental health care may be overestimated because people may have become more aware of mental illnesses in the aftermath. The codes of mental health related procedures were chosen by us from a list with all the possible health procedures from Brazilian Public Health System (SUS), since there is not a pre-defined way to search for mental health related interventions. We did not intend to study drug and alcohol related mental illness, nevertheless one code is related to it, but it did not have any entries. Finally, we found barriers to obtain data for the analysis of mental health care. For instance, we preplanned to analyse the consumption of psychotropic drugs in the region. However, we could not gather this information in the region, even though in Brazil all the distribution of this kind of medication is registered. There is data on the consumption per federal unit that is of easy public access, but we could not find it per health region or municipality.
Data Availability
The data underlying this study are full available online from the Federal Governmental Secretary, through the Data Mortality Information System (SIM) and the Hospital Information System (SIH/SUS) data available at the DATASUS website (www.datasus.gov.br).
The main data used for this analysis are available from the figshare repository at the following DOI: 10.6084/m9.figshare.5455132
Competing Interests
Professor Virginia Murray serves on the editorial board of PLOS Currents Disasters. She has not influenced or played any role in the peer-review, editorial decision making or publication of the manuscript.
This paper is the result of a thesis submitted in partial fulfilment of the requirements for the degree of Master of Science in Disaster Medicine (European Master in Disaster Medicine – EMDM).
Corresponding Author
Marcelo Farah Dell’Aringa: [email protected]
Methods: This study compared aggregated Demographic and Health Surveys data from 13 districts in Northern Uganda, a conflict-affected region, with data from the rest of the country, for the use of maternal healthcare services for the years 1988, 1995, 2000, 2006 and 2011, using statistical analyses and logistic regression. Specific indicators for maternal healthcare utilization included contraceptive use, antenatal care, skilled assistance at birth and institutional delivery.
Results: Use of contraception and institutional deliveries among women in Northern Uganda was significantly lower compared to the rest of the country. However, skilled assistance at birth among women in Northern Uganda was significantly higher.
Conclusions: The findings in this study show that armed conflict can have a negative impact on aspects of maternal healthcare such as contraceptive use and institutional deliveries; however, other indicators such as skilled assistance at birth were seen to be better among conflict-affected populations. This reiterates the complex nature of armed conflict and the interplay of different factors such as conflict intensity, existing health systems and services, and humanitarian interventions that could influence maternal healthcare utilization.
Key words: Armed conflict, maternal health utilization, Northern Uganda, contraception, skilled assistance at birth, antenatal care, institutional delivery
]]>Background
Maternal health in context
Current figures from the World Health Organization (WHO) on maternal health estimate that approximately 303,000 women die every year during pregnancy and childbirth; this amounts to a staggering 830 deaths every day1. An estimated 99% of all maternal deaths occur in low and middle income countries, with more than half of these deaths reported in sub-Saharan Africa (SSA) and another third in South Asia; together, these two regions account for 87% of all maternal deaths globally2,3.
Though addressing the problem of maternal mortality requires more than just a simple, one-size-fits-all approach 4, the provision of maternal healthcare services has repeatedly been shown to be essential in curbing maternal deaths5,6,7,8,9. These include access to antenatal care (ANC) during pregnancy10,11, skilled attendance at delivery12,13,14, deliveries at healthcare facilities or hospitals and access to emergency obstetric care15, and appropriate postpartum care16,17.
In 2015, the maternal mortality ratio in Uganda stood at 343 deaths per 100,000 live births18. While this figure has seen a decreasing trend over the years with significant improvements in maternal healthcare, it still remains very high as there continue to be gaps in the quality and accessibility of maternal healthcare services, a lack of trained staff, medicines and medical supplies. and inequities in service provision. Uganda faces a challenge in maternal mortality from causes related directly to pregnancy and childbirth, unsafe abortions and obstetric complications; this divide is worse among women in rural areas and those of lower socioeconomic status and education19.
Armed conflict and its impact on maternal healthcare utilization
The impact of conflict on the health and wellbeing of populations is caused by both the direct effects of combat- deaths and injuries sustained during battle- as well as from the more indirect consequences. The latter includes population displacement, the breakdown of social and health services20,21,22, and the increased risk of disease outbreaks due to poor shelter and sanitation, overcrowding and a lack of access to clean water and food. Armed conflict has also been shown to have a gendered effect on population health, where excess mortality attributed to conflict (both directly and indirectly) is higher among women than men, implying a greater level of vulnerability among women23,24. Maternal mortality in conflict can be particularly exacerbated by limited access to maternal health services due to safety, financial and geographical restrictions25, as well as the general collapse of the health system and disruption of routine health service delivery. The increased incidence of sexual violence and rape during conflict also increases rates of maternal morbidity and mortality26.
Uganda experienced a brutal civil war between the Lord’s Resistance Army (LRA) and the Government of Uganda for 20 years, between 1986 to 2006. Though the worst hit areas of the country were primarily in the northern regions (Gulu, Kitgum, Pader, Lira, Apac), the conflict affected many other areas due to the large numbers of internally displaced persons (IDPs) and the widespread terror and violence during the period of the 20 years27,28,29. In the course of the conflict, an estimated 500,000 people were killed and a further 2 million people internally displaced and approximately 66,000 children were kidnapped by the LRA. The economic and health status of these populations also deteriorated significantly during this time, increasing the levels of poverty and lack of education28.
Rationale for the study
Previous research has looked at maternal mortality and fertility rates during the conflict in Uganda, and qualitative studies have looked at the determinants, perceptions and barriers around maternal healthcare service utilization post conflict25,26,30. While these studies have predominantly been qualitative and based on interviews with respondents in a post-conflict setting, little has been published on the trends (and potential differences) in utilization of maternal health at the national level; both in regions of conflict compared to unaffected regions, and across the duration of the conflict period.
This study compared aggregated population-level data from the 13 districts in the Northern Uganda region, with data from the rest of the country, for statistically significant differences in the utilization of maternal healthcare services. The main hypothesis was that living in a conflict-affected region negatively impacts maternal healthcare utilization; the 5 time points of data served to provide a trend across the 20-year conflict period and beyond, to assess whether there were differences in maternal healthcare utilization during the conflict, compared to after, as well as at different time points during the conflict. While the first analysis looked directly at the geographical region (conflict versus non conflict) in the utilization of maternal health care, a second analysis adjusted for demographic factors such as age, education, parity, socioeconomic status and distance to the nearest health care service facility. These factors were selected based on previous research, showing their independent effects on maternal healthcare utilization14,31,32,33.
Methodology
Data source
Demographic and Health Surveys (DHS) are nationally representative population-based surveys, commissioned by USAID and periodically carried out by the governments of different countries, with operational support from ICF International. Data sets are available through application to MEASURE DHS, and once a data request has been approved, no further ethical clearance is required for use of this data for research.
The DHS surveys employ stratified two-stage cluster design. Clusters are first selected from the most recent population census sample frame and households are subsequently and systematically selected from the clusters. Participants eligible for interview include all women aged 15–49 years and men aged 15–54 years who are residents of the selected household. The surveys use standardized questionnaires developed by the MEASURE DHS programme specifically for women, men and households; these are administered during face-to-face interviews. Detailed information about sampling methodologies and data collection procedures can be found in the DHS reports for respective countries34,35.
Study sample
Data for this study was obtained from the Uganda Standard data sets for the years 1988-89, 1995, 2000-2001, 2006, and 2011. Women’s individual datasets were used in the analysis; these consist of representative samples of women, married and unmarried, between the ages of 15-49, who were not pregnant at the time of the interview. Data from 4730 women in 1988/1989, 7070 women in 1995, 7246 women in 2000/2001, 8531 women in 2006 and 8674 women in 2011, were analyzed in this study.
Variables and data analysis
The variables used in this study are listed in Table 1 below. Data was analysed using Statistical Package for the Social Sciences (SPSS) version 23.0, with statistical significance set at p<0.05. Bivariate and multinomial logistic regression was used to determine if region (rest of the country vs. North) was significant in predicting differences in women’s utilization of maternal healthcare. Two levels of analyses were conducted; the first analysis was unadjusted and assessed only region as a predictor variable for women’s utilization of maternal healthcare, while the second analysis was adjusted by including age, education, parity, distance to the nearest health facility and wealth index of the respondents.
Measures of association are presented as odds ratios (ORs) and 95% confidence intervals (CIs). Odds above 1 signify a higher likelihood of utilizing maternal healthcare, and odds below 1 signify a lower likelihood of utilizing maternal healthcare. Missing data were excluded from the analysis.
Table 1: Variables used in this study
Results
Geographical region was included as the only predictor of maternal healthcare utilization in the unadjusted analysis to assess the independent effects of conflict before adjusting for other variables. Demographic characteristics were included in the adjusted analysis for any confounding or mediating effects that these variables may have on the association between region and maternal healthcare utilization (Table 2). The individual associations between the demographic variables and maternal healthcare utilization are not shown.
The odds for the use of contraception and institutional delivery for women in the north of Uganda were significantly lower compared to the rest of the country, across all 5 time points in the study. However, the odds for skilled assistance at birth were higher among women in the north of Uganda, across the conflict years 1988-2006; post conflict, this was no longer statistically significant. Odds for unskilled assistance at birth were significantly lower for the conflict years 1995 and 2006, and post-conflict.
With respect to the reasons for the non-use of contraception, the odds for fertility-related concerns, opposition to use, and lack of knowledge were significantly lower among women in the North across all time points in the study in both analyses, and in 2006 lack of access was significantly lower for women in the North as well.
Attendance at antenatal care sessions were not significant for the initial conflict years 1995 and 2001 in the unadjusted analysis; but in 2006 and post conflict, the odds for this indicator was significantly lower for women in the North. The odds for attendance at 4 or more sessions in the adjusted analysis were statistically significant and lower for women in the North in 1995 and 2000/2001 as well. The relative odds for unskilled assistance at prenatal care (from traditional birth attendants, relatives, etc.) was significantly low for some years, but not significant in others.
Table 2: Logistic regression analysis of the odds of maternal health care utilization in Northern Uganda, 1988-2011
Discussion
The principal hypothesis of this study was that armed conflict negatively impacts maternal healthcare utilization. The findings of this study both support and contradict this to different extent and for different indicators, at different time points of the study period.
As the results for the use of contraception and an institutional delivery show, for women in the north of Uganda the odds are significantly lower for both indicators compared to the rest of the country, across all 5 time points in the study. This is as expected, given that armed conflict constrains availability of and access to healthcare due to security, geographical and financial reasons, as well as the reduced functionality of the health system36,37. Furthermore, previous studies have shown higher fertility rates among populations in conflict, citing this as a coping strategy where having a larger family provides more social and/or economic security, as well as families wanting to replace members lost in the conflict itself25. The lower use of contraception among conflict-affected populations therefore could reflect both affected weakened health system as well as a conscious attempt to preserve and possibly enlarge family size38. With regard to the reasons for non-use of contraception, the odds for opposition to use, fertility concerns and lack of knowledge were significantly lower among women in the North. These results too, could support the premise that family planning is not of top priority in times and regions of conflict.
The higher odds for skilled assistance at birth among women in the north of Uganda, across the years 1988-2006, could be indicative of interventions and/or humanitarian assistance specifically targeting women in this region to improve birth outcomes and delivery services through the training and deployment of skilled personnel such as midwives and obstetricians, regardless of whether women chose to or were able to deliver in the hospital or at home. As highlighted by Orach and De Brouwere21, camped populations in conflict such as IDPs and refugees can often have better access and options for health care services compared to host populations due to international aid and additional health facilities being established in these areas; this could lend explanation to the observation of improved use of skilled assistance at birth by women in conflict-affected areas. Interestingly, in 2011, skilled assistance at birth was no longer significantly higher, possibly implying the cessation of such healthcare interventions in the North in the post-conflict period, or the relocation of populations from camp settings back to their homes where access to healthcare and basic resources was once again poor or problematic26. Similarly, although attendance at antenatal care sessions were not significant for the years of conflict, in 2011 the odds for this indicator was significantly lower for women in the North, possibly again due to the withdrawal of humanitarian organizations providing maternal health services. Odds for unskilled assistance (from traditional birth attendants, relatives, etc.) was significantly low for some years, again possibly due to the availability of skilled assistance, or the difficulties and insecurities of reaching these persons in times of conflict25.
While an increase in maternal healthcare utilization might be expect over time (particularly in the post-conflict period, compared with the conflict period), this was not apparent in this study. One explanation could be that by 2011, the North had not yet recovered to an extent where full functionality of the healthcare system and services had been sufficiently restored to show an increased level of health service utilization37. Given the extent and long-term nature of the population displacements that resulted from the conflict, the return and resettlement of populations to their original homes and rebuilding of societies and services undoubtedly requires significant amounts of time and investment in the region39.
This study has several limitations. Given that it explores the topic of armed conflict using population data from over a period of more than 20 years, the quality and completeness of the data is a critical factor in analyzing trends in maternal health service utilization in the North compared to the rest of the country. The DHS data sets from 1988 and 2000/2001 excluded data from some Northern districts (Kitgum, Gulu, Apac, Lira, etc.) due to security issues with obtaining the data from these regions during the conflict, and hence there is the possibility of over-representation of data from the Northern districts that were not as badly affected by the conflict, and under-representation of the impact of the conflict in districts that were more seriously affected. Secondly, the indicators for maternal healthcare utilization used in this study were limited to those around contraception, antenatal care and delivery; many more indicators are available in the DHS datasets and could provide a more comprehensive understanding of other aspects of maternal healthcare utilization, such as postnatal care. DHS data from the 5 sample sets could also not be disaggregated beyond the regional level, thereby limiting the extent to which this data could be mapped and compared with conflict intensity data for this region, available through the Armed Conflict Location and Event Data Project40. This analysis, if it had been possible, would have provided a more comprehensive and in-depth look at the effect of conflict intensity on maternal health care utilization in the different districts in Northern Uganda, and a better sense of the correlation between the two variables. Thirdly, data from the partners of women in this study were not analyzed; this includes indicators such as partner’s education, control over earnings, decision-making autonomy in the household, and relationship inequality, among others. These factors have shown to have a possible impact on maternal healthcare utilization in different settings41, and for future work, could provide an added level of analysis specific to the context in Uganda. Furthermore, other factors that could have influenced maternal healthcare utilization during the conflict, such the quality and availability of healthcare services, were not analysed due to limited scope of this study, as defined by the DHS variables available from the datasets. Finally, since many comparisons were made within the analyses, this may have increased the experiment-wise error rate of the results. However, when conducting exploratory analyses such as those in this study, it has previously been stated that correction for multiple tests is not always necessary42 .
Conclusion
The findings in this study have shown that armed conflict can have a negative impact on maternal healthcare utilization, as previous studies have also suggested. However, certain aspects of maternal healthcare utilization, such as skilled assistance at birth in this study, show better results in conflict areas, likely as a result of humanitarian aid interventions to ensure the continuity of some healthcare services. In terms of the speed of post-conflict recovery, this study indicates that a 5-year period is too short to see any significant improvement in maternal health utilization rates.
The complex nature of armed conflict and the interplay of different factors such as conflict intensity, weakened health systems and services, and humanitarian aid, make it challenging to propose a set of concrete recommendations on how to improve maternal healthcare utilization in such settings. One needs to bear in mind that prevailing challenges at the societal, healthcare system and individual level are usually exacerbated by conflict, and humanitarian interventions are temporary in nature and are not meant to be sustainable in the long-term or replace previously existing services. Therefore, in addressing the problem of maternal healthcare utilization in conflict, strategies that target both improving the availability, accessibility and quality of existing services during conflict, as well as ‘building back better’ in terms of strengthening health systems post-conflict, need to be considered.
Competing Interests
The authors have declared that no competing interests exist.
Corresponding Author
Amrita Namasivayam: [email protected]
Data Availability
Data used for this project is owned by MEASURE DHS. Requests for this data can be made by registration and application via https://dhsprogram.com/data/Access-Instructions.cfm. The authors confirm that they accessed the data used for this study in this manner.
Method: This was a cross-sectional study of factors determining of DPB in a representative sample of 1233 Tehran inhabitants. Measures derived from the TPB were obtained in the unprepared and prepared people.
Results: Consistent with the theory, intentions to do DPB could the person predicted from attitudes, subjective norms, and perceived behavioral control with respect to DPB; and actually doing DPB was strongly related to intentions and perceptions of control assessed in the prepared people. Theoretical and practical implications of these findings are discussed.
Conclusion: An effective intervention will not only have to encourage people of the desirability of DPB, but also to provide them with the skills and means to do it. The more strongly they can be made to feel that they have control over DPB, the more likely they are to carry out their intentions. That is, heightened perceived control tends to strengthen people’s motivation to do DPB.
Key words: theory of planned behavior; disaster; preparedness
]]>Introduction
A disaster is “a serious disruption of the functioning of a community or a society involving widespread human, material, economic or environmental losses and impacts, which exceeds the ability of the affected community or society to cope using its own resources”1. Although the categories and causes of disasters may differ, their impacts are common; therefore, a disaster plan should address disaster impacts2. Disaster preparedness is defined as actions that ensure resources necessary to carry out an effective response are available before a disaster, or they can be obtained promptly when needed3. Disaster preparedness are preparations and adjustments such as storing food and water, preparing a household emergency plan, preparing an emergency kit, and other activities that reduce risk or injury and damage4. Actually, disaster preparedness is a health protective behavior, so the behavioral approaches have taken center stage as a means of it. Even though hundreds of thousands of lives were affected without warning by disasters yearly, most people do not concern themselves by preparing until disaster strikes5. Therefore, it has become obvious that a more broad-based effort of behavioral change is required. Effective interventions to promote disaster preparedness require a thorough understanding of the factors that influence performance or nonperformance of disaster preparedness behaviors (DPB).
According to many studies conducted on disaster preparedness, several factors affecting preparedness include: critical awareness2,4,6, risk perception7,8,9, preparedness perception10,11,12, self-efficacy10,13,14,15,16, collective efficacy16, locus of control9,15,17, fatalism9,14,17,18,19, anxiety4,17,20, previous disaster experience8,9,21,22, societal norms23, sense of community24, community participation and empowerment25,26, optimistic and normalization biases27,28, social trust29, perceived responsibility8,11, responsibility towards others6, coping style10,13,30,31 and available resources25,32.
Several theoretical frameworks can be employed in attempts to deal with behaviors that reduce the risk of natural disasters including: Protection Motivation Theory(PMT)12,33, Person Relative to Event Theory (PrE)11,34, Protective Action Decision Model (PADM)35,36, Social-Cognitive Preparation Model4 and Theory of Planned Behavior (TPB)37,38.
To date, there has been no study of people using the TPB to explain variability in DPB. The application of a model that explained a significant amount of variance in intentions and behavior would assist in helping develop interventions to disaster risk reduction.
The aim of this study was to examine the theory of planned behavior and investigate its utility in explaining and predicting the factors associated with DPB.
The TPB is a efficacious framework for investigating antecedents of behavior (Figure 1). A central factor in the TPB is the individual’s intention to perform a given behavior. Intentions are assumed to capture the motivational factors that influence a behavior39. Intentions are determined by three preceding motivational factors. The first is the attitude toward the behavior and refers to the degree to which the individual has a favorable or an unfavorable evaluation of the behavior in question. The second predictor is a social factor termed subjective norm; it refers to the perceived social pressure to do or not to do the behavior. The third predictor of intention is the degree of perceived behavioral control which refers to the perceived ease or difficulty of performing the behavior. As a general rule, the more favorable the attitude and subjective norm toward a behavior, and the greater the perceived behavioral control, the stronger should be a person’s intention to perform the behavior under consideration. Intention, in turn, is viewed as one direct antecedent of actual behavior. However, the level of success will depend not only on one’s intention, but also on such partly non-motivational factors as availability of requisite opportunities and resources that represent people’s actual control over the behavior40.
The relative importance of attitude, subjective norm, and perceived behavioral control in the prediction of intention, and the relative importance of intention and perceived behavioral control in the prediction of behavior are expected to vary across behaviors and populations39.

Fig. 1: Theory of planned behavior (Ajzen, 1991)
DPB and the Theory of Planned Behavior
The theory of planned behavior can be directly applied in the domain of disaster risk reduction. The behavior of interest for present purposes is DPB. According to Ajzen41, considering DPB as a category of behaviors, not a single action was studied. The behavioral elements of the public readiness index (PRI) were used for defining and assessing the DPB (Table 1)42. The validity and reliability of PRI have been shown in previous studies43.
It is hypothesized that intentions to do DPB can be predicted from attitudes, subjective norms, and perceived behavioral control with respect to the behavior; and that actually doing DPB can be predicted from intentions and perceptions of behavioral control. The prediction of DPB, however, depends on the chronological stability of intentions and perceived behavioral control40. If these variables change prior to observation of the behavior, they can no longer permit accurate prediction. In addition, precise behavioral prediction also depends on the actual perceived behavioral control. Only if perceptions of control are reasonably accurate will a measure of this variable improve prediction of behavioral success.
1
Preparation of a home disaster supply kit
2
Preparation of a “go” kit for work or car
3
Creation of a family communication plan
4
Designation of a specific meeting place during an emergency
5
Practicing and performing drills for emergency situations
6
Volunteering to help in emergencies
7
Having successfully completed a first aid training in the past 5 years
Materials and Methods
Study population and sampling
This cross-sectional survey was conducted in August 2015. The study population included inhabitants of Tehran who were 18 years and older. 1250 inhabitants were selected in the study through a random multistage sampling method from 22 districts in Tehran. The sample size for each district was calculated to be proportional to the size of the district populations. First, after numbering the blocks, one of the blocks was chosen randomly in each district. At the second stage, moving in a clockwise direction from that corner, all houses up to the next corner were numbered and one of these, the first unit in the sample was also randomly selected. Trained interviewers started from the first selected unit and filled the questionnaire. Then the next three units were systematically skipped and an individual in the fifth household was interviewed and this continued until the end of the block. If the selected block did not include enough samples, the next block was selected for completing the cluster.
The study was approved by the Tehran University of Medical Sciences Research Ethics Committee. Written consent was received from participants. We did not collect any identifying data.
Questionnaire
The questionnaire, which took about 30 min to complete, contained a variety of items dealing with DPB. In addition, measures of sociodemographic characteristics were also obtained. All questions of interest for the present study dealt with the DPB. Three items measured intention to perform DPB. Three items were used to assess attitudes toward DPB. For subjective norms four items were used. Three items were also used to assess perception of behavioral control. Self-reports of DPB were assessed by means of 7 questions (Table 1).
Analysis
17 of the 1250 questionnaires were invalid because of missing data and so were excluded from subsequent analyses. The data were grouped according to DPB score. The grouped data were subsequently statistically analyzed using independent t-test to compare means of the variables of TPB among prepared and unprepared people. Structural equation modeling44 is used to evaluate the fit between the data and the TPB, taking into account random and systematic measurement error, and to estimate the amount of variance in intentions and behavior explained by the model.
Results
62.3% of participants were male and the mean age of all participants was 44.14 (SD = 12.53). 71.5% of participants had high school or higher education. 34.5% of participants were currently unemployed (including jobless participants, retired, students and housewives). 54% of participants were owner of their home and most of them (82.5%) living in apartments. 83.5% of the households had less than 4 members. 58.4% of the respondents had not experienced any disaster in the past 20 years. Only 16.3% of participants were not heads of households. 68.1% of responders lived in the high or medium risk districts of Tehran. Most of the participants (65%) reported that they were low income earners. Only 10% of the participants had DPB score of 5 or more which defined as prepared persons (Table 2).
Data analysis showed that monthly income level, previous disaster experience, residential district and occupation are demographic factors that influence DPB significantly. However, disaster preparedness was not affected by gender, educational level, number of household members, home type, home ownership and being the head of household.
DPB score
Frequency
Percent
Cumulative Percent
0
531
43.1
43.1
1
246
20
63
2
147
11.9
74.9
3
99
8
83
4
87
7.1
90
5
52
4.1
94.2
6
27
2.2
96.4
7
45
3.6
100
Table 3 shows the means and standard deviations of TPB variables in prepared and unprepared people. Higher means show more favorable dispositions. It can be seen that respondents were positively inclined toward doing DPB. They held highly positive attitudes toward DPB, they somewhat believed that their family, friends and colleagues approved of it, they were moderately confident that they could perform it, and they moderately intended to do DPB. In contrast, self-reported doing DPB was relatively low. Only 10.0% of the respondents reported doing DPB, while 43.1% reported doing so almost never. Clearly, many people who intended to do DPB in actuality failed to do so. Comparison of the means obtained in the prepared and unprepared people shows that overall differences were relatively small.
Note: N1= 123 (for prepared people); N2= 1110 (for unprepared people)
Prepared
Unprepared
All Participants
Latent variable
M
SD
M
SD
M
SD
Attitude toward DPB
5.86
1.54
5.41
1.43
5.46
1.45
Subjective norm
5.29
1.08
4.73
1.08
4.79
1.09
Perceived behavioral control
5.24
1.34
4.82
1.0
4.87
1.05
Intention
4.54
1.18
4.05
0.91
4.10
1.55
Behavior
5.95
0.08
1.07
0.04
1.55
1.93
Independent t- test was used to define any significant difference between prepared and unprepared people. This analysis showed that attitudes of prepared persons toward DPB were significantly more positive than unprepared ones (t= 3.29, p<0.001). It also showed that the prepared persons perceive more social pressure than unprepared ones to perform DPB (t= 5.40, p<0.001). In addition, the people who were prepared had more perceived behavioral control to do DPB when compared to the unprepared people (t= 3.34, p<0.001). Intention and behavior were also significantly different between prepared and unprepared people.
We examined the capacity of the theory of planned behavior to account for intentions to do DPB and its ability to predict actual behavior. Two structural equation models were evaluated: the first relies on the data from the unprepared persons, the second on data collected from the prepared people.
Unprepared people
The first structural model to be evaluated examines the associations between attitudes, subjective norms, perceptions of behavioral control, and intentions assessed in the unprepared people, as well as the effects of intentions and perceived behavioral control on reported DPB. This model, as well as the subsequent model, were evaluated using IBM-SPSS AMOS (Version 24.0). This software enables us to specify, estimate, assess and present models to show hypothesized relationships among variables. It lets us build models more accurately than with standard multivariate statistical techniques.Except for DPB, all variables in TPB were assessed by multiple indicators, enabling detection and control for random and non-random measurement error.
The chi-square goodness-of-fit test was not significant, χ2 (70, N =1110) = 17.21, p < 0.20, and the goodness-of-fit index44 of 0.98 indicated that there was a very good fit between model and data. Additional goodness-of-fit indices corroborated this conclusion: Comparative Fit Index (CFI)= 1.00, standardized Root Mean Squre Residuals (RMR)= 0.04, and Root Mean Squre Error of Approximation (RMSEA)= 0.00, p = 1.0. Attitudes, subjective norms, and perceived behavioral control accounted for 56.3% of the variance in intentions to do DPB. The measures of these variables were all obtained in the unprepared people. In contrast, only 10.5% of the variance in behavior was accounted for by the model’s two predictors, intentions and perceptions of behavioral control.
Figure 2 shows the path coefficients in the completely standardized solution. The relatively high factor loadings of the indicators imply that the measures had a satisfactory degree of internal consistency. All structural relations were significant at p < 0.05, except for the paths from perceived behavioral control to behavior.
In sum, the results for the unprepared people demonstrated a good fit between the TPB and the obtained data. The theory accounted for a considerable proportion of variance in intentions to do DPB, but the people actually accomplished their intentions depended on perceived behavioral control. The more control they believed they had, the more likely they were to do DPB in accordance with their intentions. Perceived behavioral control did not have a significant effect on behavior for the unprepared participants. As an alternative, its effect was found to depend on intention. Doing DPB increased with perceived control only for respondents who intended to do DPB consistently.
*Coefficient not significant. A= attitude toward behavior; SN= subjective norms; PBC= perceived behavioral control; INT= intention; DPB= disaster preparedness behavior
Fig. 2: Prediction of intentions to do DPB and actual doing DPB. Standardized coefficients in the TPB – Unprepared people.
Prepared people
The next structural model examines the associations between attitudes, subjective norms, perceptions of behavioral control, and intentions assessed in the prepared people, as well as the effects of intentions and perceived behavioral control on DPB reported at the same point in time.
As prepared people had more information about DPB, it is expected that their behaviors will have brought expressed attitudes, subjective norms, perceptions of control, and intentions more in line with the actual preceding behavior. The consequence leading to stronger structural relations in the paths leading to DPB. The results of the structural equation analysis support these expectations.
The chi-square goodness-of-fit measure, χ2 (70, N=123) = 35.85, p< 0.20, and the goodness-of-fit index (GFI = 0.96) indicate a very good fit between model and data. Additional goodness-of-fit indices indicated alike results: CFI=0.99, RMR= 0.04, and RMSEA=0.02, p < 0.87. Attitudes, subjective norms, and perceived behavioral control accounted for 32.0% of the variance in intentions to do DPB. This estimate is unexpectedly lower than in the unprepared people, where 56.4% of the variance in intentions was accounted for, but it is still of suitable magnitude. By way of contrast, for prepared people, the results showed the expected betterment in the prediction of DPB. Whereas only 10.5% of the behavioral variance was explained using data from the unprepared people, with data from the prepared people, 62.8% of the variance in behavior was accounted for. Furthermore, the results indicated perceived behavioral control made a significant contribution to the prediction of DPB, as can be seen in Figure 3.
The factor loadings of the indicators of constructs again showed satisfactory convergence. The ordering of the structural coefficients in the prepared people was the same as in the unprepared ones. Attitude was the most dominating factor in shaping intention to do DPB, followed by subjective norm and perceived behavioral control. The amount of the coefficients, however, was generally smaller than in the unprepared people (Figure 2).
A= attitude toward behavior; SN= subjective norms; PBC= perceived behavioral control; INT= intention; DPB= disaster preparedness behavior
Fig. 3: Prediction of intentions to do DPB and actual doing DPB. Standardized coefficients in the TPB –Prepared people.
Discussion
The present study used the TPB to examine doing DPB in a representative sample of Tehran inhabitants and we attempted to predict DPB in them. We relied on the cross-sectional data available at the time of study.
Attitudes and subjective norms and perceptions of behavioral control were found to have significant effects on intentions. The data were examined in both unprepared and prepared people that revealed a more complex picture. There were statistically significant differences between the prepared and unprepared people in the variables of TPB (attitudes toward DPB, subjective norms, perceived behavioral control, and intentions).
Another remarkable finding to emerge in the two group analysis had to do with the role of perceived behavioral control. On average, respondents reported a low level of doing DPB, despite their strong intentions to do so. At least two reasons for this inconsistency can be suggested. First, “doing DPB” is open to interpretation regarding the definition of preparedness. Second, and of greater interest for present purposes, the discrepancy between intentions and behavior may be attributable to unrealistic perceptions of control. Respondents may underestimate or exaggerate the difficulties involved and develop realistic perceptions of behavioral control only with a considerable amount of direct experience.
Perceived behavioral control expressed in the unprepared people was unrelated to DPB (Figure 2), although it did affect DPB in interaction with intentions.
A final finding of significance has implications for the sufficiency assumption of the theory of planned behavior. According to TPB, the effect of new information on later intentions and behavior is mediated by attitudes, subjective norms, and perceptions of behavioral control. Assessing the variables in the TPB model should thus be adequate to predict intentions and behavior. However, the data showed a direct effect of past behavior on later intentions, unmediated by attitudes, subjective norms, and perceived behavioral control. This finding shows violation of the sufficiency assumption. A methodological explanation would attribute the observed insufficiency to unreliability in the measurement of the theory’s constructs. However, analysis of structural equation model corrects at least for low internal consistency amongst the indicators of TPB latent variables.
One last explanation for the direct effect of precedent behavior on intentions should not go unstated. It is possible, of course, that the TPB does not provide a complete description of the processes that underlie the formation of intentions to do DPB. It is needed to repeat the present study with more representative measures of attitudes, subjective norms, and perceptions of control, and to evaluate the direct and indirect effects of precedent behavior on intentions and DPB.
Conclusion
The results of the present research have essential practical implications for strategies of intervention. First, DPB was found to be influenced both by intentions and perceptions of behavioral control. Therefore, an effective intervention will not only have to encourage people of the desirability of DPB, but also to provide them with the skills and means to do it. The more powerfully they can be made to feel that they have control on DPB, the more likely they are to perform their intentions. That is, heightened perceived control tends to reinforce people’s motivation to do DPB.
CORRESPONDING AUTHOR
Mehdi Najafi, MD, MPH, PhD
Email: [email protected]
University of Social Welfare & Rehabilitation Sciences. Research Center in Emergency & Disaster Health
COMPETING INTERESTS
The authors have declared that no competing interests exist.
FUNDING STATEMENT
The authors received no specific funding for this work.
DATA AVAILABILITY
All relevant data are in the article.
Methods. A longitudinal cohort study was implemented from January 2015 through August 2016 to evaluate the effectiveness of treatment guidelines and an mHealth application on quality of care and health outcomes for patients in primary health care facilities in Lebanon serving Syrian refugees and host communities.
Results. Overall, reporting in clinic medical records remained low, however, during the mHealth phase recording of BMI and blood pressure were significantly greater in the mHealth application as compared to clinic medical records. Patient exit interviews reported a much more frequent measurement of weight, height, blood pressure, and blood glucose, suggesting these may be assessed more often than they are recorded. Satisfaction with the clinic visit improved significantly during implementation of the mHealth application as compared to both baseline and guidelines implementation in all measures. Despite positive changes, provider uptake of the application was low; patients indicated that the mHealth application was used in a minority (21.7%) of consultations. Provider perspectives on how the application changed patient interactions were mixed.
Discussion. Similar to previous evidence, this study further demonstrates the need to incorporate new interventions with existing practices and reporting requirements to minimize duplication of efforts and, consequently, strengthen provider usage. Additional research is needed to identify organizational and provider-side factors associated with uptake of similar applications, particularly in complex settings, to optimize the benefit of such tools.
]]>Introduction
Since the outset of the Syrian conflict in March 2011, an estimated 4.6 million Syrians have fled to neighboring countries.1 With over 1.1 million Syrian refugees registered with the United Nations High Commissioner for Refugees (UNHCR) as of January 2017, Lebanon is host to the highest number of refugees per capita in the world.2 Health assistance for Syrian refugees is based on the primary healthcare strategy and coordinated by UNHCR and the Lebanese Government. Syrian refugees can utilize primary healthcare services at subsidized rates in select existing primary healthcare centers and primary level facilities across Lebanon. Public sector care for Syrian refugees and vulnerable Lebanese based on routine care in primary health facilities with referral to secondary and tertiary care for management of difficult cases and complications.
Type 2 diabetes prevalence has been estimated at 7.4% in Syria and 14.4% in Lebanon.3 Previous literature has estimated regional prevalence of hypertension at 29.5%, prevalence in Syria at 24.9%, and 28.8% in Lebanon.4,5,6 National and international assistance agencies face immense challenges in providing for the needs of affected populations in both refugee and host communities due to the high burden of noncommunicable diseases (NCDs) among refugees and the host country population. These are complex conditions to manage, and the resources for refugee care limited.7,8,9 Intervention through mobile technologies (mHealth) has become increasingly common in recent years, and have shown promise in the potential for technology to leverage the widespread adoption of mobile devices and overcome infrastructure limitations in low-resource or complex settings.10,11 Such interventions use mobile devices to improve public health across a wide range of domains with applications including but not limited to client education, point-of-care diagnostics, electronic health records and decision support, patient-provider communication, provider training and education, etc.12
In consideration of this, we undertook a study to evaluate the effectiveness of treatment guidelines and an mHealth application on quality of care and health outcomes in primary care settings in Lebanon. Findings related to the mHealth application, including quality of the care-seeking interaction, patient satisfaction and provider perceptions, are presented along with discussion of potential deployment of mHealth applications for use in hypertension and diabetes care in humanitarian settings.
Methods
A longitudinal cohort study was implemented from January 2015 through August 2016 in primary health facilities in Lebanon that serve both Syrian refugees and Lebanese. Its two research aims were: (i) to develop, adapt, and test existing standards and guidelines for treatment, including counseling, for persons with hypertension and type 2 diabetes (or both); and (ii) to evaluate the effectiveness of an mHealth tool. Standard best-practice guidelines were adapted to the local context taking into account national protocols, prescribing practices, and the primary care context where they would be applied. Providers were subsequently trained in use of the guidelines and provided with written materials to support clinical decision making.13,14,15 The mHealth application included a patient-controlled health record (PCHR) and served as an electronic medical record as well as a decision support tool for providers. The mHealth tool has the potential to improve quality and continuity of care, health literacy, and health outcomes for patients. Providers were trained in use of the application and support provided to health facilities for its implementation.16 The study used a phased introduction of the two interventions over 20 months with longitudinal measurement of outcomes. The clinics continued to use their standard record systems which were either paper or electronic.
Participants consisted of patients at ten health care centers in Lebanon supported by the International Organization for Migration (IOM) and International Medical Corps (IMC) in the South (n=3), Bekaa (n=3), and Beirut/Mount Lebanon (n=4) governorates (Figure 1). Patients at these locations were predominantly Lebanese and Syrian refugees. Individuals without a diagnosis of hypertension or type 2 diabetes, those less than 40 years of age, and adults lacking capacity to independently participate in interviews were excluded.
Figure 1. Participating Primary Health Centers by Geographic Area
A total of 1020 participants were enrolled and 793 (78%) completed the study. Sample size calculations were based on the proportion of providers that adhere to treatment guidelines, and assumed a baseline rate of 50% for adherence to guidelines (the most conservative rate that would ensure the ability to detect significant differences from all other rates). This is a reasonable assumption given that proposed guidelines did not differ substantially from other best practice guidelines, thus patients could be on recommended treatment at baseline. Sample size calculations were performed using Stata 13, assumed α=0.05, β=0.20 (power=0.80) and were one-sided based on the assumption that quality of care will not decrease because of the intervention. The final sample of 793 participants was sufficient to detect increases ≥5.0% for provider adherence to guidelines.
This study was designed using a mixed method approach with qualitative and quantitative data collected throughout. Patients were recruited at clinics and if they indicated willingness to participate, a follow up phone call was made. This verified consent and a baseline interview collected information on demographic characteristics; medical history and recent care seeking behaviors; and knowledge, attitudes, and practices related to type 2 diabetes and/or hypertension. Following enrollment, medical record reviews were also conducted for each patient recording information related to provider compliance with guidelines and quality of care; frequency of visits; generic patient outcomes (death and loss to follow-up), and disease-specific patient outcomes (complications and adverse events of hypertension and type 2 diabetes). Phone interviews and record reviews were repeated at the end of each study phase (guidelines, mHealth). In addition, a subset of patients were telephoned after facility visits to complete a brief exit interview. Both patients and providers participated in focus group discussions at the end of guidelines (providers only) and mHealth application phases.
Data were collected on tablets using the Magpi mobile data platform by DataDyne LLC (Washington, DC) and analyzed using Stata 13 (College Station, TX) using descriptive statistics and standard methods for comparison of means and proportions. Uptake of the mHealth application was low; a total of 154 records were extracted from the application dataset whereas a total of 878 record reviews were completed in the mHealth phase. Differences in patient characteristics and phases were examined using chi-square and t-test methods. An immediate form of two-sample tests of proportions was performed using the Stata ‘prtesti’ command to determine whether the proportions in the mHealth app and paper records were statistically different. Focus group data were analyzed using qualitative description and content analysis.17
Ethics approval for this study was obtained from the Ministry of Public Health in Lebanon and Institutional Review Board at The Johns Hopkins Bloomberg School of Public Health.
Results
Quality of the Clinical Interaction. Completeness of reporting of clinical measurements in medical records was one metric used to assess the mHealth application. There was a statistically significant increase of 7.7% (CI: 4.6-10.8, p<0.001) in the proportion of patients with BMI reported in the mHealth phase as compared to the guidelines phase. However, following adoption of the mHealth application there were no significant changes in the proportion of hypertension patients that had blood pressure readings recorded (p=0.241) or diabetes patients that had blood sugar tests reported (p=0.297) (Figure 2). Overall, reporting in clinic medical records remained low, however, during the mHealth phase recording of BMI and blood pressure were significantly greater in the mHealth application as compared to clinic medical records (BMI: 47.4% vs 15.8%, p<0.001; BP: 74.5% vs. 40.7%, p<0.001); there was no significant difference in reporting of blood glucose test results (39.9% vs 34.0%, p=0.185). Patient exit interviews reported a much more frequent measurement of weight (67.8%), height (65.6%), blood pressure (88.9%), and blood glucose (79.1%), suggesting these parameters may be assessed more often than they are recorded. Quality of patient-provider interactions was assessed based on patient exit interviews conducted via phone within two weeks of the appointment. Statistically significant change was detected in all four measures (provider inquiry of medical history, complications with prescribed medication, prompting for questions from the patient, and recommending follow-up or referral care). Similarly, for lifestyle counseling, significant increases in the proposition of patients reporting that various types of lifestyle counseling given by health providers was observed in the mHealth phase (Figure 3).
Figure 2. Reporting of Clinical Indicators by Phase and Information Source in the mHealth Phase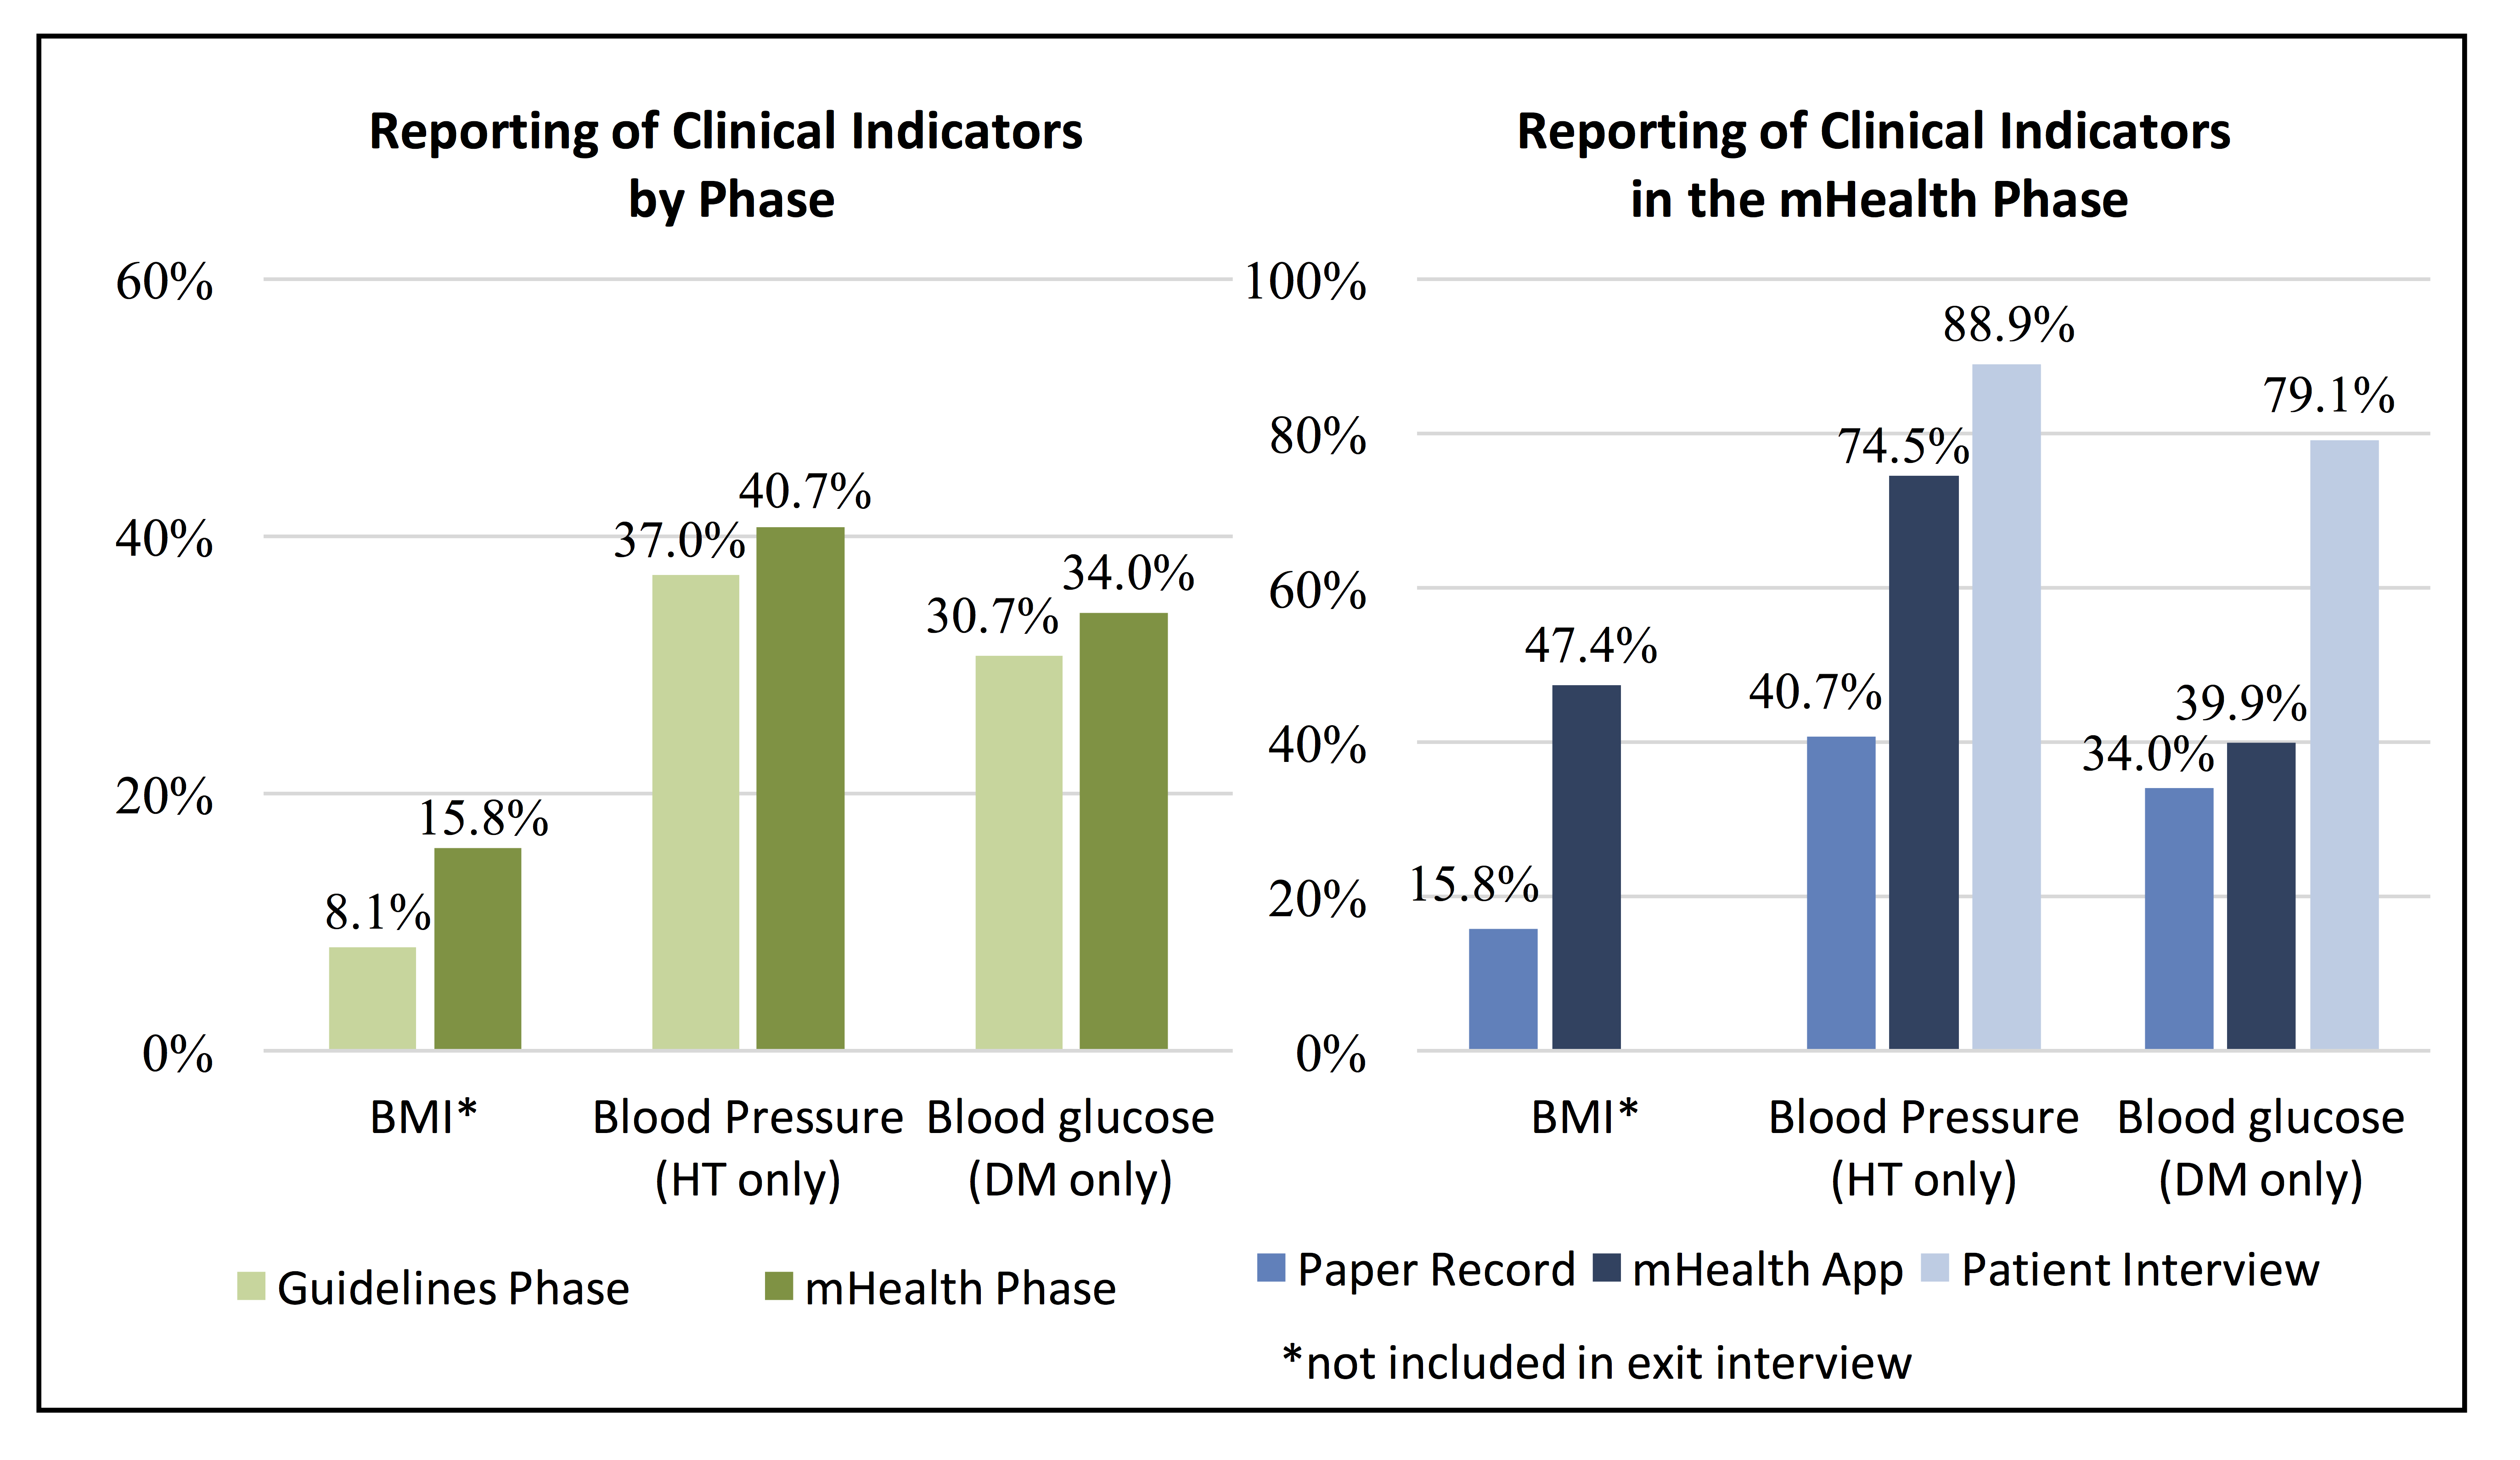
Figure 3. Change in Provider Interaction and Lifestyle Counseling between Phases*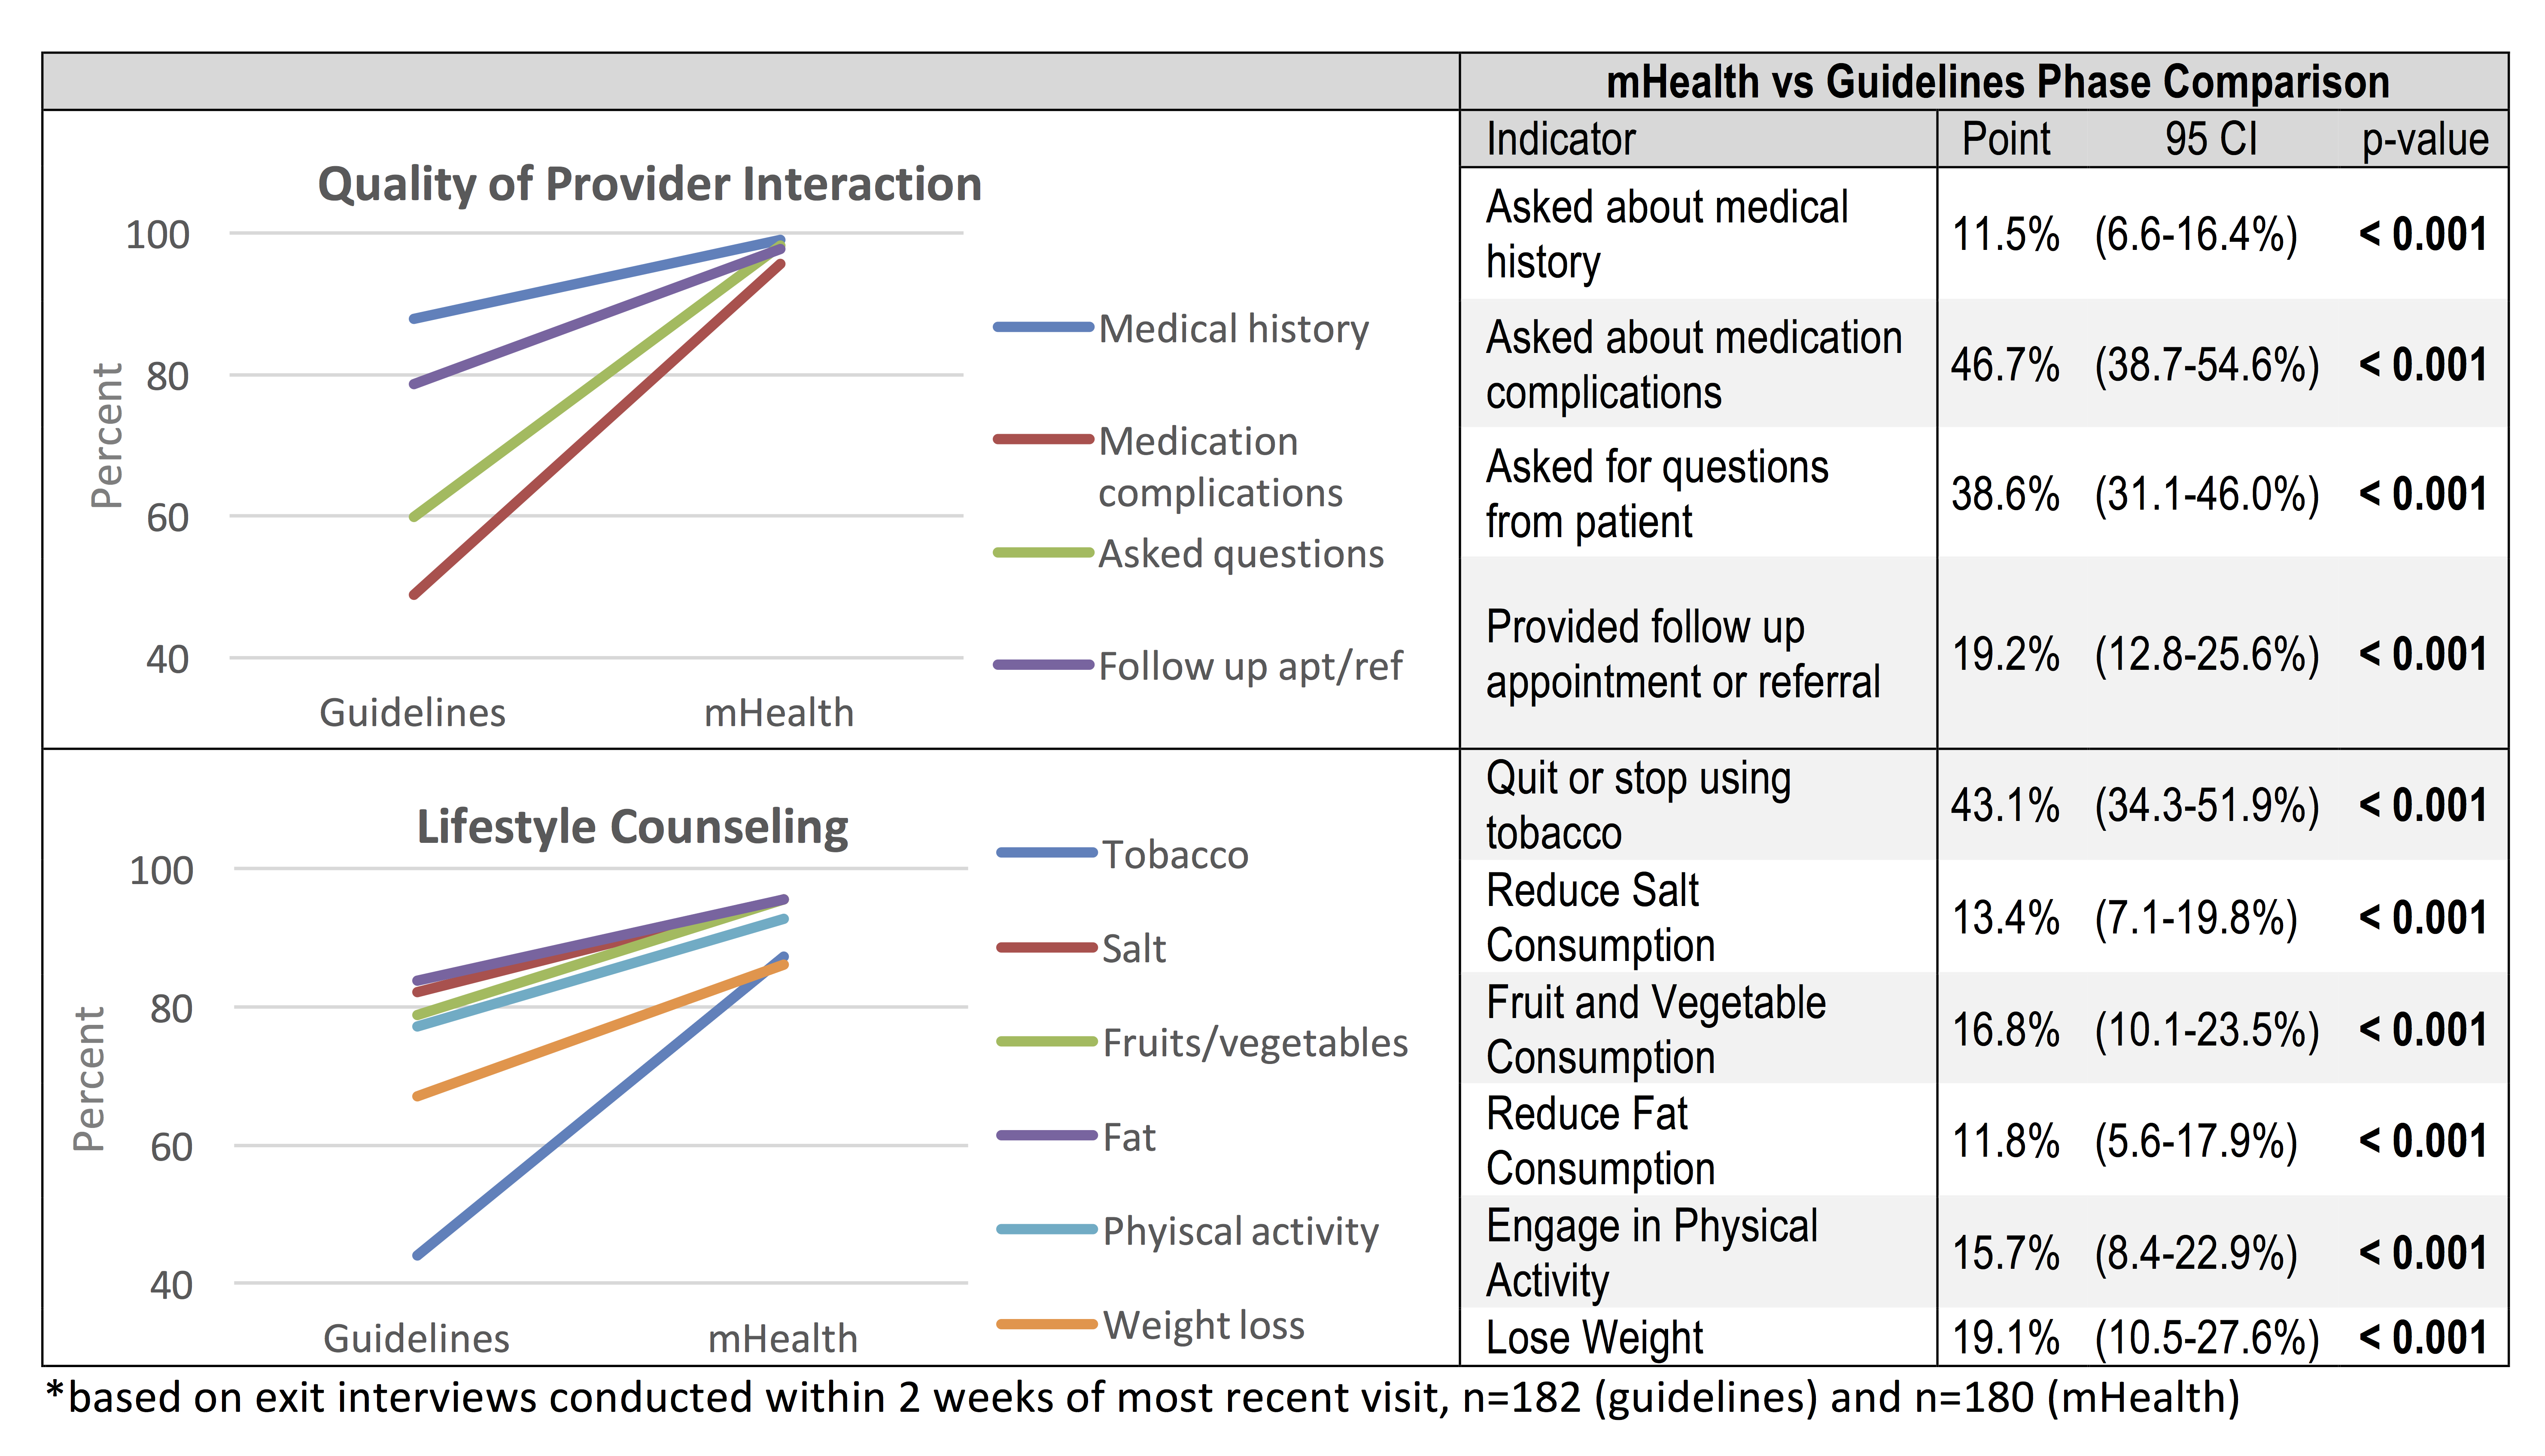
Despite positive changes in the quality of patient provider interactions and frequency of lifestyle counseling during the mHealth phase, patients indicated that the mHealth application was used in a minority (21.7%, CI: 15.9-28.4) of consultations (Table 1). While it is possible that the application was used after consultation, as was reported by providers, the intended use of the application during the consultation as a decision support tool occurred infrequently according to patients. Receipt of printed information on current medication and lifestyle modification (outputs of the mHealth application) was reported by 48.7% (CI: 32.4-65.2%) and a summary health record by 23.1% (CI: 11.1-39.3%) of patients, indicating application use may have been greater than the 21.7% of patients that recalled observing the provider used a tablet during the consultation.
Table 1. Use of the mHealth Application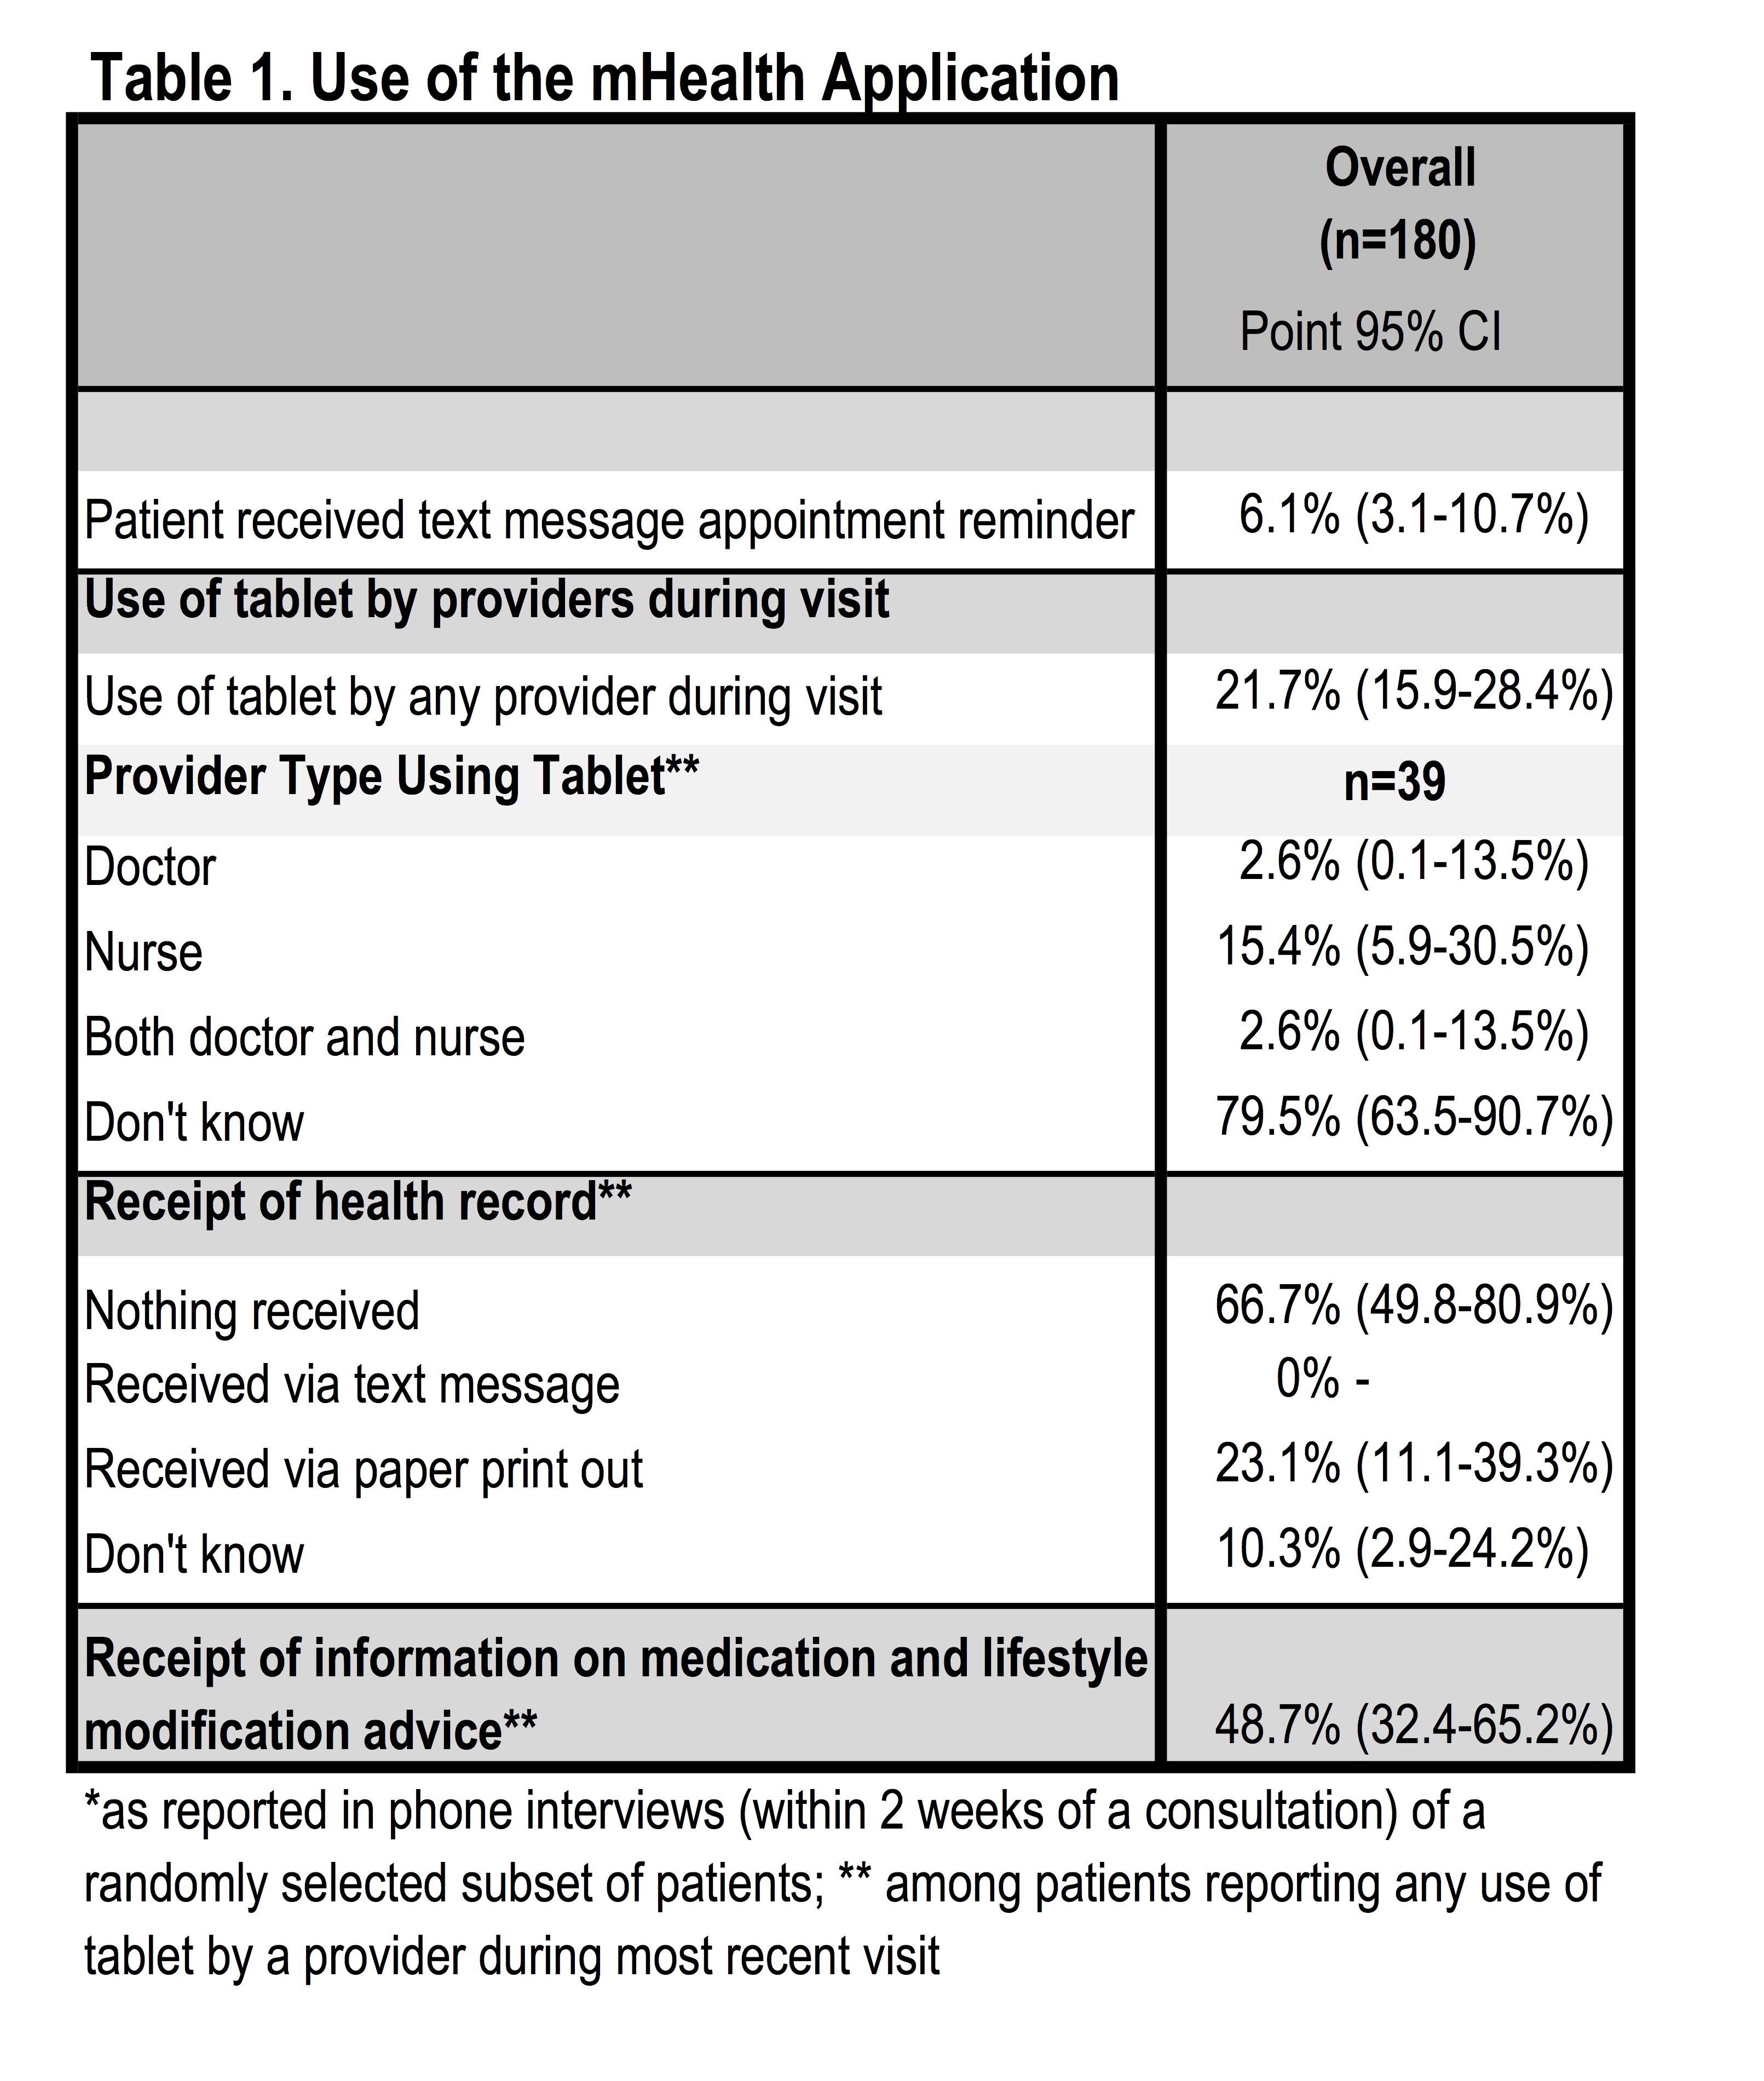
Patient Satisfaction. Patient satisfaction with health workers and clinical interactions was assessed based on patient exit interviews conducted via phone within two weeks of the appointment. Satisfaction with the clinic visit improved significantly during implementation of the mHealth application as compared to both baseline and guidelines implementation in all measures (Table 2). All patients agreed with the statement “I trust in the skills and abilities of the health workers” during implementation of the mHealth application, an 11.0% increase from 89.0% at baseline (p=0.001) and 3.9% increase from the guidelines implementation phase (p=0.007). Nearly all patients (98.9%) believed that health workers “did a good job explaining [their] illness” during the mHealth phase, a significant increase from 68.0% at baseline and 86.0% during guidelines implementation (increases of 30.9% and 12.9%, respectively; p=0.001). Similar changes were observed in patients’ belief that health workers “did a good job explaining [their] treatment” in the mHealth phase with 98.9% of patients reporting satisfaction in the mHealth phase as compared to 68.0% at baseline (30.9% increase, p=0.001) and 83.2% during guidelines implementation (15.6% increase, p=0.001). Patients’ perceived ability to discuss problems or concerns about their condition with the health workers was also reported by nearly all respondents during the mHealth phase (98.9%), significantly higher than at baseline (69.0%; 29.9% increase; p=0.001) and guidelines implementation (74.3%; 24.6% increase; p=0.001). Most patients (95.0%) felt they were involved in the consultation and treatment decisions during the mHealth phase, significantly greater than at baseline (58.0%; 37.0% increase; p=0.001) and during guideline implementation (79.3%; 15.7% increase; p=0.001). Satisfaction with the amount of time spent with health workers was also reported by nearly all patients in the mHealth phase (97.2%), a significant increase of 36.2% from 61.0% at baseline (p=0.001) and 9.0% increase from 88.3% during guidelines implementation (p=0.001).
Table 2. Patient Satisfaction and Perceptions of Care across Study Phases*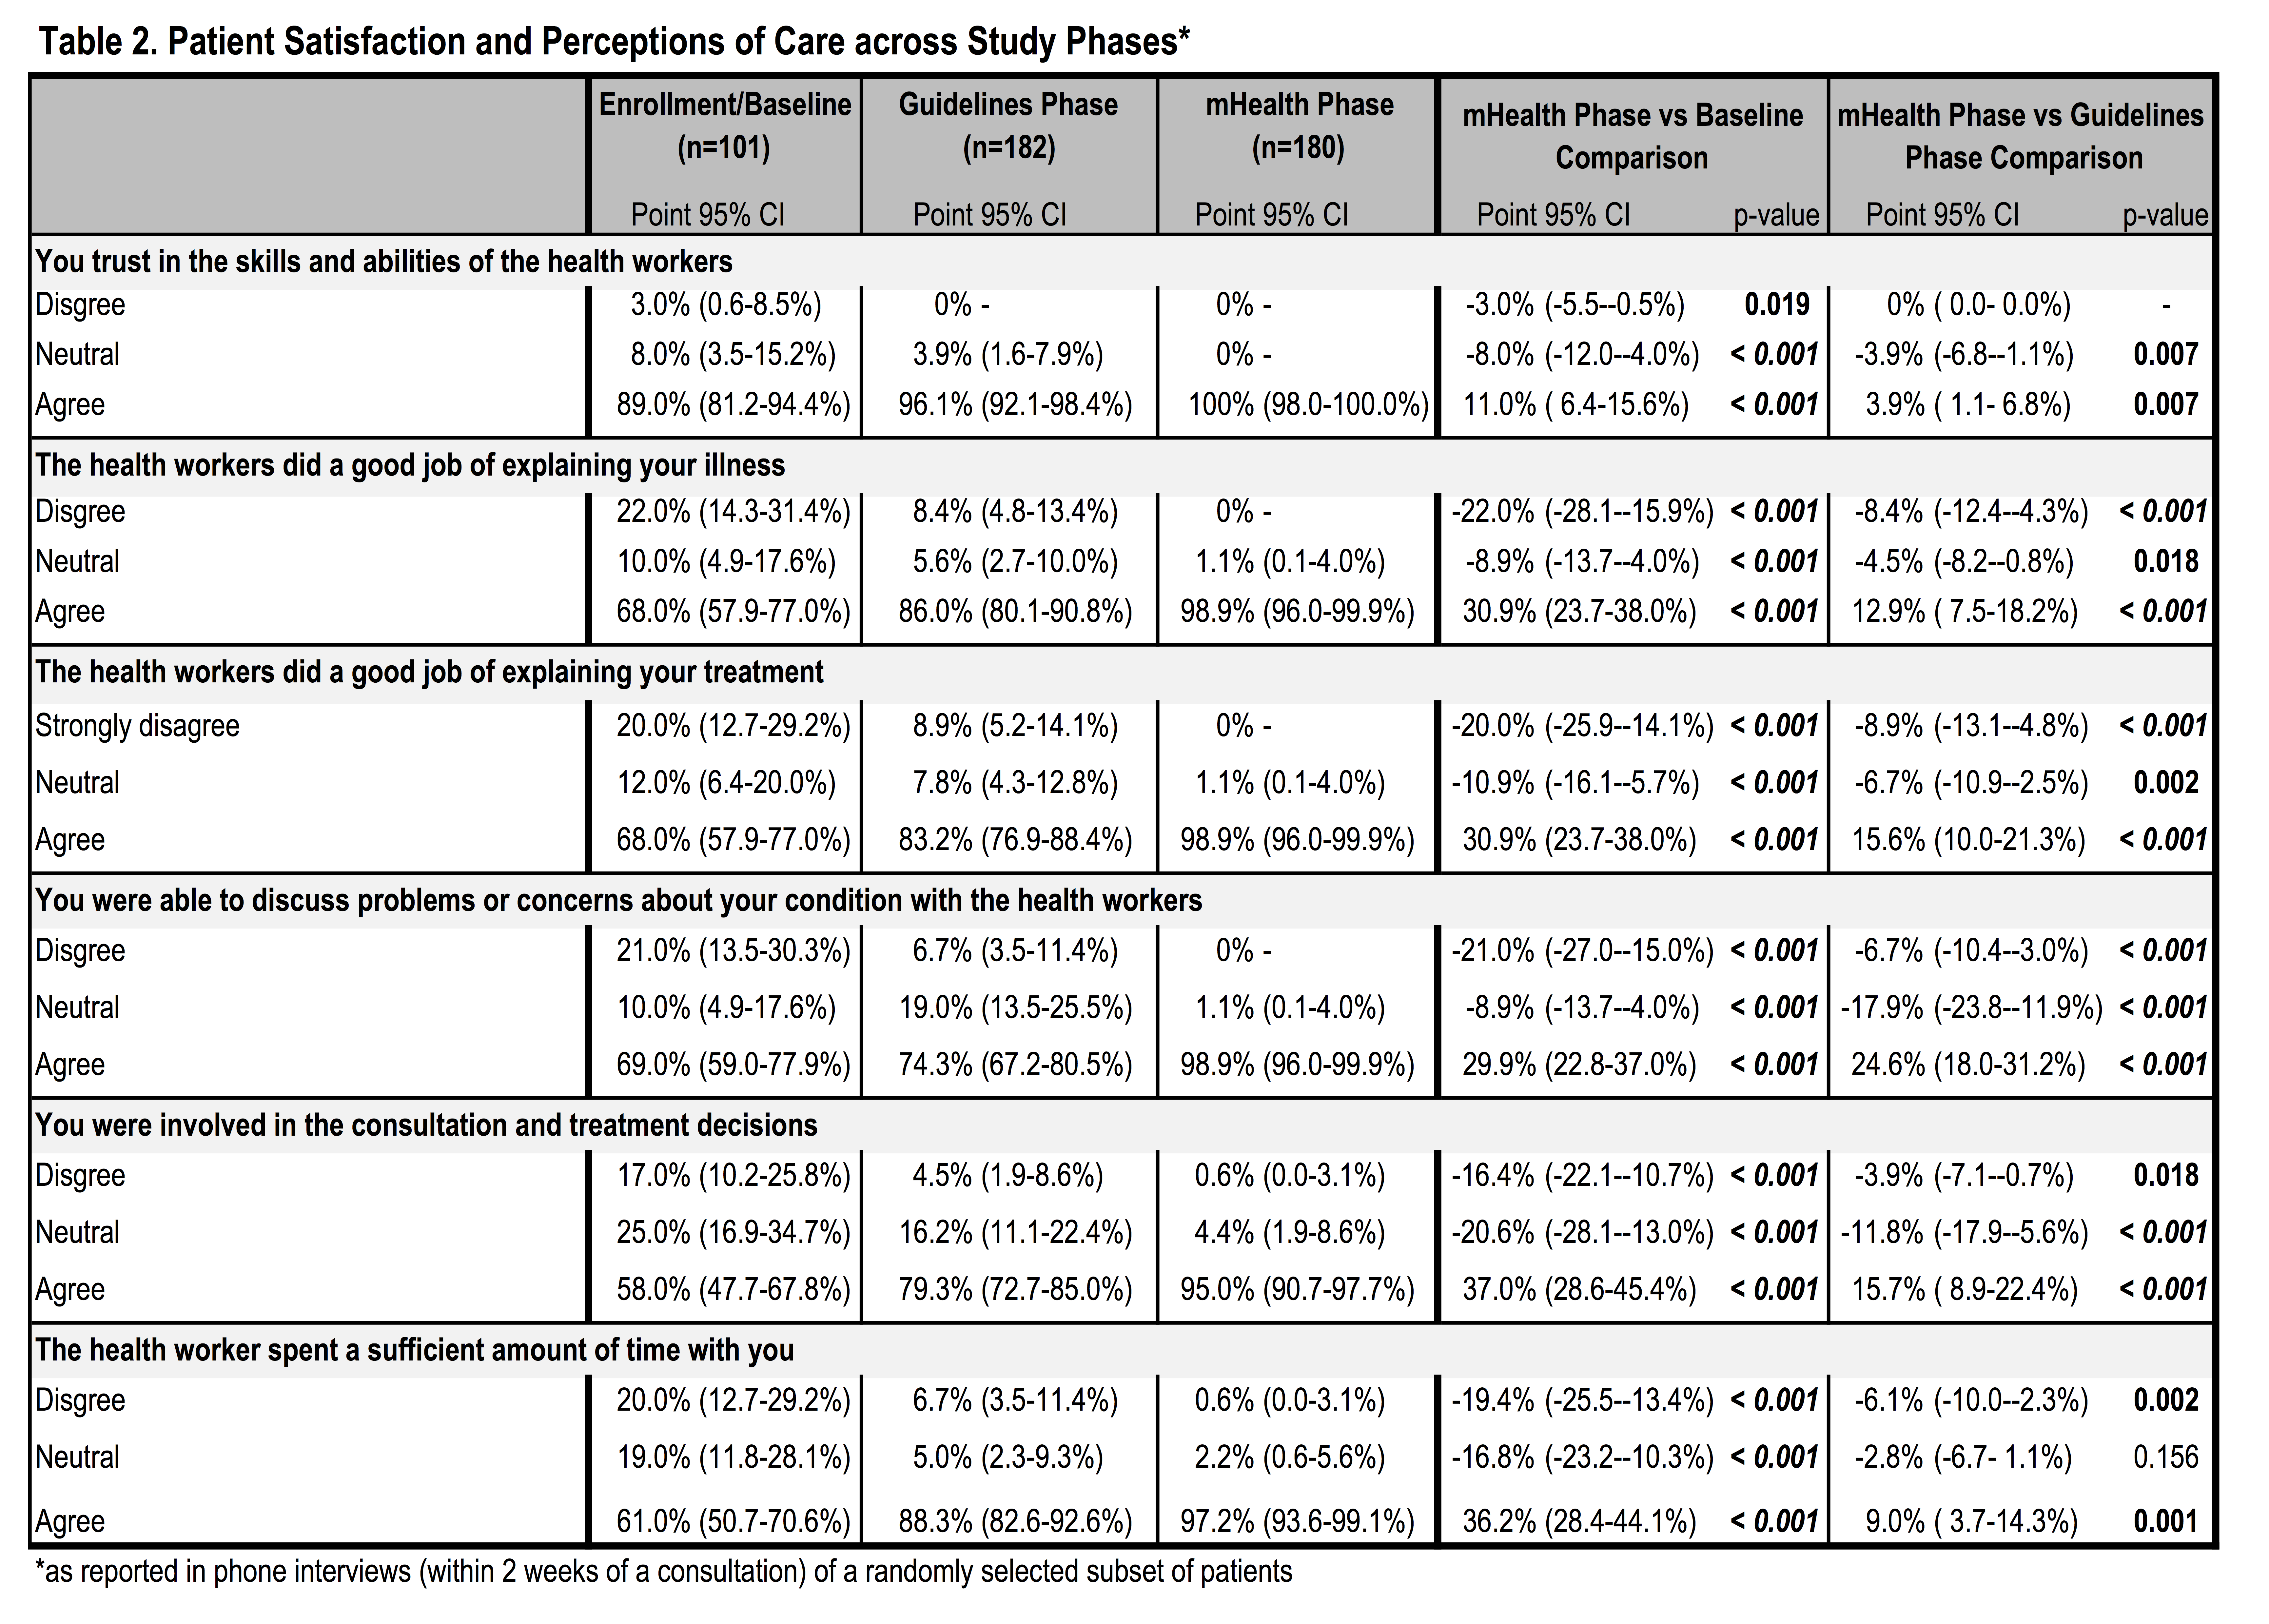
Provider Perceptions. Provider perspectives on how the application changed patient interactions were mixed. In some locations, the application was perceived as extra work or time consuming and provider attitudes were negative whereas in other places provider attitudes were positive and perceived benefits included improved patient understanding of lifestyle behaviors and medications, and greater patient satisfaction when the application was used. Providers noted the evidence-based standardized treatment algorithms, automated determination of BMI and risk category, the patient printouts, and ability to view the records across facilities as the main benefits to using the application. However, they indicated that gains in the ability to track patient information across time were minimal. The reasons given for this included the short evaluation period, where patients may not have returned for a follow up visit, and use of other electronic medical record platforms in some facilities.
Providers noted that using the application was time consuming and poor wireless connectivity sometimes made it difficult for patients to receive the printouts. Other reported challenges were technical glitches in the application and the fact that it was not integrated with existing systems. Recommendations to improve the utility of the application included addressing technical glitches, linking the application to existing electronic records systems, considering a dedicated staff member to use the application or dedicated clinic hours for patients with hypertension and diabetes, and expanding the lifestyle education component and the amount of detail included in patient print outs. Providers in clinics with electronic medical records systems were less inclined to continue use of the application than those in facilities with paper records but there was consensus that ongoing technical support would be required.
Discussion
The rapid expansion of mHealth interventions over the past decade has been justified by the immense potential of technology to overcome infrastructure limitations and leverage the widespread adoption of mobile devices.1011 Existing evidence of the efficacy, effectiveness, and implementation factors of mHealth interventions has largely been inconclusive and mixed, in part due to inadequate study design.18,19 As might be anticipated, there is limited evidence on the advantages of mHealth tools for NCDs in humanitarian settings. The strongest evidence, from a United Nations Relief and Works Agency for Palestine Refugees (UNRWA) pilot program aimed at addressing NCD treatment challenges, demonstrated that use of electronic medical records resulted in improved quality and continuity of care for diabetes and hypertension patients.20,21 A recent review of health interventions in humanitarian crises concluded there was minimal evidence for interventions for the most prevalent NCDs and recommended expanding the evidence base on interventions for common NCDs, such as hypertension and diabetes.22
The need to address NCD prevention and control in humanitarian settings is recognized, but there is little evidence to guide practice and policy.22 Knowledge exists around what interventions are effective, but there are gaps in the adaptation of protocols and guidelines to different crisis settings and in the implementation of NCD interventions.22 The global World Health Organization-International Telecommunication Union (WHO-ITU) mHealth initiative to promote the use of mHealth in the prevention, treatment, and control of NCDs could be applied in humanitarian settings to further strengthen the evidence base for intervention in these contexts.23 Current best practices include careful consideration for interoperability and open standards of mHealth tools as well as coordination with local governments, partners, and implementers. Previous evidence has shown that the added benefit of mHealth tools are most successful when providers and patients adhere to accepted guidelines and practices and are compliant with treatment prior to implementation. In these cases, mHealth tools may serve as a catalyst for improving health outcomes.24 However, as the authors of one review of mHealth tools for NCD treatment and management observe, “mHealth tools are communication platforms and delivery mechanisms, not solutions in and of themselves.”24
Difficulties in developing and deploying new technologies, including running repairs on technical glitches and challenges with initial programming and rollout/uptake of the application lessened usage by clinicians. Some providers initially interested in the application were disappointed by technical problems and frequent crashes in initial versions of the application, leading them to use the application less frequently over time. Low uptake persisted among some providers despite technical repairs and supportive supervision by study staff in health facilities. In the case of the Lebanon pilot, limited use of the application was related more to provider attitudes than objective usability or benefits. Providers conveyed numerous reporting requirements from the health facility itself, the MoPH, and supporting organizations. Many of these documentation requirements were perceived as duplicative and demanding on health providers’ time, a finding similarly observed in previous studies of similar mHealth interventions.24 The application was perceived as more beneficial in facilities that did not previously have electronic records/reporting. Incorporating an mHealth tool in a manner that facilitates streamlined reporting to fulfill the requirements of all necessary reporting is likely to improve uptake and complete reporting. The need for organizational changes to support feasibility and facilitate uptake of facility level mHealth interventions noted in previous studies similarly applies to the Lebanon pilot.25 Additionally, in Lebanon much of the care for persons with hypertension was provided by cardiologists and for diabetes by endocrinologists. In a location where patients with these conditions are treated by primary health personnel, the electronic treatment guidelines could have a greater ability to guide treatment, and consequently a greater uptake.
Elements of the mHealth application piloted in this study can be considered as focusing on “mAdherence” or the use of mHealth tools in improving patient adherence to chronic disease management. Examples of elements that may be included in mAdherence tools that have been previously examined include automated reminders, text messages with educational and motivational content, healthy living challenges, and wireless transmission of data which have been shown to contribute to increased self-care awareness and knowledge about chronic diseases.26,27,28,29 Portability of patient records across facilities, an initial goal of this application, has minimally been studied in the past, though is a strong advantage of PCHRs in areas with fluid population movement. Most previous mAdherence studies focus on outcomes related to patients as the end-user; far fewer studies address provider acceptability or related provider-side uptake factors.24 Those that have looked into provider-side factors identified similar implementation concerns as this study including, but not limited to increased workload, supervision needs, sound technical design, and usability.24,30 However, a 2008 study of electronic health record implementation in five provider organizations in the U.S. indicated that despite providers’ initial concerns that the process of implementing electronic health records would obstruct workflow, findings suggest that electronic health record implementation actually improved workflow by enhancing accessibility of patient information across clinics and systematizing staff communications.31
Limitations. Comparison of completeness of reporting across study phases may have underestimated changes in patient and provider practices in the guidelines and mHealth phases where all available information in the patient record was included at baseline, regardless of what was recorded at the most recent visit. Simultaneous development and introduction of the application led to frustration among users when the application did not perform as expected, which reduced provider enthusiasm. Another barrier to uptake was multiple reporting requirements and electronic record systems, which led to the perception that the application was redundant (despite dissimilarities to existing systems in most cases). While the completion rate was relatively high (78%), expired or changed phone numbers were the greatest contributor to incomplete patient follow-up. Population movement within or outside of Lebanon also contributed to a lesser extent to loss to follow-up (n=19). Given the older age and poor health status of enrolled patients inherent with study inclusion criteria, 17 patients (1.7% of enrolled patients) were deceased between enrollment and the end of the study period, though this was not necessarily as a result of conditions of interest in the study. Finally, including patients and providers from only ten health facilities limits representativeness of findings and results may not be generalizable to elsewhere in Lebanon or other settings.
Conclusion
The difficulties in developing and implementing facility level mHealth interventions in complex contexts are furthered by a paucity of evidence of provider acceptability and provider-side uptake factors. Evidence demonstrates the necessity of incorporating new interventions with existing practices and reporting requirements to minimize duplication of efforts and, in turn, strengthen provider usage. However, further research is needed to identify organizational and provider-side factors associated with uptake of similar applications, particularly in less developed and complex settings, including humanitarian contexts. A more robust evidence base for implementation of such tools is needed to maximize their benefit.
Corresponding Author
Shannon Doocy, Johns Hopkins School of Public Health, 615 N Wolfe St, Baltimore MD 21205. Tel. +1 410 502 2628. Email: [email protected]
Competing Interests
Shannon Doocy is a member of the PLoS Currents Disasters Editorial Board. The authors have no other competing interests.
Data Availability
Minimal underlying data for this manuscript is deposited publicly and can be accessed through the following reference: Doocy, Shannon, 2017, “mHealth tool for NCDs in Lebanon (app adoption analysis)”, doi:10.7910/DVN/WU9LBZ
Funding Statement
This research was funded by Research for Health in Humanitarian Crisis (R2HC). The funding body had no role in the design or implementation of the research and did not participate in analysis or presentation of findings.
Methods: A cross-sectional, total population audit of all known unintentional river flood related fatal drownings in Australia between 1-July-2002 and 30-June-2012 was conducted to identify trends and causal factors.
Results: There were 129 (16.8%) deaths involving river flooding, representing a crude drowning rate of 0.06 per 100,000 people per annum. Half (55.8%) were due to slow onset flooding, 27.1% flash flooding and the type of flooding was unknown in 17.1% of cases. Those at an increased risk were males, children, driving (non-aquatic transport) and victims who were swept away (p<0.01). When compared to drownings in major cities, people in remote and very remote locations were 79.6 and 229.1 times respectively more likely to drown in river floods. Common causal factors for falls into flooded rivers included being alone and a blood alcohol content ≥0.05% (for adults). Non-aquatic transport incident victims were commonly the drivers of four wheel drive vehicles and were alone in the car, whilst attempting to reach their own home or a friend's.
Discussion: Flood related river drownings are preventable. Strategies for prevention must target causal factors such as being alone, influence of alcohol, type/size of vehicle, and intended destination. Strategies to be explored and evaluated include effective signage, early warning systems, alternate routes and public awareness for drivers.
]]>Introduction
Floods are the most common of all natural disasters, and the leading cause of natural disaster deaths worldwide 1.The World Health Organization (WHO) estimates that globally, between 1980 and 2009, floods have claimed the lives of over 500,000 people 2. Drowning is the leading cause of death during flood events 3, accounting for two-thirds of all deaths, followed by trauma 4.
Drowning risk changes during floods due to characteristics 5 such as: water depth, flow velocities and the rate of rising waters 6,7; roadways being covered or cut off by water and debris 8; and an increased amount of water in storm water drains and irrigation channels 9,10. There is a need for prevention strategies to minimise risk of drowning during times of flood. Strategies proposed include: engineering measures to restrict access to floodwaters, particularly by motorists 11 and the use of public awareness and education measures 11; as well as predictive modelling and early warning and evacuation procedures 5.
Australia has experienced significant flood events. One of the most devastating recent events was the Queensland floods of 2010/11 which affected 78% of the state and resulted in the deaths of 33 people, 21 in one flash flood event 12. In Australia, rivers are the leading location for drowning 13 and slow onset floods from inland rivers are the most common, however most deaths occur due to flash flooding, often as a result of thunderstorms 14.
Rivers, with their variable environments 7 and significant contribution to the fatal drowning toll 13, require attention in order to develop effective prevention strategies. Unlike coastal waters, specifically rip currents 15,16,17, which have benefited from much research, flood related deaths (16.8% of all unintentional drowning deaths in rivers) have not benefited from such focus.
Population based research examining risk factors has been identified as a gap in the published literature for river drowning 18. With the likelihood of floods increasing 1,19 there is a need to examine the epidemiology of river flood related drowning deaths in Australia. This paper represents the first total population cross-sectional study of all unintentional fatal river flood related drowning in Australia using coronial data.
Aims
This study aims to: Describe the incidence of unintentional fatal drowning during periods of river flooding in Australia between 1 July 2002 and 30 June 2012; discuss risk factors associated with river flood related drowning; and propose potential strategies for prevention.
Methods
Ethical approval for this study was provided by the Victorian Department of Justice and Regulation (Department of Justice and Regulation Human Research Ethics Committee – CF/15/13552) and James Cook University (James Cook University Human Research Ethics Committee – H6282). Informed consent has not been obtained as the human subjects involved in this research are deceased.
Unintentional fatal drowning in Australia is considered a ‘reportable death’ and cases of this nature are captured in the Australian National Coronial Information System (NCIS), an internet based data storage and retrieval system for Australian coronial cases. All cases of unintentional fatal river drowning between 1 July 2002 and 30 June 2012 were extracted from the NCIS and collated in a database. This includes populating a range of variables for each victim including sex, age, geographic location of drowning incident, residential location of drowning victim, activity being undertaken prior to drowning, involvement of alcohol and/or drugs, the presence of pre-existing medical conditions and ethnicity of the drowning victim. Cases in the NCIS remain open (i.e. under investigation) until a cause of death has been ruled by the coroner. At time of analysis, 93.4% of cases were closed (i.e. no longer under coronial investigation). For the open cases, data is correct as at 16 July 2016.
All cases within this study are either cases where the primary cause of death (Level 1a) was drowning or where drowning was a contributory cause of death (Level 1b to Level 3). Where an initial non-fatal drowning occurred and the victim subsequently died in hospital from the related effects of the immersion, these cases were included (no such victims in the flood-related cohort). Cases relate to unintentional drowning deaths that occurred in Australian rivers, creeks and streams only. Rivers, creeks and streams were defined as “A natural waterway that may be fed from other rivers or bodies of water draining water away from a ‘catchment area’ to another location…” and “can vary in water flow, length, width and depth…” 13.
Flooding for the purposes of this study was defined as comprising slow onset floods from inland rivers 7 and rapid on-set flash floods as a result of intense rainfall associated with thunderstorms 14. The involvement of flooding was determined through information presented in the cause of death text field or narratives of the police report and/or coronial report (if available). Where available, cases coded to ICD-10 were also identified as being flood related if the external cause code X37.8 (other cataclysmic storms) and X38 (flood, sequela) was provided in the external data tab within the NCIS 20. Data on the ICD10 code for deaths are identified by matching cases within the NCIS to the de-identified data provided through the Australian Bureau of Statistics (ABS) Causes of Death release 21. Cases were identified as being flood-related with a ‘yes’ in the corresponding variable.
Drowning victims were coded into two groups (children or adults) based on their age. Children were defined as those aged 0-17 years and adults were defined as being aged 18 years and over. In Australia, 18 years is the age a child reaches adulthood for the purposes of the criminal law 22.
The remoteness classification of incident postcode was coded according to the Australian Standard Geographical Classification (ASGC) 23. Postcodes are coded into one of five remoteness classifications based on a number of factors including distance from essential services 24.
Visitor status was calculated by determining the distance, in kilometres, between the residential and incident postcodes using Google Maps 25. A distance of 100km or less was classified as ‘Not A Visitor’; those who resided within the same State or Territory with a distance greater than 100km, were classified as an ‘Intrastate Visitor’; those who drowned in a different State or Territory and were greater than 100km from where they resided were classified as ‘Interstate Visitors’; and those with a residential postcode in the NCIS of 7777 (i.e. live overseas) were classified as ‘Overseas Tourists’.
Time of day of drowning incident was coded into four groupings for analysis: morning (6:01am to 12pm), afternoon (12:01pm to 6pm), evening (6:01pm to 12am) and early morning (12:01am to 6am). For the time of incident variable, where time could not be determined a coding of 9999 (Unknown) was used.
Crude drowning rates per 100,000 population were calculated using population demographic data cubes from the Australian Bureau of Statistics (ABS) for the period June 2003 to June 2012 26,27 and excluded international tourists. Drowning rates for people of Aboriginal or Torres Strait Islander descent were calculated using population estimates for 2002-2011 from the ABS 28. Rates for country of birth and remoteness classification of incident location were calculated using a three yearly average from population data available from the three Australian population Census years 2001 29, 2006 30 and 2011 31 and averaged to determine population and yearly drowning rate.
Due to difficulties around interpreting blood alcohol content (BAC) for drowning victims 32, alcohol involvement was deemed where a BAC was available (either in the autopsy or toxicology report) and was ≥0.05% (that is 0.05 grams of alcohol in every 100 millilitres of blood). Cases where alcohol was known to be consumed but no BAC was available were deemed Unknown for alcohol involvement.
Data coding and analysis was conducted in SPSS V20 33. Descriptive statistics were utilised, as well as chi squared analysis. A modified Bonferroni test suggested by Keppel 34 has been applied and statistical significance is deemed p<0.03. Relative risk (RR) was calculated, along with a 95% Confidence Interval (CI). Relative risk and chi squared analyses were conducted without the ‘unknown’ variable as it was assumed that this information was missing and no systematic bias was likely – e.g. presence of alcohol was calculated using the ‘yes’ and ‘no’ variables only. Where variable analysis presents cases of four or less, the term NP (not presented) has been used in the tables. Non-parametric chi squared analysis was also conducted using the proportional basis of the population as the assumed outcome numbers.
Causal factor analysis was conducted for river flood related drowning deaths as a result of the top three activities (falls, non-aquatic transport incidents, swept away; 83.7%). The narrative of the incident was analysed from the coronial finding. If the finding was unavailable, the police report narrative was used. If this was not available the autopsy report was used. The following new variables were added and coded from available data: For all cases – type of flood (flash or slow onset), if the victim was alone or with company and if the victim entered floodwaters intentionally or unintentionally. For drowning deaths due to falls into flooded rivers – what the victim fell from. For drownings as a result of being swept away by river floods – what the victim was swept from. For drowning deaths as a result of non-aquatic transport incidents involving river floods – if the victim was a driver or passenger, if the road was open or closed at the time of the incident, the victim’s intended destination and the type of vehicle the victim was in when they drowned. The data was then visually depicted using flow charts developed with the assistance of a graphic designer. Initial coding was conducted by AEP, and then reviewed by RCF with cross-checking to ensure consistency by PAL.
Rates of non-aquatic transport flood related drowning per 100,000 registered vehicles were calculated using Australian vehicle registration data. Using the ABS Motor Vehicle Census 35, a 10 year average of registrations by vehicle type was calculated using data from 1-March-2003 to 1-March-2012 inclusive. Rates were calculated for passenger vehicles (car, four wheel drives (4WD)), light commercial vehicles (utilities), rigid trucks (heavy vehicles, machinery) and motorcycles (motorbikes, All Terrain Vehicles (ATVs)).
Results
Between 1 July 2002 and 30 June 2012, there were 770 drowning deaths in rivers, of which 129 (16.8%) were river flood related (Table 1). This represents a 10 year average drowning rate of 0.06 per 100,000 people per year (Figure 1). The number of deaths vary from a low of five deaths in 2002/03 to a high of 45 deaths in 2010/11, of which 21 (46.7%) occurred in a single flash flooding incident in the state of Queensland.
Table 1: River drowning deaths and flood related drowning deaths by sex, age group, people of Aboriginal or Torres Strait Islander descent, visitor status, activity immediately prior to drowning, remoteness classification of incident location, presence of alcohol (≥0.05mg/L) and time of day of drowning incident, Chi Squared (p value), Australia, 2002/03 to 2011/12 (N=770)
Fig. 1: Unintentional fatal drowning in rivers by flood status and financial year, number and crude rate per 100,000 population, Australia, 2002/03 to 2011/12 (N=770)
Slow onset flooding was involved in half (55.8%) of all river flood drowning deaths, 27.1% were as a result of flash flooding and type of flood was unknown in the remaining 22 cases. Males were significantly more likely to drown in river floods than females (χ2= 9.9; p=0.002), accounting for almost two thirds (63.6%) of all drownings during river flooding (Table 2). Although a larger number of adults (n=99) drowned compared to children (n=30), children were significantly more likely to drown as a result of flooding (χ2= 7.6; p=0.006). (Table 1) The 55-64 years age group recorded the largest number of river flood related drowning victims (n=20), however those aged 75+ years were 2.24 (CI: 0.13-38.24) times more likely to drown when compared to those aged 0-4 years. (Table 2)
Table 2: Flood related drowning deaths average per annum and percentage, annual population and crude rate of drowning per annum by sex, age group, people of Aboriginal or Torres Strait Islander descent, state or territory of drowning death, country of birth and remoteness classification of incident location, relative risk (RR) and 95% confidence interval (CI), Chi Squared (p value), Australia, 2002/03 to 2011/12 (n=129).
People of Aboriginal or Torres Strait Islander descent were 5.25 times more likely to drown in floods than non-Indigenous flood victims (χ2 =37.3; p<0.001). (Table 2). The state of New South Wales recorded the highest number of river flood related drowning deaths (n=29) however those who drowned in the Northern Territory and Queensland were 13.16 (p<0.001; CI: 1.57-110.47) times and 3.96 (p<0.001; CI: 1.00-15.60) times more likely to drown in flooded rivers compared to non-flooded rivers. (Table 2)
People born in Australia, were 2.60 (χ2 =10.5; p=0.001) times more likely to drown during river flooding, compared to those born outside of Australia. (Table 2) The majority of victims were not visitors to the drowning location (81.4%). Visitor status of the victim was not found to increase drowning risk. There were no flood related drowning deaths among international tourists to Australia during the study period. (Table 1) There was an increased risk for those who drown in remote areas, with people in remote areas being 79.59 (p<0.001; CI: 6.91-917.33) times and those in very remote areas being 229.05 (p<0.001; CI: 23.82-2202.06) times more likely to drown during times of river flooding than those who drown in major cities. (Table 2)
River flood related drowning deaths most commonly occurred in the summer months (December to February) (55.8%) (χ2= 20.4; p<0.001). Almost half of all flood related drowning deaths occurred in the afternoon (40.3%), with a further fifth (20.9%) occurring in the evening, however time of day was not found to be statistically significant. (Table 1) Alcohol (i.e. a BAC ≥0.05%) was known to be present in a fifth (20.2%) of river flood related drowning deaths, however the involvement of alcohol was not found to be statistically significant (Table 1). Males accounted for 76.9% of cases where alcohol was known to be present.
Non-aquatic transport incidents were the leading activity immediately prior to drowning, accounting for over half (55.0%) of all flood related drowning deaths (χ2= 110.0; p<0.001), followed by being swept away by floodwaters 17.1% (χ2= 73.3; p<0.001). The third leading activity prior to drowning was a fall into water (11.6%), however a fall was found to be significantly less likely to occur during times of flood when compared to drowning deaths in rivers not in flood (χ2= 16.5; p<0.001). (Table 1) Males outnumbered females in all categories of activity immediately prior to drowning with the exception of the category of Swept Away (54.5% female), however sex was not found to be statistically significant by activity prior to drowning.
River flood related deaths as a result of non-aquatic transport incidents were more likely in winter (χ2= 35.8; p<0.001) and more likely to occur on a Friday when compared to drowning as a result of other activities. For flood related drowning deaths in rivers, Monday was the most common day (24.0%) (χ2= 9.1; p=0.002); however these were less likely to be related to non-aquatic transport incidents when compared to Friday (26.8% of all flood related non-aquatic transport incidents).The largest proportion of flood-related non-aquatic transport drowning deaths occurred in afternoon (38.0%), however time of day was not found to be statistically significant. Alcohol was known to be present in just over a fifth (21.1%) of all flood related non-aquatic transport incidents, however alcohol was not found to be statistically significant.
Causal factors
There were three main activities prior to drowning in floods, those who fell into water, those who were swept away and those who drowned as a result of non-aquatic transport incidents. Deaths as a result of these activities represented 83.7% of all river flood related drowning deaths.
Falls into water
There were 15 drowning deaths as a result of falls into water, 60.0% of which were adults, 73.3% were alone, 27.3% were children and alcohol was known to be involved in 26.7% (100.0% of which were adults). Common scenarios were children who either fell into floodwaters from the creek/river bank (33.3%) or whilst wading in the water (50.0%). Interestingly, two children were alone when they drowned, whilst another two were with company, however supervision had lapsed. For adults, common scenarios were being alone (72.7%) and falling from the creek/river bank (36.4%), two cases of which involved alcohol (Figure 2).
Fig. 2: Flood related drowning deaths as a result of falls into water (n=15).
Swept away
Being swept away by floodwaters accounted for 22 drowning deaths between 2002/03 and 2011/12, of which 18 deaths (81.8%) were from one incident (the 2010/11 Queensland floods). In 72.7% of cases the person was unexpectedly swamped by water, commonly in their home (87.5%) and in all cases (100.0%) there was no prior warning of the inundation. For those who intentionally entered floodwaters (27.3%), all (100.0%) entered on foot, with 66.7% of these being swept away by floodwaters whilst crossing a flooded bridge, all of which occurred during periods of slow-onset flooding (100.0%) whilst the victims were trying to get home (100.0%) (Figure 3).
Fig. 3: Flood related drowning deaths as a result of being swept away (n=22).
Non-aquatic transport incidents
There were 71 drowning deaths due to non-aquatic transport incidents, the most common activity being undertaken prior to drowning in river floods. In almost two thirds (60.0%) of cases those who drowned were the drivers and were alone in the car when they drove into floodwaters. Drivers were most commonly in 4WD vehicles and attempting to reach their home or a friend’s home (60.0%). (Figure 4)
Almost two thirds (60.6%) occurred on roads that were known to be open at the time of the incident. Drivers were alone in the vehicle in 58.3% of road open cases, the remaining 41.7% of drivers drove through floodwaters with passengers in the vehicle. Almost a third (30.2%) of non-aquatic transport victims on open roads were intending to travel to their own home or a friend’s home, most commonly in cars (38.5%), utilities (30.8%) and 4WDs (23.1%). Just over a fifth (25.6%) of those who drowned on open roads were intending to travel to work/appointments. All victims driving heavy vehicles or machinery were undertaking paid employment at the time of their drowning. All incidents (100.0%) involving motorbikes/ATVs occurred when the victim was riding for recreation (Figure 4).
Fig. 4: Flood related drowning deaths as a result of non-aquatic transport incidents (n=71).
Discussion
River flood related unintentional fatal drownings are a regular occurrence in many countries around the world 5,1,36. This study, the first to analyse Australian river flooding deaths using coronial data, found those at an increased risk include: males, children and those residing in states prone to tropical rainfall patterns (Northern Territory and Queensland); and those involved in non-aquatic transport incidents or those swept away. Risk factor identification has been shown to be an important tool for developing successful prevention strategies 11,37,3836.
Understanding causal pathways to inform prevention
This study uses causal pathway analysis to understand common scenarios leading to drowning and depicts these as flow charts. Similar work has been undertaken to understand causal pathways leading to drowning of young children in home swimming pools 39 and among divers 40.
While not the first to use flow charts to depict flood related drowning deaths, this study expands on Fitzgerald’s 41 work using a flow chart to depict circumstances of flood victims before death. Our study differs in that it uses coronial data (rather than newspaper reports or historical accounts) to examine causal factors for the three leading activities prior to drowning. Fitzgerald’s study found almost half (43.8%) of flood fatalities in Australia between 1997-2008 were vehicle related, with crossing a waterway the leading contributor, a finding that is mirrored in this study. Our research reported similar proportions of watercraft related flood drowning (4.4% in Fitzgerald, 4.1% in this study), but a higher proportion of victims being trapped and subsequently swept away by floodwaters (17.1%) with most being trapped in their home (63.6%). Fitzgerald reported zero flood fatalities of this type, with our study reflecting the 2011 mass casualty event in the State of Queensland 42.
Causal factor analysis provides important information about the chain of events leading to river flood related drowning to inform prevention. The development and implementation of prevention strategies must also consider work beyond epidemiological studies, such as behavioural psychology, to determine motivations underpinning behaviour, such as the decision to drive through floodwaters 43.
Challenges around definitions of flooding
A key challenge when conducting analysis of river flood related drowning deaths is the lack of a consistent definition. This has previously been identified as a limitation in the published literature around defining and isolating river drowning statistics 18. This study has classified river floods as slow onset or flash flooding; and while attempts have been made to define different types of flooding in the past 5,44, a lack of consistency in terminology and classifications has made the comparison of different studies difficult. This limits the ability to examine how risk differs between types of floods across a range of studies. A consistent set of definitions allows flood type and flood characteristics to be routinely collected at the time of death investigation (primarily by police). This information may then allow for opportunities to predict the severity 5 of flood events to develop and implement evidence based strategies for prevention.
Consistent terms that are then communicated to, and well understood by, those at increased risk, may increase the effectiveness of prevention strategies. Clearly communicated prevention strategies may increase recall and impact on behaviour 45,46 and therefore the likelihood that such activities will be effective in their aim of reducing flood related drowning.
Falls into water
A fall into water, although statistically more common when rivers are not in flood, was the third leading category of activity prior to drowning in river floods. Causal factor analysis raises questions regarding the protective nature of supervision, with a third of all children drowning due to falls into flooded rivers whilst with company. In order to be effective, supervision must be focused, continuous and proximate 47. Drowning prevention strategies aimed at parents and carers of young children must highlight the key elements of effective supervision, including around floodwaters. Floodwater risks to children must be communicated prior to the traditional risk taking teenage years with the average age of child victims being 8.2 years.
Almost half (44.4%) of all adults who fell into flooded rivers were known to have consumed alcohol prior to drowning. With the contributory role of alcohol having been identified in river drowning deaths in Australia 48, this study highlights the need to ensure flooding is considered in any strategies developed to address alcohol related river drowning deaths.
Swept away
While being swept away was a significant cause of death, 21 people (17.1% of all river flood related drowning deaths) in this study drowned in a single flood event in the state of Queensland in 2011 12. Victims from this event accounted for 81.8% of all deaths as a result of being swept away. Events such as these are worthy of further examination with extreme weather predicted to increase the likelihood of such events in the future 38. It is therefore vital that prevention efforts focus on those most at risk during such events.
Half (50.0%) of those who drowned as a result of being swept away were aged 55 years and over, identifying the vulnerability of older people. Almost all (90.9%) of those aged 55 years and over who were swept away by floodwaters, were swept from their house when it was inundated as a result of flash flooding. The 2011 Queensland floods occurred during the day, when older victims, more likely to be retired from the workforce, were home. This event highlights the impact of age related reductions in mobility and chronic conditions on drowning risk during floods 49. To reduce the risk, including for older people, the implementation and evaluation of prevention strategies such as predictive modelling, early evacuation, the relocation of flood prone communities and improved urban planning to avoid building on floodplains should be considered 12,50,51.
Non-aquatic transport related fatal drownings
Similar to previous studies on drowning deaths in flooded rivers, non-aquatic transport incidents were the most common activities being undertaken prior to drowning 41,52,53,6. Males are consistently at an increased risk, postulated to be due to greater confidence to drive into floodwaters 54. For prevention targeting males with effective education and awareness raising messages will be critical. As over half of all females who drowned as a result of non-aquatic transport incidents were passengers in the vehicle education strategies highlighting risk to life for both driver and passengers may be more effective 43.
While trucks and motorcycles accounted for a small proportion of vehicles driven through floodwaters (13.8%) in this study, rates per 100,000 registrations per annum 35 were 4.33 and 3.67 times that of cars (0.13 / 100,000 and 0.11 / 100,000 respectively). This is partially explained by Coles (2008) research where occupants of bigger vehicles are more likely to try to travel across floodwaters 55. Although registration data is only a proxy for exposure, this highlights the need for education and prevention efforts to be targeted at drivers of such vehicles. Future research should focus on exposure studies 18 to identify those at an increased risk of drowning due to river floods.
Preventing drowning in floodwaters is a challenge and ultimately the most effective strategy is to prevent drivers from crossing flooded roads. In this study only 7% of all deaths were from people traveling on closed roads, as such timely road closures may save lives. Road closures which are automatically based on real time flood water data and are physical in nature (e.g. barriers) 11 are likely to be effective. Providing information about alternative routes and information prior to reaching the flood water to allow for a change of route may also help. Enforcement of closed roads is also important as this helps to reinforce the signage as a means of providing information and may enhance effectiveness.
Prevention may also encompass better urban design, including building infrastructure and bridges to enable safe travel across flood-prone locations. Further research is required to determine effectiveness, and implications for disobeying road closure signage and barriers must be considered. Further work is required to explore other prevention strategies such as enforcing the culpability of those who deliberately drive through floodwaters and put others at risk and the use of regulations to hold driver’s liable for costs incurred during their rescue from floodwaters.
Prevention
This study has identified a number of risk factors where prevention strategies should be targeted. These include targeting males, those who drive through flooded rivers (particularly truck drivers and motorcycle riders) and those residing in the northern areas of Australia prone to tropical rainfall.
Unlike drowning deaths at coastal locations that commonly involve international tourists 56, all victims who drowned in river floods were Australian residents, the majority of which (83.3%) drowned within 100kms of their residential postcode. It could be postulated that these people were in areas where they are more likely to have “local knowledge” about normal conditions 57, or in the case of non-aquatic transport incidents, on roads they had driven on many times in the past. This mirrors research conducted by Hamilton et al into the key beliefs underpinning people’s decisions to drive through floodwaters, which found that people regularly ignore road closed and flood warning signs if they had previous experience of driving on roads that regularly flooded 58,11. Further qualitative studies that focus on people who reside in flood-prone areas and who have driven through floodwaters may assist in the development of effective prevention strategies for this group that account for the majority of river flood-related drowning victims.
Those who drowned in the Northern Territory and Queensland were at a significantly increased risk for river flood-related drowning, which is related to their tropical climate and wet season. Prevention strategies must consider rainfall patterns and climate differences in order to be better tailored, and therefore relevant, for those at an increased risk. This is evidenced by permanent signage, used in parts of northern Queensland, which shows open and closed roads 50 to 100kms ahead to allow motorists to make decisions about which route to take. This signage is particularly important during the wet season, however the effectiveness of this method has yet to be evaluated.
There is limited evidence regarding the effectiveness of prevention strategies for those who drive through floodwaters. Key prevention strategies currently utilised are low order strategies 59,60, such as signage (road closed and depth markers) and barriers. This study also shows signage appears to be ineffective, with 63.6% of non-aquatic transport incidents in remote and very remote areas known to have occurred on roads that were open at the time of the drowning incident. Signage and detour routes are reactive strategies and hard to enact if authorities do not know if there is water on the road in such isolated locations 61. Further work is needed to explore how to make signage more effective.
In Australia, the use of the “If it’s flooded, forget it” slogan, to discourage people from deliberately entering floodwaters, be it in a car, on foot or for swimming, has been recommended 12. However this campaign has yet to be evaluated. The motivational factors behind people’s decisions to drive through floodwaters must be considered when developing prevention strategies.
There are many challenges associated with effective prevention of river flood drowning deaths. One such challenge is these deaths are reasonably rare in any given location as they are geographically dispersed across the country. Slow onset flooding moves long distances and can affect river systems hundreds and thousands of kilometres from where rainfall occurred, potentially leading those in flood-prone locations to underestimate risk to self and others 62. Gathering evidence that particular stratagems are effective is an ongoing challenge.
Limitations
There may be limitations associated with this study. Firstly, not all flood related drowning deaths may have been identified. Relying on ICD codes has been found to under report drowning deaths as a result of flooding 18 and boating accidents 63. Just over one fifth (20.3%) of cases in this study recorded an unknown for the involvement of flooding. Where the case remained open (i.e. under investigation within the coronial system) there is limited information available on the circumstances of the drowning. A case that is open will also not be coded to ICD 10 coding. With 6.9% of drowning cases open within the coronial system, this paper may under report the number of drowning deaths as a result of flooding in Australia during this period.
As this study uses data for cases where a coroner must investigate, there is a period of time where there is limited information about the case. Until the case is officially closed by the coroner (i.e. no longer under investigation and a cause of death has been determined) there is minimal data available about the circumstances surrounding the drowning death. The period under analysis has been chosen to minimise incomplete data, however 6.9% of river drowning cases remain open (i.e. under investigation) within the coronial system.
Calculations for crude fatal drowning rates by population of remoteness classifications uses an average from three years 2001, 2006 and 2011 (Population census years in Australia) for population and drowning data from 2002/03 to 2011/12. This may produce rates that are not as accurate as if population data was available for each year of drowning data. These rates were calculated using the yes variable only and therefore some of the unknown cases may be flood related and this may underestimate the rate.
Alcohol involvement was unknown in 27.9% of river flood related drowning deaths. This study may therefore underestimate the involvement of alcohol in incidents of fatal drowning during river flooding. The difficulty with retrieving bodies during times of flood may also artificially inflate BAC readings due to rapid decomposition in water 64.
The chi squared analysis in Table 1 was calculated using the yes and no variables for flooding only. The authors are therefore making the assumption that the unknowns would be evenly distributed between the known categories. Relative risk was calculated on only the yes variable for flooding and as such may be impacted by the unknown cases.
The relative risk calculations based on remoteness of drowning location use census population data by remoteness classification for a victim’s residential location. It is possible that a victim may have drowned in one remoteness classification but resides (and is therefore counted in population data) in a different remoteness classification. This may therefore have an impact on the accuracy of the relative risk calculations.
Conclusion
Although periods of drought and flood may well be inevitable in many countries, including Australia, fatal drowning does not have to be a by-product of such weather events. Prevention strategies are vital to reducing the needless loss of life during flood disasters. This study identifies key risk factors that must be considered when developing prevention strategies such as communicating the risk of floodwaters to children prior to the teenage years, highlighting the dangers of driving through floodwaters, the need to target people in rural and remote areas with prevention messages, drivers of trucks and motorcycles and those in tropical areas prone to periods of seasonal increased rainfall.
By implementing and evaluating a range of prevention strategies based on evidence, it is hoped that the number of drowning deaths occurring in Australia due to flooding, can be minimised, and ultimately prevented.
Corresponding Author
Amy Peden ([email protected]; [email protected])
Competing Interests
The authors have declared that no competing interests exist.
Data Availability Statement
With respect to the minimum dataset underlying this research, this data is available on request however as the data is via a third party (coronial data), ethical approval and permission from the data custodians, the Australian National Coronial Information System (NCIS) is required before the authors are able to provide their dataset to the person inquiring. There are strict ethical restrictions around use of this data and it can therefore not be sent to a public repository. Once ethical approval and permission from the NCIS as data custodians has been achieved, researchers can contact [email protected] to gain access to the data.
Methods: We apply a GIS based method in order to identify sites that could be utilized for vertical evacuation within the existing building stock of the city, under two tsunami scenarios of 5 and 10 meters of run-up. For each building, we estimate the volume that is expected to be lost per scenario, as well as the number of people inside and how that number fluctuates over different times of the day.
Results: Using the criteria of 25% or less building volume loss and 6 cubic meters of volume per person, resulted in 2,046 potential sites for the 10 meter scenario and 1,643 potential sites for the 5 meter scenario, with the maximum amount of people that can potentially be accepted in these sites in the morning hours being 873,537 in the 10 meter scenario and 304,734 in the 5 meter scenario.
Discussion: Our approach has shown that there is a temporal aspect in tsunami vertical evacuation due to the movement of the local population throughout the day. the proposed method can be used for preliminary identification of potential vertical evacuation sites, however, it must be followed by further vulnerability and engineering assessments of buildings, in combination with accessibility and evacuation routing in order to reach a viable and complete evacuation plan.
]]>1. Introduction
Vertical evacuation is becoming increasingly considered in tsunami preparedness, after the impact of the 2004 Indian Ocean and the 2011 Tohoku tsunamis. Extensive publications from organisations such as FEMA and the Joint Research Centre (JRC) of the EU1,2, describe the concept of vertical evacuation and the characteristics of vertical evacuation sites. According to FEMA1, a vertical evacuation site is any building or high ground that can withstand an incoming tsunami and can accept incoming individuals who seek safety. Shibayama et al.,3 provide a similar description of what evacuation areas should be in Japan, classifying them into three categories of open high ground areas, buildings with more than 7 floors and buildings between 4 and 6 floors.
Despite these extensive guidelines, case studies concerning vertical evacuation have been somewhat limited. In contrast, research concerning tsunami evacuation in general, such as behavioural analyses (eg 5), evacuation simulation studies (eg 4), and research concerning the performance of structures during the Tohoku tsunami (e.g 6,7,8) have been extensive. When it comes to vertical evacuation studies have given insight on some of its aspects. For example, Park et al. 9 , provide a mathematical model of determining optimal locations for vertical evacuation sites in coastal areas with heavy focus on their spatial distribution. Raskin et al,10 performed an evaluation of buildings that could serve as evacuation sites, based on their engineering attributes, focusing mostly on public buildings such as government offices.
While the contribution of the above research is significant, there are still many aspects of vertical evacuation that have not been yet covered. One attribute, and perhaps among the most important ones, is the population that is affected in a potential tsunami flood-zone. To the best of hour knowledge, only Wood et al.11, have provided a spatial analysis of tsunami vertical evacuation shelters that includes local population as a basic attribute of the approach, and under the scope of a vertical evacuation plan. However, given the recent rise of “big data”, population can now be approached not only as a static attribute, but spatiotemporally and on the microscale, in locations where such data is available.
We propose an approach that utilises and combines building inundation and temporal building population estimation, in order to identify existing urban structures as potential vertical evacuation sites. The objectives of our study and our used approaches are:
2. Study area selection and overview
To reach the objectives of this study, we sought to approach an area that is currently in high risk for tsunamis. The Nankai trough, is a subduction zone where the northern part of the Philippine plate subdues beneath southwest Japan resulting in high magnitude earthquakes 12. The trough has been extensively studied as per its seismicity and tsunami events. In historic times, earthquakes with magnitude of 8.0 or higher and a 120 year occurrence interval ,have happened in the area, with the most recent ones being the M 8.0 Tonankai earthquake of 1944 and the M 8.1 Nankaido earthquake of 1946 13. Tsunami deposits found along the extensive coastline facing the Nankai trough also attest to a tsunami occurrence interval every 100 to 200 years for the last 3000 years 14. The recorded activity of the trough implies further activity with an upcoming earthquake in the near future 15.
In this setting, we aimed to select a city which belongs in one of the 8 prefectures of Japan that directly face the Nankai Trough. Our choice became the city of Shizuoka, Shizuoka prefecture for two main reasons: (a) The city plays a very important role in Japanese geography. Not only it is the capital of the prefecture hosting a range of administrative functions, but it also is a central transportation node connecting north and south Japan. (b) It has excellent data availability compatible with the research objectives of this study. The most attractive data set is the people flow database which describes the population movement of the city over the course of 24 hours of the day.
The city of Shizuoka (Figure 1) directly faces the Nankai trough being in a vulnerable to an upcoming tsunami location. It is the second largest city in the prefecture with a population of 704,340 people 16. While the city boundaries greatly extent into the mountain ranges situated in the northern parts of the prefecture, these areas are uninhabited in their majority, and the populated built-up part of the city is mostly situated along the coastline. Three main highways and a two major train lines intersect the built up area of the city from the southwest to the northeast, dividing the city in two. The Central Business District (CBD) of Shizuoka is located to the northern part further away from the coastline, and a satellite business district is situated in the eastern area of Shimizu in very close proximity to the sea.

Fig. 1: Location of the city of Shizuoka, its three wards and its Central Business District (CBD)
3.Tsunami scenarios and building inundation ratios
3.1 Scenario Selection
Despite the numerous studies that illustrate the seismic and tsunami presence along the Nankai Trough, clear descriptions of the characteristics of past remains remain limited. Sugimoto et al. 17 describe that the 1707 Hoei Earthquake, which originated in the Nankai Trough, was estimated to have had a magnitude of 8.4, while Imai et al. 18 suggest that the tsunami that followed the earthquake reached a maximum run-up of 5 meters.
Beyond that, characteristics of potential tsunamis from earthquakes of such magnitudes have to be inferred indirectly. For example, most tsunami magnitude scales (e.g. 19) suggest that tsunamis from magnitudes in the range of 8 should be expected to have a maximum run-up of 10m. Under these circumstances, it becomes clear that any method of identifying potential vertical evacuation sites should offer flexibility and adaptability to different scenarios originating from different sources.
We used two tsunami scenarios in our approach, the 5m run-up one as described by Imai et al. 18, as well as what the tsunami magnitude scales suggest, a 10m run-up scenario. Using GIS, we were able to visualise both scenarios using a Digital Elevation Model for the city of Shizuoka with a resolution of 5m, as it was provided by the Geospatial Authority of Japan (GSI). Subtracting the elevations from the maximum run-up resulted in water depth maps as can be seen in Figures 2 and 3.
The 5m scenario affects only small areas of the coastline of the city, with most of the flooding occurring in the area of Shimizu to the North. However, the 10m scenario shows greater capacity for flooding, as not only it affects the majority of the city’s coastline, but also, it follows the river system in Shimizu uphill, achieving greater inland penetration.

Fig. 2: 10 meter run-up tsunami scenario for the city of Shizuoka

Fig. 3: 5 meter run-up tsunami scenario for the city of Shizuoka
3.2 Inundation ratio estimation
Continuing with our GIS approach, we utilised a process of estimating the extent that buildings become inundated under a tsunami. The Inundation Ratio estimation is a widely used approach, usually in studies that investigate the vulnerability of buildings to tsunamis (e.g.20,21). As building heights are necessary for this estimation, we had to obtain a dataset that contains such information for the full building stock of the city. The best choice that offered coverage for the full extent of Shizuoka was the Zenrin Zmap Town II dataset which contains floor number information for each individual building. We had to assume that each floor was 3 meters in height, and as such, we indirectly obtained the necessary building heights. The dataset also contained the information of each building’s footprint geometry, which in combination with the height, allowed us to finally have an estimate of each building’s volume.
As a final step, the building volume and the water depth at the location of each building were used to estimate the percentage of the building’s volume that becomes flooded under both the 5m and the 10m scenarios as follows:
Where VA is the available volume after the tsunami, VB is the volume of the building, EX is the exposure, or water depth at the location of the building and H is the building height.
The results of this estimation can be seen in Figures 4 and 5, where the individual building volume loss to the tsunami is mapped. This process gave two important products for our study. First, the volume that is available in buildings after the tsunami could be utilised by people for evacuation within the flood zone. Moreover, there is a distribution of buildings with such available volumes across the full extent of both the 5m and 10m scenario flood zones.

Fig. 4: 10 m run-up scenario building volume loss

Fig. 5: 5 m run-up scenario building volume loss
4. Temporal building population estimation
4.1 Background and Method Selection
For decades now it has been identified that regardless of the detail of a population census, what is often reflected by its statistics is known as nighttime population (e.g.22), meaning that spatially, the census shows where the people will most likely be situated at night when asleep at their homes. However, in reality, the population of a populated area is mobile during the course of a day, and can be distributed in numerous locations at the time when a tsunami occurs. When it comes to the Japanese census, the Statistical Agency of Japan, provides extensive datasets that despite their detail still cannot reflect the mobility of the population. Moreover, even when considering the nighttime population itself, the spatial distribution of the population cannot go lower than 500 m, due to respect of the privacy of Japanese citizens.
The second variable to our potential vertical evacuation site identification would be the number of occupants inside a building and by extension how much volume they occupy. As such, the information provided by the census was somewhat limited and additional estimations were necessary in order to not only achieve a spatial resolution of building level, but also, the temporal distribution due to the mobility of the population. Lwin and Murayama 23 had previously introduced a method of estimating the population of buildings in an area, based on census grids and the volume of buildings. The authors themselves promote this method for its usefulness in natural disaster studies and we previously have been successful in incorporating its results in tsunami vulnerability assessments 24. While this method provides the required spatial distribution, it still lacks the necessary temporal dimension.
Greger 29, used Lwin and Murayama’s method as a base and proposed a spatiotemporal building population estimation method. The way he achieved that was by introducing additional datasets to the process that were available for his study area in Tokyo. The first dataset is the spatial distribution of the workforce, in 50 m resolution as it is described by the census. The second, was a point address dataset that allowed him to determine the use of each building, and the third was the PersonFlow data for Tokyo, as provided by the Center of Spatial Information Science University of Tokyo 25. By using the results described in Axhausen et al.26, Bowman and Ben-Akiva 27 and Jiang et al.,28 he defined six activity types and matching building usages. By combining the movement of people, the census, and the building categories, he was able to estimate the population of people in buildings and how it varies over 24h of a day, using the following equation:
Where BPi,c,t is the building population of building i in category c at time t, APAi,c,t is the total population of category c at time t of the census tract that contains building i, A is the set of all census tracts, BAi is the footprint area of building i, BAi,c is the footprint area of building i in category c, and BFi is the number of floors of building i 29.
Greger’s method has great compatibility with the datasets available for Shizuoka, which led to its selection for our temporal building population estimation process. While the data available for Shizuoka were similar to the ones Greger utilised for Tokyo, there were some differences that led to small adjustments to the application of the method.
4.2 Method application
Figure 6 presents the datasets that we utilised for the 24 h building population in the city of Shizuoka. All of these except one were consistent with the data demands of Greger’s method. The dataset that was inconsistent was the point address dataset of February 2014 that we used could not match the six categories of activities that Greger suggested for Tokyo. The only possible distinction was whether each building was a residence or not. Because of this limitation we had to adjust buildings into two categories, residences and workplaces. Moreover, the movement of the population during the course of a day had to be grouped into two movement types to match the building categories as follows : to home and to work (Figure 7).

Fig. 6: Datasets that were used for the purposes of this study

Fig. 7: People flow movement over the course of the day grouped in three categories. Only the categories of Home and Work were considered. Data source: CSIS
Applying the method resulting in two datasets. One for building footprints of residences and one of workplaces, both of which contain the estimated population of each building in 24 hourly segments. At the end of this step we had obtained the information necessary for our identification of potential vertical evacuation sites: (a) The volume available to be occupied in each building after two tsunami scenarios, and (b) the estimated population of each building at each hour of the day (Figure 8).

Fig. 8: Results of the 24 hour building population estimation method for the city of Shizuoka at 12pm
4.3 Validation
We opted to validate the building population estimation method with field measured data, not only to verify the method itself, but also its slight adjustment to the datasets for Shizuoka City. We followed the same method as Greger 29, by observing the number of individuals that exit and enter two workplace buildings, one in the centre of Shizuoka and one in the are of Shimizu. Out of respect to the local residents’ privacy, we did not engage in any measurements of residential buildings, and the exact location of the workplaces will selected will also be kept under discretion.
Figures 9 and 10, show the field observed populations for the two buildings and the estimated by the method populations. Building A, an office building has similar estimated and observed values, however, in the late evening hours where the method estimated that people would be returning home, in reality there was a social gathering a number of people as well as some visitors remained in the building till later hours. Given the nature of the data used, we anticipate that it would be of extreme difficulty for this method to anticipate for such irregularities. Building B, was a bank, and similarly to building A the method has similar observed and estimated population values, except for some differences that are due to increased client numbers at different hours. Once again, such variances can be completely random and isolated and would be extremely difficult to be captured by any dataset, and consequently a method.
Excluding the small irregularities that were observed, the majority of measured and estimated populations were of similar values and we were able to verify a close approximation of the population of buildings by the applied methodology.

Fig. 9: Observed and estimated populations values for Building A, an office building in the area of Shimizu

Fig. 10: Observed and estimated populations values for Building B, a Bank in the CBD area of Shizuoka
5. Potential vertical evacuation site identification
5.1 Evacuation Criteria
In the literature review section it was discussed how vertical evacuation studies in the past have been limited, and how the main focus of the majority of studies has been the physical characteristics of buildings such as their resilience, shape and height. Because of that, there is an absence of established criteria on how populated or unpopulated a building has to be in order to be used for vertical evacuation, and by extent how much volume an evacuee would occupy in that building.
Our concept for this approach is that each building that is more than one floor and is not completely flooded can provide its available volume for vertical evacuation. Moreover, we anticipate, and have demonstrated by our building population estimation, that the volume available for evacuation is expected to be variable during different times of the day as such buildings are expected to be occupied by individuals either for residence or work. In the absence of a previous framework of necessary volume standards we introduced plausible criteria to test our approach. It should be noted that due to the nature of the method these criteria can be adjusted or updated with any other criteria necessary by a complete vertical evacuation plan.
In order to complete the identification of potential vertical evacuation sites we assumed the following: (1) Potential vertical evacuation sites will be buildings with more than one floor, and have an inundation ratio of 25% or less. This ensures that even buildings with two floors are not going to be flooded to extents that might potentially destroy them. (2) Each individual that is either situated in the building already, or is going to evacuate to the building is going to occupy 6 cubic meters of volume. The volume required by those already situated inside is going to be subtracted from the available volume and the rest will be used to determine how many additional individuals can be accommodated for vertical evacuation. Finally, at a given hour of the day X, the number of people that can be accepted in each building that is 25% or less flooded was estimated by the following equation:
Where N is the number of people that can be accepted by the building, VB is the volume of the building, IR is the inundation ratio of the building, PBX is the population of the building at time X, and VE is the volume allocated per person for evacuation.
5.2 Results
Using the above formula for both scenarios produced two kinds of results. The first, is the total number of potential vertical evacuation sites per scenario, and the second, the number of people that can be accepted in each building and in the whole of the flood zone of each scenario.
For the 10m scenario, there were 2,046 buildings that met the criteria, out of which 1,551 were residences and 410 were workplaces. In the case of the 5m scenario, 1,643 buildings were identified, out of which 1,233 were residences and 410 were workplaces. Concerning the population that can be accepted in these buildings, the results showed that the number was variable during different times of the day. Figure 11 summarises the total number of people that can be accepted in these potential sites, for each scenario and for different hours of the day. We found that as the population moves, there are discreet differences in the available volume that buildings can offer to evacuees. The morning hours between 10 and 11 offer the most available volume and show the highest capacity for evacuees. In the case of the 10 m scenario, up to 873,537 individuals could be accepted, while in the 5 m scenario the number was down to 304,734. This translates to more than 100% of the population of the city for the 10m scenario and to 43% of the population for the 5 m scenario. The 5m scenario shows a much lesser capacity to accommodate evacuees, however, given the much limited extend of its respective flood zone, the potential for vertical evacuation is still high. The total capacity for evacuees lessens as the day progresses towards the evenings with the late night hours having the smallest numbers of vertical evacuees that can be accepted.

Fig. 11: Temporal variations of additional population that can be accepted for vertical evacuation in buildings 25% or less inundated
5.3 Discussion
The results that were described earlier demonstrate that there is a difference between the two scenarios when it comes to the number of potential sites as well as the number of individuals they can support. This can be attributed to the fact that the severity between the two scenarios is different, and they have flood zones that have variable extents and not only affect different number of buildings but also numbers of populations that are situated in these locations.
In both scenarios the buildings that were identified as potential vertical evacuation sites were residential as well as workplaces, but the residences outnumbered the workplaces 3 to1 and 4 to 1 in the 10 m and 5m scenario respectively. This introduces the temporal dynamic that was verified by the fact that the number of people that can evacuate in the potential sites is increased in the morning hours and decreased in the evening and night hours. Considering that in both scenarios we have many more residences than workplaces as potential vertical evacuation sites, could explain the higher available volumes in the morning, as many locals leave their residences to engage in daily activities, and move to different parts of the city. In contrast, the evening hours have less available volume as the residents return home occupying these previously less populated buildings, while the workplaces that are now scarcely populated or empty are not high enough in numbers to match the morning volumes of residences.
Despite these differences during different hours of the day, the population that can fit in these potential sites was surprisingly high. In fact, within the flood zone of the 10m scenario there is enough volume available in potential sites to accommodate the whole population of the city of Shizuoka in the morning hours. At the same time, in the limited flood zone of the 5 m scenario, there is still enough volume for 43% of the population of the city. This could mean that there is an abundance of volume in the buildings of Shizuoka, with some of them being empty or scarcely populated. Observations from field work in the city pointed towards this direction, but no qualitative methods were used to verify them.
It should be stressed that the buildings identified by our approach are sites that can be potentially used for vertical evacuation. In this case we focused on the inundation and perhaps mainly on the population of those buildings. Due to the extent of the flood zones and the number of buildings in Shizuoka we were unable to incorporate structural attributes into our method. The results produced in this study should be used as part of a greater vertical evacuation plan, which can offer the appropriate resources for a structural evaluation of those buildings. Moreover, access to the potential sites, as well as the general procedures of the evacuation itself remain outside the scope of this study due to similar limitations, and should be the focus of further research or evacuation planning in the future.
6. Conclusions
Our approach has shown that the attributes of building population and tsunami severity affect the way buildings can serve as vertical evacuation sites in a spatiotemporal way. The inundation of buildings differs between the 5 meter and 10 meter scenarios not only number of buildings within their flood zones, but also in the way buildings are extensively flooded or not in overlapping areas of the scenarios, indicating discreet spatial variations.
Using Greger’s29 building population estimation method has revealed a temporal aspect of vertical evacuation due to the mobility of Shizuoka’s population over the course of a day. Residential buildings were shown to be emptier during the daytime while non residential workplace buildings became more populated, with the opposite occurring in the evening, night and early morning hours.
The number of individuals situated in buildings at a different hour dynamically affected the potential of acceptance of additional individuals that are vertically evacuating. By setting criteria of buildings inundated to 25% or less of their volume, and 6 cubic meters of volume per person we showed that for the case of Shizuoka City, its whole population could potentially fit in the available building volume in the case of the 10 m scenario and 43% of the city’s population in the 5 m scenario.
The tsunami inundation scenarios and vertical evacuation criteria used to test our approach can be exchanged for any kind of scenario and criteria that match any goals or research pursuits. Moreover, the method can be applied in other areas of Japan or the rest of the world, where similar datasets are available, or can be obtained by field work. However, the results of our method identify sites that can only potentially be considered. Vulnerability and engineering assessments are necessary in order for the viability of these sites to be concluded. Accessibility and evacuation routing to these sites must also be considered, under the scope of a complete evacuation plan.
Competing Interest Statement
The authors have no competing interests.
Corresponding Author
Gerasimos Voulgaris ([email protected])
Data Availability Statement
All relevant metadata and resulting data are within the article. Open source datasets used were obtained from the following two institutions: (a) Geospatial authority of Japan (GSI). In their website, free registration is required for open access to GIS data for the whole of Japan. Visit https://fgd.gsi.go.jp/download/menu.php and select the dataset option required. They are divided in basic map information and Digital Terrain Models. Upon selecting the required data, free registration is required before finalising the download. (b) The National Statistics Bureau of Japan. While their website has English support it might be limited. To obtain any kind of spatial statistics, visit https://e-stat.go.jp/SG2/eStatGIS/page/download.html , then select the area and type of statistics required and proceed to download. Minimal personal information such as institution and purpose might be required. Non open source datasets were obtained via the Joint Research Assist System (JORAS) of the Center of Spatial Information Science (CSIS), Tokyo University. In order to obtain data, application via form is necessary at CSIS. By visiting https://www.csis.u-tokyo.ac.jp/english/joint_research.html , and completing the relevant form, it is possible to obtain the relevant datasets for non commercial use only.