Introduction: In the past decade significant attention has been given to the development of tools that attempt to measure the vulnerability, risk or resilience of communities to disasters. Particular attention has been given to the development of composite indices to quantify these concepts mirroring their deployment in other fields such as sustainable development. Whilst some authors have published reviews of disaster vulnerability, risk and resilience composite indicator methodologies, these have been of a limited nature. This paper seeks to dramatically expand these efforts by analysing 106 composite indicator methodologies to understand the breadth and depth of practice.
Methods: An extensive search of the academic and grey literature was undertaken for composite indicator and scorecard methodologies that addressed multiple/all hazards; included social and economic aspects of risk, vulnerability or resilience; were sub-national in scope; explained the method and variables used; focussed on the present-day; and, had been tested or implemented. Information on the index construction, geographic areas of application, variables used and other relevant data was collected and analysed.
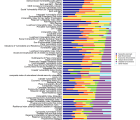
Results: Substantial variety in construction practices of composite indicators of risk, vulnerability and resilience were found. Five key approaches were identified in the literature, with the use of hierarchical or deductive indices being the most common. Typically variables were chosen by experts, came from existing statistical datasets and were combined by simple addition with equal weights. A minimum of 2 variables and a maximum of 235 were used, although approximately two thirds of methodologies used less than 40 variables. The 106 methodologies used 2298 unique variables, the most frequently used being common statistical variables such as population density and unemployment rate. Classification of variables found that on average 34% of the variables used in each methodology related to the social environment, 25% to the disaster environment, 20% to the economic environment, 13% to the built environment, 6% to the natural environment and 3% were other indices. However variables specifically measuring action to mitigate or prepare for disasters only comprised 12%, on average, of the total number of variables in each index. Only 19% of methodologies employed any sensitivity or uncertainty analysis and in only a single case was this comprehensive.
Discussion: A number of potential limitations of the present state of practice and how these might impact on decision makers are discussed. In particular the limited deployment of sensitivity and uncertainty analysis and the low use of direct measures of disaster risk, vulnerability and resilience could significantly limit the quality and reliability of existing methodologies. Recommendations for improvements to indicator development and use are made, as well as suggested future research directions to enhance the theoretical and empirical knowledge base for composite indicator development.
