Method: 50 manifest HD patients were tested in social cognition and executive functions and each answered a self-report questionnaire about current status of perceived psychological distress (the Symptom Checklist-90-Revised (SCL-90-R)). Correlation analyses of test performance and SCL-90-R scores were made as well as stepwise linear regression analyses with the SCL-90-R GSI score and test performances as dependent variables.
Results: We found that less psychological distress was significantly associated with worse performances on social cognitive tests (mean absolute correlation .34) and that there were no significant correlations between perceived psychological distress and performance on tests of executive functions. The correlations between perceived psychological distress and performance on social cognitive tests remained significant after controlling for age, Unified Huntington’s Disease Rating Scale-99 total motor score and performance on tests of executive functions.
Conclusions: Based on previous findings that insight and apathy are closely connected and may be mediated by overlapping neuroanatomical networks involving the prefrontal cortex and frontostriatal circuits, we speculate that apathy/and or impaired insight may offer an explanation for the correlation between self-report of psychological distress and performance on social cognitive tests in this study.
]]>Introduction
Huntington’s disease (HD) is an autosomal dominantly inherited neurodegenerative disorder caused by an expanded CAG repeat on chromosome 41 and characterized by motor symptoms, psychiatric symptoms and cognitive decline. Once onset of motor symptoms has occurred, cognitive and/or psychiatric symptoms also tend to be present 2,3,4,5. The cognitive deterioration in HD is thought to be related to dysfunction of the frontostriatal circuits due to gradual degeneration of the striatum6,7. Accordingly, the first signs of cognitive impairment are observed in cognitive functions associated with the prefrontal cortex such as executive functions and social cognitive functions4,8,9,10. Psychiatric symptoms are also commonly found even in the presymptomatic and earliest stages in HD, and a wide variety of psychiatric symptoms such as apathy, depression, irritability, anxiety, mania and obsessive compulsive symptoms can be seen11.
Performance on tests of social cognition and executive functions are often affected by psychopathology. Associations between social cognitive functions, executive functions and psychiatric symptoms have been investigated in both psychiatric and neurological disorders such as schizophrenia, depression, bipolar disorder, Parkinson’s disease (PD) and frontotemporal dementia (FTD)12,13,14,15,16,17,18. The most common finding being that greater degree of psychiatric symptoms are associated to worse performance on tests of executive functions and social cognition.
In two previous studies we have investigated performance on tests of executive functions and social cognition in a large cohort of HD patients in early-moderate disease stage and found a high frequency of impaired performances on tests of executive functions and social cognition2,4. Based on the associations between the presence of psychiatric symptoms and impairments in executive functions and social cognition found in other patient groups we wanted to investigate how subjective experience of psychological distress as reported by patients with Huntington’s disease is related to performance on tests of social cognition and executive functions.
Therefore the aim of this study was to investigate the relationship between self-report of perceived psychological distress and performances on a battery of tests of executive functions and social cognition in a large consecutive cohort of HD patients. We wanted to investigate: 1) whether performances on tests of social cognition and executive functions are correlated, and 2) whether performances on tests of social cognition and executive functions are associated with degree of self-reported psychological distress. To our knowledge, this is the first study to compare performance on a large battery of tests of social cognition and executive functions to self-report of psychological distress in HD.
Methods
Participants
Participants were recruited from January 2012 to March 2013 from the Neurogenetics Clinic, Danish Dementia Research Centre, Rigshospitalet. Fifty HD patients with a CAG repeat ≥39, a Unified Huntington’s Disease Rating Scale-99 total motor score (UHDRS-TMS) of >519, a Mini-Mental State Examination (MMSE) score ≥ 24, and a Montreal Cognitive Assessment (MoCA)20 score ≥ 20 were included in the study. Exclusion criteria were other neurological illness, ongoing alcohol or drug abuse and having a native language other than Danish. Table 1 shows the background information for the HD patients. All patients had gone through genetic counseling and had been informed of their genetic status prior to (and independently from) study enrolment. We have previously published results from the same cohort2,4,5,21 also including premanifest HD carriers, but since we found no impairments in social cognitive functions in our premanifest subjects we did not include them in the present study.
Table 1. Background information. Results shown as median (range)
Procedure
The study was approved by the Ethics Committee of the Capital Region of Denmark(H2-2011-085), and written informed consent was obtained from each participant before enrollment. All participants had a minimum of two planned visits. At one visit psychiatric screening and neurological examinations were performed. At the other visit neuropsychological testing was performed. The same physician and the same neuropsychologist performed all examinations. The examination by the physician and the examination by the neuropsychologist were performed blinded to one another.
Neuropsychological Testing
All participants were tested with an extensive three-hour battery of neuropsychological tests, including tests of attention, memory, visuospatial functions, executive functions and social cognition. For this study only tests of executive functions and tests of social cognition are included. The tests were administered in a fixed order. The education index score (range 8-17) was calculated as the sum of years of schooling (range 7-12) and the level of post-secondary education stratified into groups (range 1-5) based on the method previously used by Mortensen and Gad.22
Emotion Hexagon (EH)23: This test consists of 30 cards with pictures of morphed facial expressions of the six basic emotions: happiness, surprise, fear, sadness, anger and disgust. Each of the six emotions was represented with four pictures; each picture was morphed with either 10% or 30% of the neighboring emotions (e.g. happiness is morphed with either 10% or 30% anger or surprise). Between two neighboring emotions was a picture morphed with 50% of each emotion; these were not counted in the total raw score. A card with the six emotion words was presented, and each of the six emotions was explained before the pictures were shown to the participants and remained visible for them during the test. The pictures were shown in random order, and the participants were asked to choose which of the six emotions best described the facial expression. The pictures were shown only once, and no feedback was given. The test was scored as the total number of correct responses (0-24).
Emotion Evaluation Task (EET)24: The EET consists of 28 short videotaped vignettes (15-60 seconds) of actors interacting in everyday situations. In some of the scenes there is one actor only, and in other scenes there are two (the participant was then told on whom to focus). The participants were asked to choose whether the actor was displaying one of the six basic emotions: happiness, surprise, sadness, anger, fear or disgust or no particular emotion (neutral). The EET does not exist in a Danish version and therefore the video clips were shown without sound in order to exclude any influence of differences in English language abilities. Each video was shown once, and no feedback was given. The test was scored as the total number of correct responses (0-28).
Social Inference – Minimal (SI-M)24,51: The SI-M (Danish version: (Bliksted, Fagerlund, Weed, Frith, & Videbech, 2014) consists of short (15-53 seconds) videotaped vignettes with professional actors interacting in everyday situations. The exchanges are either sincere or sarcastic. The sarcastic vignettes are either with simple sarcasm, meaning that they are acted in such a way as to imply the opposite meaning to what is actually being said, or with paradoxical sarcasm meaning that the exchange of words is meaningless unless one understands that one of the actors is being sarcastic. After each video, the participant was asked four yes/no questions about the interaction. Correct answers to the questions for the sarcastic videos required interpretation of paralinguistic cues such as tone of voice and non-verbal cues such as posture and facial expressions. The test comprises part A2 and part B2. Part A2 consists of five videos of paradoxical sarcasm and ten vignettes that are either sincere or with simple sarcasm. Part B2 consists of exactly the same dialogue as the ten sincere or simple sarcastic videos from part A2 but with sincerity and sarcasm switched. For this study the participants were shown all 25 videos. Each video was shown once, and no feedback was given. Total number of correct yes/no answers (0-100) was used in the present study.
Reading the Mind in the Eyes Test (RME)25: The RME revised version consists of 36 photos of eyes expressing different emotional states. The participants were given four choices of words and were asked to pick the word that best described what the eyes expressed (e.g., serious, ashamed, alarmed or bewildered). In order to pick the correct emotion the participant needed to be able to attribute mental states to others thereby using Theory of Mind (ToM). The participants were also given a list of explanations of all the words in the test and were encouraged to look up the words if they felt uncertain of the meaning of a word. The number of correct responses was recorded (0-36).
Semantic fluency26: The participants were asked to name as many different animals as they could think of within one minute. It was emphasized that all types/categories of animals would be correct. Categories (e.g., birds) as well as specific animals (e.g., eagle) were accepted. The number of different animals named was recorded.
Lexical fluency26: The participants were asked to produce as many words as possible within one minute beginning with each of the letters F, A or S. It was emphasized that it could be all words in Danish except proper nouns. The number of different words produced with F, A and S were recorded and added together for a total score.
Lexical alternating fluency. This fluency test was developed by the researchers based on the most common first-letters in Danish apart from S and F. The participants were asked to produce as many different words as possible within one minute, alternating between words beginning with the letter K and words beginning with the letter B. It was emphasized that it could be all types of words except proper nouns. The number of correct responses was recorded, and improper alternations were counted as incorrect.
Semantic/lexical alternating fluency. This fluency test was developed by the researchers based on a category that was thought to be very broad and one of the most common first-letters in Danish apart from S, F, K and B. The participants were asked to produce as many different words as possible within one minute alternating between types of food and words beginning with the letter D. They were told that the former could be “anything you can eat”, and that the latter covered all words beginning with the letter D except proper nouns. The number of correct responses was recorded; improper alternations were counted as incorrect.
Trail Making Test B (TMT B)27:The participants were asked to connect circles alternating between numbers in numeric order and letters in alphabetical order. The time to completion was recorded.
Stroop interference test28: This 100-word version of the Stroop test consisted of a simple reading task and an interference test. In the interference test the name of the color and the color of the ink did not correspond, for example the word ‘blue’ could be written in green ink, and the participants were asked to name the colors instead of reading the words. Participants were instructed to complete the test as quickly as possible and to correct their mistakes. Only the time to completion for the interference test was used for analysis.
Self-report of psychological distress
Symptom Checklist -90-Revised (SCL-90-R)29: The SCL-90-R is a 90 item self-report inventory designed to reflect the current status of perceived psychological distress. The participant is asked to rate each of the 90 items on a five-point Likert scale ranging from “not at all” to “very often” according to how much they experienced each symptom in the preceding week. The scoring is based on nine primary symptom dimensions: somatization, obsessive-compulsive, interpersonal sensitivity, depression, anxiety, hostility, phobic anxiety, paranoid ideation and psychoticism. Added together these yield three global indices of distress: Global Severity Index (GSI), Positive Symptoms Distress Index and Positive Symptom Total. For the current study raw scores were converted into T-scores standardized to a normative Danish sample stratified by gender50. Higher T-scores indicate greater degree of psychological distress. Only the GSI score was used for the association analyses in current study.
Statistical analysis
Results for the background variables are presented as medians and ranges. Pearson’s r and Spearman’s Rho (rs used for skewed distributions) were used to assess the level of significance of correlations between the cognitive tests and the SCL-90-R GSI scores and also to investigate the level of significance of associations between performances on tests of social cognition and executive functions. Lastly stepwise linear regression analyses were used with SCL-90-R GSI score as the dependent variable and scores on each of the social cognitive tests that were significantly associated with SCL-90-R GSI score as independent variables. For each regression analysis performances on all of the executive tests (Lexical fluency, Semantic fluency, Lexical alternating fluency, Semantic/lexical alternating fluency, Stroop test and TMT B), age and UHDRS-TMS were also included as independent variables. Plots of residuals were used as model control and the alpha level was set to .05 (two-tailed).
Results
Table 2 shows the median and interquartile range for performance on all tests of executive functions and social cognition, as well as the median and interquartile range for the standardized T-scores on the GSI and the nine symptom dimensions of the SCL-90-R.
Table 2. Scores for HD carriers on the cognitive tests and the Symptom Checklist-90-Revised Global Severity index and the nine primary symptoms dimensions. Results shown as median (interquartile range)
Table 3 shows the correlations between social cognitive tests and tests of executive functions. As expected we found that performances on all four social cognitive tests were significantly correlated with each other. Performances on all four social cognitive tests were also significantly associated with performances on tests of executive functions (mean correlation .24).
Table 3. Correlations between tests of executive functions and tests of social cognition. Results shown as Spearmans Rho.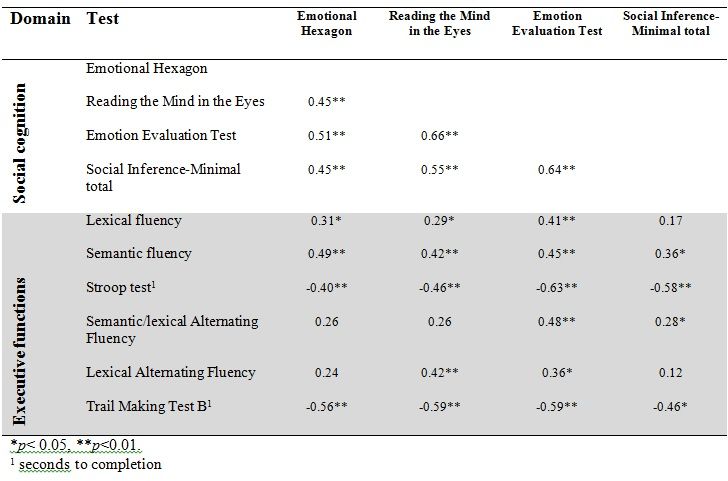
Table 4 shows the correlations between the SCL-90-R GSI score and the UHDRS-TMS and the tests of executive functions and social cognition. We found a significant correlation between the SCL-90-R GSI score and scores on three of the four social cognitive tests (the SI-M total, the EET and the RME), such that better test performance was related to more perceived psychological distress. The mean overall correlation was .34. By contrast, none of the correlation coefficients between the SCL-90-R GSI score and the tests of executive functions reached significance. Motor symptoms were not significantly correlated to SCL-90-R GSI score, but were significantly correlated to performance on most tests of executive functions and social cognition.
Table 4. Correlations between SCL-90-R GSI score, UHDRS – TMS and test of executive functions, social cognition. Results shown as Pearsons r (r) or Spearmans Rho (rs).
Table 5 shows the result from the stepwise linear regression analysis. We found that the correlation between score on SCL-90-R GSI and RME, EET and SI-M score remained significant after including performances on all of the executive function tests (Lexical fluency, Semantic fluency, Lexical alternating fluency, Semantic/lexical alternating fluency, Stroop test and TMT B), age and UHDRS-TMS in the analysis. We also found a significant negative effect of age on SCL-90-R GSI score.
Table 5. Stepwise linear regression results
Discussion
This study investigated whether performances on tests of social cognition and executive functions were associated with perceived psychological distress in a group of HD patients. Since greater degree of psychiatric symptoms such as depression has been negatively associated with both social cognitive skills and executive functions, we were surprised that more perceived psychological distress was significantly associated with better performances on social cognitive tests and that less perceived psychological distress was associated with worse performance on social cognitive tests. The correlations between psychological distress and tests of executive functions were non-significant. Furthermore, the correlations between self-reported psychological distress and performance on social cognitive tests does not seem to be an artefact of those being furthest in the disease progression performing worse and reporting fewer psychological symptoms since the associations remained significant after controlling for age, UHDRS-TMS and performance on tests of executive functions. This means that for our cohort of HD patients feeling less psychologically distressed themselves was associated to worse performance on tests of the ability to recognize emotions, ToM and sarcasm in others. This is an interesting finding that may help to understand the interpersonal problems often associated with HD. It may be helpful for clinicians and caregivers to know that feeling little psychological distress oneself may also influence the ability to recognize distress in others.
We used a self-report measure of psychological distress, and it is important to remember that self-report of psychological distress in HD may be influenced by poor insight, which is a common feature of HD30,31. This means that although the patients themselves do not report having psychiatric symptoms this might not be true from a clinician or caregiver perspective. This means that our findings do not necessarily indicate that poor social cognition is genuinely associated with fewer psychiatric symptoms in patients with HD from an outside perspective. Instead, our findings may reflect a relationship between insight and emotion recognition as has been demonstrated in related disorders32 and a close connection between our understanding of the self and others33.
Social developmental research has long posited the idea that representations of the self and other are closely connected34, and research in neuroscience has supported the view of common representation networks between self and other involving, in particular, the parietal cortex, superior temporal sulcus, limbic areas, striatum and orbital and medial areas in the prefrontal cortex33,35,36,37. Since representations of others are closely connected to our representation of the self, it could be speculated that loss of insight and flattening of affect in oneself may be associated with less sensitivity to others’ emotional states as well, leading to a state of being ‘comfortably numb’. We speculate that an alternative explanation of our results may be that a flattening of affect (from here on referred to as ‘apathy’) and impaired insight has led to low self-report of psychological distress in our cohort and that this was related to the weaker understanding of others (i.e. poor social cognitive skills including emotion recognition).
Impaired insight and apathy are well-known features of HD31,38,39 and other psychiatric and neurological disorders affecting the prefrontal cortex and frontostriatal circuits such as schizophrenia, PD and FTD. Apathy ratings have been associated with white matter changes in the orbitofrontal cortex in HD, and in both PD and FTD apathy has been associated with areas of the striatum and frontostriatal circuits13,17. In schizophrenia negative symptoms have been inversely associated with striatal activation40. These studies suggest that social cognition, insight and apathy may in part be mediated by overlapping neuroanatomical networks involving the prefrontal cortex and frontostriatal circuits. Thus HD may be a relevant condition in which such associations can be studied.
Studies of patients with HD, schizophrenia and FTD suggest a reciprocal relationship between insight and apathy (or negative symptoms), such that higher scores of apathy or negative symptoms have been associated with impaired awareness of these symptoms30,41,42. In fact, impaired insight has been associated with better mood in both HD and schizophrenia meaning that patients with less awareness of illness and symptoms has been associated with fewer symptoms of depression, whereas greater self-awareness has been associated with higher depression scores14,42,43,44. These findings support the view that apathy and lack of insight are closely connected and they also point in the direction of patients with symptoms of apathy being expected also to have poor self-awareness and therefore to report neither apathetic symptoms nor psychological distress in general.
Impaired insight and higher apathy scores have been found to be associated with worse performances on social cognitive tests in FTD, PD and schizophrenia13,41,42,45,46. One study in FTD found that patients’ own ratings of apathy were positively correlated to ToM whereas the caregivers’ apathy ratings were negatively associated with ToM performance13, indicating that greater awareness of apathetic symptoms was associated with better social cognitive skills. This finding may reflect the close connection between representations of the self and other and is in line with our results indicating that patients with better self-awareness also have a better understanding of others’ emotional states and vice versa. We found no associations between self-report of psychological distress and performance on tests of executive functions. This was somewhat surprising since psychiatric symptoms such as depression has often been associated to impairment in executive functions. There may be several different explanations for this finding. It may be that the tests used in this study are not sensitive to the type of executive dysfunction associated with psychiatric symptoms. It could also be that the types of psychiatric symptoms that are associated with executive dysfunctions are not well measured by the SCL-90-R. In a study by Thompson et al. 47 they found that only apathy was significantly associated with impairment in executive functions in HD.
No other studies that we know of have found significant correlations between self-report of psychological distress and performance on social cognitive tests in HD. Two studies have investigated the correlation between alexithymia and emotion recognition and ToM in HD but found no significant correlations48, and one other study found no significant associations between performance on a ToM task and psychiatric symptoms on the Positive And Negative Syndrome Scale in HD49. Discrepancies between our results and previous findings may be explained by different methodological approaches, and these previous studies had small sample sizes compared to our study.
Limitations
There are several limitations to our study. In an exploratory study like this was, there can be quite a lot of statistical comparisons and thus a chance of false positive findings. The use of a self-report measure of perceived psychological distress may have been misleading, since some HD patients are known to show poor awareness of their symptoms. Future research should add ratings from caregivers or clinicians to overcome this problem and to get more information about the relationship between social cognitive performances and insight in HD. Also an apathy rating scale or a scale for rating negative symptoms, would have helped to clarify the mechanisms for our findings. Future studies should apply apathy ratings to investigate the association between social cognition and apathy in HD.
Other limitations to the study relate to the tests used. The Danish version of TASIT was developed for research purposes and it has not been standardized and validated. This must, of course, lead to caution when interpreting results. Sarcasm as a part of everyday interaction is somewhat culture specific and thus generalization to all other cultures may be limited. The EET of the TASIT does not exist in a Danish version and thus was used without sound. The clinical impression of performances on this test was that it was still meaningful and there were no significant differences between healthy controls and premanifest HD carriers on performances on the EET in a previously published study (ref). Although our evaluation was that the test was still meaningful, the different use of the test from its original form requires caution when interpreting the results.
Conclusions
We found significant associations between self-report of psychological distress and performances on social cognitive tests but not on tests of executive functions. According to our findings HD patients that feel less psychologically distressed themselves perform worse on tests of the ability to recognize emotions, ToM and sarcasm in others. This is an interesting finding that may be of importance for understanding the interpersonal problems often associated with HD. We speculate that one mechanism for this finding may be that shared representations of self and other as well as insight and apathy may be closely connected and may be mediated by overlapping neuroanatomical networks involving the prefrontal cortex and frontostriatal circuits. Therefore we speculate that a flattening of affect or apathy and impaired insight has led to low self-report of psychological distress in our cohort and that this was related to the weaker understanding of others (i.e. poor social cognitive skills including emotion recognition).
Competing Interests Statement
The authors have declared that no competing interests exist
Data Availability Statement
All relevant data are within the manuscript.
Corresponding Author
Ida Unmack Larsen ([email protected])
Project Aim: The aim of this cross-sectional study is to assess QoL among Cypriot patients with HD, using a standardized health-related QoL questionnaire.
Materials and Methods: A generic QoL questionnaire was used, namely EQ-5D, which is a standardised instrument for use as a measure of health outcomes and is applicable to a wide range of health conditions. The study was conducted with 34 patients, which represented 46% of the Cypriot HD patient population.
Results: Ability of patients to care for themselves and to carry out usual activities were reported to be most severely affected (37.5% and 40.6% replying “Severe Problems” respectively). Mobility and psychosocial well-being were also affected to a lesser extent (25.0% and 15.6% replying “Severe Problems”). Interestingly, in the anxiety/depression scale, 77.8% of asymptomatic patients reported “Some Problems”. Half of the patients did not experience pain or discomfort but 40.6% reported “Some Problems” and 6.3% reported “Severe Problems”. The Health Status as perceived by the patients was found to be moderately to severely affected. In multivariate ordinal regression analyses, age at onset and disease duration significantly impacted on self-care. In addition, disease duration was significantly associated with mobility, self-care and usual activities scales. No significant determinants were evidenced for Pain/Discomfort and Anxiety/Depression. Lastly, age of onset was found to be the only significant determinant of the cumulative QoL score (Range=5-15).
Conclusions: Age at onset and disease duration were found to severely affect the QoL of Cypriot HD patients, and more specifically their mobility, ability to self-care and perform usual activities. The percentage of patients reporting “Some Problems” in the Pain/Discomfort category can be explained by the direct translation of the word as presented in the questionnaire, indicating the need for language specific instruments. Perhaps more noteworthy is the phychosocial burden on even asymptomatic patients, which needs to be acknowledged and managed to improve their quality of life.
]]>Introduction
Huntington’s disease (HD) is a fatal progressive neurodegenerative disease of the central nervous system (CNS), in which patients experience profound motor, behavioural and cognitive symptoms1. Despite the enormous burden of this disease on the quality of life (QoL) of patients and their families, there is very limited evidence on this topic.
HD is a devastating disorder and besides progressive chorea is also characterized by rigidity and dementia2. A wide range of psychiatric disturbances and behavioral problems is also associated with the disease, which include depressed mood, anxiety irritability, apathy and psychosis3. It is important to catalogue the entire range of possible symptoms because they have a substantial impact on the ability of individuals to go about their daily activities, and the disease is known to cause severe disabling and distress4.
The inheritance type of disease is autosomal dominant, i.e. children of HD gene carriers have a 50% chance of inheriting the gene5. The mean age at onset of symptoms is 30-50 years, and leads to death within 17–20 years 6, where the juvenile HD appears in individuals under the age of 20, and is usually transmitted paternally7.
The genetic mutation is determined in chromosome 4p16.3, which encodes the huntingtin protein (348-kDa). A genetic alteration in the HTT gene causes HD due to the increased number of repetitions of “triplet” nucleotides ‘Cytosine Adenine Guanine’ (CAG)8, which is associated with accumulation of an abnormal misfolded protein. This can impair cell function and lead to neuronal loss and it affects large number of pathophysiological pathways, i.e. a proteinaceous aggregation, which interferes with cellular trafficking9.
Presenting the phenotype of HD patients, HD belongs to the family of movement disorders, which can be divided into two categories; hyperkinesia, which is defined as involuntary movements, classically chorea or not rhythmic movements, and hypokinesia of voluntary and automated movements10. Motor impairment is usually amongst the first symptoms of HD patients, and in progressive stages is characterized by dystonia, rigidity and bradykinesia5.
Behavioural alterations in HD often cause the most distress both patients and their families and are therefore often central in the practical clinical management of patients11. The most common psychiatric symptoms, which occur as part of the disease, include depression, anxiety, apathy, irritability, and obsessive-compulsive disorder (OCD) (3). Moreover, recent findings from Wetzel et al.12 show suicide rates were reported to be 9.5% in HD individuals, and suicidal ideation 26.5%. One of the leading causes of death of HD patients is suicide, another being pneumonia13.
The final important aspect of HD in patients is cognitive impairment. HD is associated with significant memory decline in early stages, and even poorer presentation in later stages, compared to healthy individuals 14,15.
HD occurs in all racial groups but a higher prevalence was observed in Europe, North America, and Australia with 5.70 cases per 100.000, with a much lower in prevalence in Asia of 0.40 per 100.000 16. Prevalence of HD in Cyprus in 2012 was 7.22 per 100,000, while the incidence was 0.62 per year. Prevalence in Cyprus is therefore higher than the respective worldwide figure, although the sample size is too small to make definitive statements.
Quality of Life (QoL) measures provide an effort to improve care. Clinical research sometimes considers these as outcome measures, but clinical practice has not, thus far, made significant use of them (Higginson and Carr 2001). QoL has potential uses in aiding routine clinical practice. They can be used to obtain a ranking of problems according to severity, maintain focus on patients’ main complaints, and identify less obvious issues, particularly psychological ones, improving clinical cooperation and monitoring treatment performance. They can also be used in clinical audit and in clinical governance17. Overall, QoL measures can be a predictor of treatment success, and several studies have shown that factors such as QoL, physical well-being, mood and pain are of prognostic importance18.
There is an increasing body of research associated with the negative impact of HD in the QoL of patients. The majority of studies conclude that HD has an adverse effect on patients’ physical and psychosocial well-being, where the effect on the latter is greater19,20,21. A recent study has demonstrated that people with progressive neurological disorders, such as Alzheimer Disease, Parkinson Disease or HD, suffer from negative mood swings and have lower QoL scores. The findings show that HD patients exhibited the most severe illness-related symptoms, and the greatest effects on mood and their QoL. In particular, HD patients had the least control over their bodily functions, found the greatest difficulty in tasks requiring cognitive functions, and experienced the greatest number of psychological symptoms, as well as high levels of confusion21.
Even compared to other neurodegenerative disorders, neuropsychiatric symptoms in HD have been found to have a much greater effect on QoL. In particular, behavioural alteration is prevalent and psychopathology is affected more severely21,22. Considering the severity of HD, the fact that currently there is no cure for the disease, and the high prevalence of HD in Cyprus, more studies are needed to assess QoL among Cypriot patients, in order to improve our knowledge about their living conditions and to assist the management of this condition.
The aim of this cross-sectional study was to assess QoL among Cypriot patients with Huntington disease, using a standardized health-related quality of life questionnaire. The specific objectives of this study were to assess the quality of life of Huntington disease patients visiting the Cyprus Institute of Neurology and Genetics for follow-up and treatment and to investigate socio-demographic and clinical determinants of quality of life among these patients (i.e. gender, current age, age at onset of disease, age tested, disease status, parent-of-origin and number of repeats in HD allele).
Materials and Methods
Study Design and recruitment of participants
The present study took place at Neurology Clinic D, at the Cyprus Institute of Neurology and Genetics (CING). Ethical approval was granted by the Cyprus National Bioethics Committee (ΕΕΒΚ ΕΠ 2013.01.06).
The target sample for the project comprised of all alive HD patients registered at CING (n=62). From those, it was possible to contact 37 participants. The remaining 25 were either too severely disabled to come to CING for completion of the questionnaire or their treating physicians suggested that these particular patients had refused any contact from CING previously. Out of those 37, 3 refused to participate, thus the total number of participants for the current study was 34. Participants were recruited at CING during routine visits, and after having signed a Consent Form .
The only inclusion criteria for patients were to have a confirmed diagnosis of HD and to have given consent for participation, via the aforementioned Consent Form. Participants were already aware of their condition during data collection.
Once participants had read the information in the Consent Form and signed the forms, they were asked to answer the EQ-5D Questionnaire, in order to assess their QoL. All questionnaires were anonymized using the patient’s unique CING medical record number, which was written on the questionnaire.
For patients at advanced stages of HD who may not have been in a position to read and comprehend the Consent Form and the Questionnaire due to cognitive impairment, a proxy version of the questionnaire was given to a proxy for completion.
HD patients who were unable to visit the CING either due to the severity of their illness or due to personal reasons were asked to participate in a telephone interview by their doctors. Consent Forms were given to them upon visiting the CING for their routine appointment.
Assessment of Quality of Life
A generic QoL questionnaire, the EQ-5D, was used, which is a standardised instrument for use as a measure of health outcome and is applicable to a wide range of health conditions. The type of EQ-5D questionnaire that was used was the EQ-5D-3L, as this was the only version translated and validated in the Greek language. EQ-5D-3L consists of two sections; the EQ-5D descriptive system and the EQ VAS.
Scoring the EQ-5D Descriptive System
The first section in the questionnaire, the EQ-5D descriptive system, comprises 5 dimensions: mobility, self-care (intended to capture the ability of patients to, e.g. wash or dress their selves), usual activities (intended to capture the ability of patients to work, study, perform housework and engage in family or leisure activities), pain/discomfort and anxiety/depression (hereafter ‘’5D’’). Each dimension has three levels (hereafter ‘’3L’’), which are defined as: no problems (level 1), some problems (level 2), and severe problems (level 3). The respondent was asked to indicate his/her health state by ticking in the box against the most appropriate statement in each of the 5 dimensions. This decision resulted in a 1-digit number expressing the level selected for that dimension. It should be noted that only one response was accepted for each dimension.
A cumulative QoL score was constructed by adding up all the values of the EQ-5D Descriptive System state (mobility, self-care, usual activities, pain/ discomfort and anxiety/depression). The sumulative QoL score could range from 5 (no problems in any scale and thus a good QoL) to 15 (severe problems in all scales and thus a bad QoL).
Scoring the EQ VAS
The second section, the EQ VAS, uses a visual analogue scale to capture the respondent’s self-assessment of their health on a continuous scale, where the higher endpoint is labelled ‘best imaginable health state’ and the lower endpoint reflects the ‘worst imaginable health state’. This information was used as a self-rated quantitative measure of health.
Statistical Analysis
The statistical software programme STATA version 12 SE used to perform the required descriptive and inferential analysis.
The main characteristics of participants including demographic (gender, disease status and parent-of-origin) and clinical characteristics (current age, age at onset, age tested, years since onset and number of repeats of mutant HD allele) were first examined. In addition, the variables for each of the five dimensions of the EQ-5D Descriptive System were analysed, along with the cumulative QoL score and the EQ VAS score.
Univariate associations between the different demographic and clinical characteristics and the QoL measures were assessed using one-way ANOVA, Kruskal-Wallis, and Fisher’s exact tests depending on the nature of the variables examined.
Lastly, multivariate models were used to assess the combined effect of demographic and clinical characteristics on QoL outcomes. Given the ordered nature of the responses in each outcome of the EQ-5D Descriptive System, ordinal logistic regression was used. The cumulative QoL score and the EQ-VAS scores were categorized into 2 groups (above/below the median) and were analysed using logistic regression, because of their non-linear nature and the failure of several common transformations to normalize them. Because of collinearity between current age and years since onset (r=0.4305, p=0.005), only years since onset was included in the models to reflect disease duration. Keeping current age instead of years since onset, did not alter the results indicating that both variables equally well reflect disease duration. In addition, parental mode of inheritance and gender were not significantly associated with any outcome and were thus removed from the models to achieve a better fit. Lastly, because the majority of asymptomatic patients reported No Problems in all scales, the multivariate analyses were only performed on symptomatic patients (n=23).
Results
Demographic and Clinical Characteristics of Cypriot HD patients
All patients recruited met the inclusion criteria. However, two patients were unable to complete the questionnaire and a proxy version of the questionnaire was filled in by their spouses. Due to the likely heterogeneity between patient and carer perspectives, especially when patients are severely functionally impaired, these two patients were excluded from further analyses. Table 1 summarizes the demographic and clinical characteristics of the remaining 32 patients who took part in the study. The majority of the patients were women 62.5% (n=20), while men were 37.5% (n=12). The median age of the patients at the time of the study was 52.5 years.
Among these 32 patients, 72% were symptomatic HD patients, while the other 28% were asymptomatic HD patients. For the 23 symptomatic patients, the median age at onset was found to be 43 years, which was close to the median age of testing of 41.5 years. The majority of the patients, 64.5%, had inherited the HD gene maternally. Finally, of the total 32 patients that were genetically tested, the median number of the normal allele was 17 CAG repeats, whereas the median number of the mutant allele was 43 repeats.
Table 1. Baseline Patients’ Demographic and Clinical Characteristics of Cypriot HD patients
Quality of Life among Cypriot HD patients: The EQ-5D Descriptive System among Cypriot HD patients
The results of the EQ-5D Descriptive System, which was comprised of five dimensions each of which has three levels, are presented in Table 2.
Over 40% of the patients had mild problems with their motor function, while a lower percentage (25.00%) had experienced motor impairment (i.e. severe problems). Surprisingly, the vast majority patients (81.25%) were split equally between reporting no problems and severe problems with their self-care. However, the majority of patients (40.63%) had severe problems in performing their usual activities, which included work, study, housework, family or leisure-related activities. On the other hand, 93.75% had either reported some or no pain. Lastly, the majority of the HD patients (>70%), had experienced some anxiety or depression, with slightly more than 15% experiencing severe problems.
Table 2. Frequency Proportions for each score of the EQ-5D Descriptive System among Cypriot HD patients
Looking at the cumulative EQ-5D Quality of Life score, 50% of HD patients had a score below 9.5, and 25% of HD patients had a score above 12, which indicates a poor QoL.

Fig. 1: The EQ-VAS scores of Cypriot HD patients, a self-assessed health measure
Quality of Life among Cypriot HD patients: The EQ- VAS score among Cypriot HD patients
The EQ-VAS score indicated that contrary to what was expected, a large number of patients reported a perfect health status. On the contrary, one patient reported an EQ-VAS of lower than 10%. The median (IQR) was found to be 50 (60).
Determinants of Quality of Life among HD patients : Univariate analyses per scale outcome of the EQ-5D Descriptive System
Univariate associations between the different scales of the EQ-5D Descriptive System and different demographic (gender, current age, disease status and parent-of-origin) and clinical characteristics (age at onset, age tested, and number of repeats of mutant HD allele) are shown in Tables 3-7.
Only current age, age tested, and disease status were significantly associated with the mobility score (Table 3). The severity of problems was positively associated with age (p=0.0007) and age tested (0.0015). Also, as expected, asymptomatic patients all reported no problems with their mobility in contrast to symptomatic patients (p<0.0001).
Table 3. The association between the mobility Scale of the EQ-5D Descriptive System and different socio-demographic and clinical characteristics
Table 4. The association between the self-care Scale of the EQ-5D Descriptive System and different socio-demographic and clinical characteristics
Table 5. The association between the usual activities Scale of the EQ-5D Descriptive System and different socio-demographic and clinical characteristics
Similarly, current age and age tested were significantly associated with the self-care score (Table 4) and current age was also associated with the usual activities score (Table 5). The severity of problems was positively associated with current age (p for self-care=0.0002, p for usual activities=0.0054) and age tested (p for self-care=0.0015). Also, as expected, disease status was associated with self-care and usual activities scores (p for self-care<0.0001, p for usual activities<0.0001). Asymptomatic patients all reported no problems with self-care and all but 2 asymptomatic patients reported no problems with usual activities. Self-care score was also positively and significantly associated with number of repeats in HD allele (p=0.0201).
With respect to Pain/Discomfort and Anxiety/Depression, no demographic or clinical characteristic demonstrated significant associations (Tables 6-7).
Table 6. The association between the pain/discomfort Scale of the EQ-5D Descriptive System and different socio-demographic and clinical characteristics
Table 7. The association between the anxiety/depression Scale of the EQ-5D Descriptive System and different socio-demographic and clinical characteristics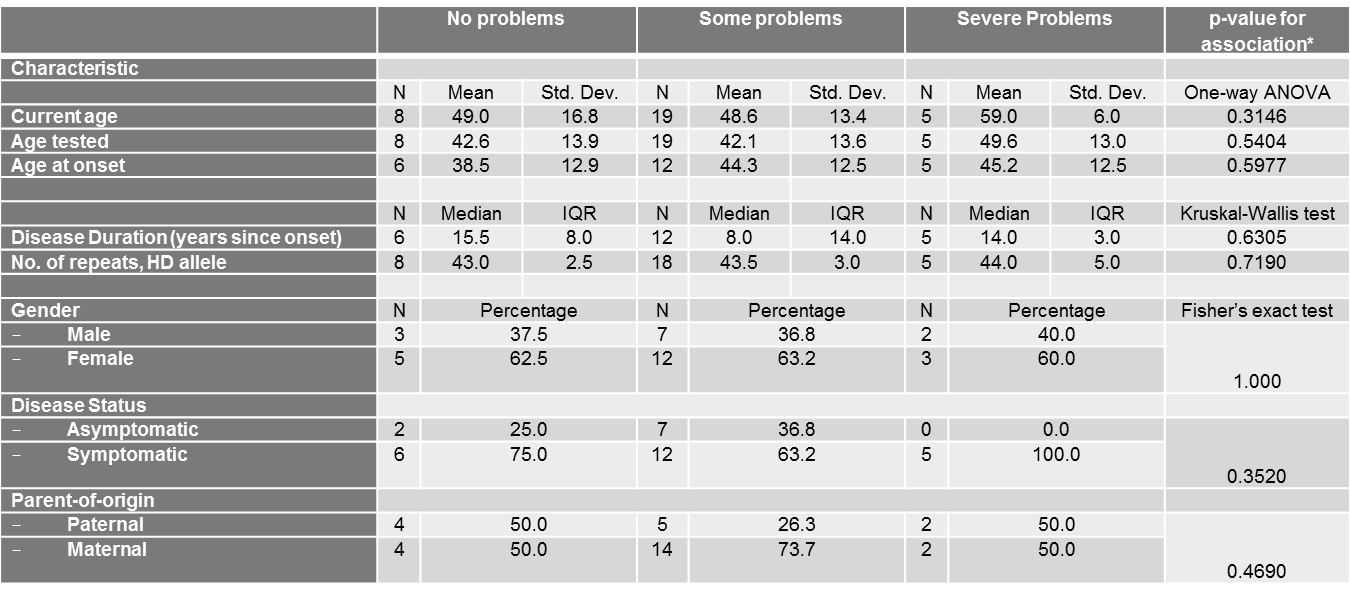
Determinants of Quality of Life among HD patients : Multivariate analyses per scale outcome of the EQ-5D Descriptive System
From multivariate analyses, it became evident that age of onset was independently and significantly associated with the self-care scale. For each year older a subject was at disease onset, they had 46% increased odds of reporting some or severe self-care problems compared to no problems. The significance of age at onset on the self-care scale may reflect the influence of current age since these two variables were highly collinear.
Disease duration was perhaps the most important determinant, since it was significantly associated with the mobility, self-care and usual activities scales. For each additional year of disease duration, patients were 19%, 33% and 22% more likely to report some or severe problems for the mobility, self-care and usual activities scales respectively. For these three scales, age tested did not retain the significance demonstrated in the univariate analyses probably due to the stronger effect of disease duration on the scales.
Similar to the univariate analyses, for Pain/Discomfort and Anxiety/Depression scales, no demographic or clinical characteristic demonstrated significant associations (Table 8).
Table 8. Multivariate analyses using ordinal logistic regression between demographic and clinical characteristics and each EQ-5D Descriptive System outcome
Determinants of Quality of Life among HD patients : Cumulative Quality of Life Score
Of the independent demographic and clinical characteristics examined, only current age and age tested were significantly associated with having a cumulative QoL index score above median. However, in the multivariate model, where current age was not retained, and contrary to what was expected from the multivariate analyses of the individual EQ-5D Descriptive System scales, only age at onset was statistically significantly associated with the cumulative QoL. More specifically, for each one-year increase in age at onset, a subject had 85% increased odds of reporting a QoL score above 9.5, which translates into worse quality of life.
Table 9. Univariate and multivariate analyses between demographic and clinical characteristics and the cumulative Quality of Life score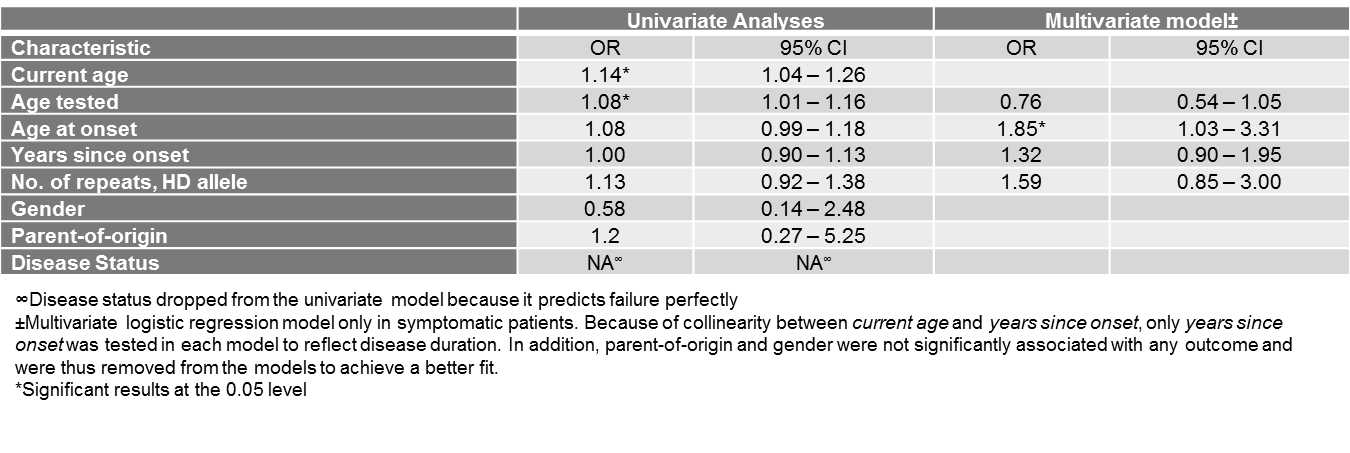
Determinants of Quality of Life among HD patients : The EQ-vas scale
In univariate analyses, current age and age tested were significantly and negatively associated with having an EQ-vas score above median. For each one-year increase in current age, each individual had 13% decreased odds of reporting an EQ-vas score above 50, demonstrating decreased self-assessment of their health. The respective percentage for each one-year increase in age tested was 9%. Most importantly, symptomatic disease status also decreased by 95% the odds of reporting an EQ-vas score above median. However, in the multivariate model in symptomatic patients, none of these characteristics retained their statistical significance. This might reflect that onset of disease might in fact have a greater impact on health status self-assessment than do mobility, self-care, and usual activity problems which are associated with age at onset and disease duration.
Table 10. Univariate and multivariate analyses between demographic and clinical characteristics and the EQ-vas score
Discussion
Overall Quality of Life
This analysis determined that over 40% of the Cypriot HD patients showed particularly severe impairment in their ‘self-care’ competence and their ability perform their ‘usual activities’ . These results are in agreement with the study of Helder et al. 200119, which using a different questionnaire on 77 Dutch patients, concluded that there was severe impact of HD on the ability of patients to carry out their usual activities.
Helder’s results also showed that a large percentage of the patients reported difficulty in maintaining productive employment due to deterioration in alertness faculties (e.g., forgetfulness, attentional and problem-solving deficits) and problems in the physical domain, which contributed to their inability to continue working. A significant percentage of patients also reported severe impairment in the categories of “home management” and “recreation and pastimes”. However in the study of Helder et al., there was a small percentage of patients reporting problems with their ability to eat (which can be considered as a proxy for self-care in the EQ-5D system), which is in contrast to the study of the Cypriot patients’ QoL. As in this study, other studies have shown that the impact of HD on the usual activities of patients and on their self-care abilities becomes more severe with progressive stages of the disease23.
In this study, the majority of the patients also reported moderate problems in their mobility status, as expected. HD belongs to the family of movement disorders 10 and in progressive stages is characterized by dystonia, rigidity and bradykinesia5. In fact, motor impairment is a profound symptom of HD patients. More specifically, it includes falls, gait and sleep disturbances24,25. These results are in agreement with several other studies assessing the motor impairment by questionnaire in HD patients, which concluded that motor symptoms are negatively associated with the QoL of HD patients 19,20,24.
However, in the above mentioned studies 192024 , the major factor implicated in the poor QoL of patients is the psychological factor. More specifically, these studies concluded that HD patients showed more severe impairment on the psychosocial domains than in the physical domains. In particularly, they assessed determinants such as ‘depressive mood’, ‘emotional behaviour’, ‘alertness behaviour’ and ‘psychosocial dimension’. This is in agreement with our study since a high percentage of the Cypriot patients (over 60%) reported moderate anxiety/depression status. This is an expected finding in the context of HD studies, since the behavioural alteration in HD patients is a common symptom11. Moreover, a study from McCabe et al. (2009)21, assessing the QoL of among three motor diseases (in particularly, AD, PD and HD), showed that HD patients experienced the greatest effects in their mood and QoL. Interestingly, even 77.8% of asymptomatic patients reported a moderate anxiety/depression status indicating the psychosocial burden of the disease even before its onset.
Furthermore, less than 6% of Cypriot patients reported severe ‘pain or discomfort’ problems, while approximately 45% patients reported moderate problems (Figure 4). Regarding pain effects, a study from Tomaaso et al. (2011)26, which evaluated pain perception in HD patients, concluded that pain is not a common symptom in HD. This is confirmed with other studies, were bodily pain was negatively related to the illness perceptions of HD patients27,28. This symptom is in contrast to other neurodegenerative diseases, such as PD29.
Regarding the extent of ‘discomfort’, it is important to mention that the word ‘discomfort’ has an ambiguous meaning in Greek. The direct translation of the word as presented in the questionnaire may have influenced the response of the participants because in the Greek language, the word points towards both physical and mental discomfort. This is in contrast to the English word, which reflects physical uneasiness. This can perhaps explain some of the variation in the percentages of patients selecting moderate and severe problems in this category. Since pain is not common symptom of the disease, and as per the Cypriot patients’ responses, the state ‘discomfort’ should be consider as both mental and physical20.
Assuming that, to the patients’ understanding, the word ‘discomfort’ indicates both mental and physical discomfort in Greek, this subsection further confirms that HD has an adverse effect on Cypriot patients’ psychosocial well-being. This result could be due to the fact that psychosocial well-being is not only determined by illness-related factors, such as motor or cognitive disabilities, but primarily by psychological concomitants of that illness, including the way in which patients cope with their disease.
The median Cumulative QoL was found to be 10 indicating moderate problems in all scales and thus a moderate QoL. This is in agreement with similar studies, conducted, however, using different questionnaires, which concluded that HD has a severe impact on patients’ physical and psychosocial well-being (i.e. depressive mood, anxiety), with the latter being more prominent19,20,24.
On the other hand, the EQ-vas score, which can be considered as an aggregate self-reported health status of the patients, ranged from average to poor (Figure 8). The EQ-vas score amongst Cypriot patients does not seem to follow a normal distribution, since a large number of patients reported a perfect health status. It is important to note that in this study, although there was proxy version of the questionnaire, which was given to patients’ relatives for completion in the case where patients had some cognitive impairment, there were also participants who answered the questionnaire and had some form of cognitive disability. This was confirmed by the patients’ doctors. It resulted in some patients, who were already in later stages of the disease, bound to a wheelchair, reporting a Health Status of 100%. This is possible because HD patients in progressive stages, who had experienced severe mobility impairment, are likely to experience cognitive impairment as well23. This has occurred because in our study we did not use a ‘mini mental stage examination’, which is commonly used in neurodegenerative studies, including HD30,31.
Determinants of Quality of Life – Demographic Determinants
Gender
Our sample was comprised of more women than men (Table 1), but this is unlikely to have significantly influenced the results, given what is known about HD and, in particular, also QoL gender comparison. Starting with the effect of gender examined in the study, we related it to the categories of the EQ-5D Descriptive System, Cumulative QoL and the EQ-vas scale, however, no association was found to be significant, as was expected from a study from Mahant et al. (2003)32, which evaluated the clinical correlation and the progression of the HD, and did not find any association between the rate of progression of the disease (thus, the poorest QoL) and the sex of the affected individual.
Current Age
Regarding the age of the patients, the association of age with mobility, self-care and usual activities status was positive and significant in univariate tests.
This is in agreement with the Ho and Hocaoglu (2011)23 study, which assessed the phases and the stages of HD from patients (ages between 30-89 years old), and found that as the stages of the disease progressed, the symptoms of the disease became more noticeable. In particular, in the last stage of the disease (older patients), the issues raised were physical or functional (i.e. difficulties with ambulation, swallowing, sleeping, speaking, writing and dressing). Generally, as the individual aged and the disease progressed, the symptoms of the disease became more evident and this has as an impact on Health Status and the QoL of the patient. This can be seen in our findings also, as the EQ-vas scale analysis and the Cumulative QoL score analysis showed significant associations between the current age of the patients, indicating that both QoL and overall health status deteriorates with age.
There was no association between the current age of the patients and the presence of psychological problems. This indicates that psychological issues in HD are independent from the age of the patient. This also has an intuitive explanation, as even in pre-symptomatic stages (i.e. patients who are younger than 40 years old, excluding juvenile cases) patients can feel stress for the extent of the detrimental effects of the disease33.
However, multivariate models suggested that current age might not be an independent predictor of QoL but its effect on QoL might instead be a reflection of disease duration, as discussed further down.
Disease status (symptomatic and asymptomatic)
The study determined that there was a significant statistical association between most categories of the EQ-5D Descriptive System and disease status. However, for ‘pain/discomfort’ and ‘anxiety/depression’, the difference in status between symptomatic and asymptomatic patients was not significant.
As discussed above, it is possible that Cypriot patients perceived the word ‘discomfort’ to point to both mental and physical discomfort, therefore the result shows that even asymptomatic gene carriers had a psychological alteration, although they had not yet experienced any symptoms of the disease. Generally, pre-symptomatic HD patients participating in other HD studies had psychosocial QoL issues relevant to this subgroup as well, whereas physical, functional and cognitive issues hardly featured in HD gene carriers33,34.
Overall, in the EQ-vas scale and the Cumulative QoL score, asymptomatic patients reported better QoL and better Health Status, respectively, in contrast to symptomatic patients, and the differences in these scores was statistically significant.
Parent-of-origin (paternal and maternal)
The sample of the study comprised of more patients who had inherited HD maternally, rather than paternally. However, the parent-of-origin was not found to be a statistically significant factor in determining the extent of the problems considered in the EQ-5D descriptive system. We are not aware of any studies considering the association of the parent-of-origin transmission and the QoL of HD patients. From our results, one can postulate that the parent-of-origin is not associated with the QoL of the patients, but further research on a larger sample size of HD patients is required, in order to confirm this finding.
Age at onset and Age tested
Age at onset was another determinant considered, and the results show that of the patients reporting severe problems in the 5 EQ-5D Descriptive System categories, the majority had an age at onset above 40 years old. The same trend was evident for patients reporting a cumulative QoL above median. However, statistical associations between age at onset and the determinants of the EQ-5D Descriptive System (with the exception of self-care) and the EQ-vas scale were not found to be significant in multivariate analyses.
Interestingly, patients who had reported severe problems in the majority of the EQ-5D Descriptive, were younger at onset than patients who had reported moderate problems, reflecting the association between number of repeats of the mutant allele, earlier age at onset and worse disease progression. Therefore, the unexpected positive association between age of onset and reporting moderate or severe problems in the 5 EQ-5D Descriptive System categories or reporting a higher cumulative QoL is most likely driven by the larger number of patients with a higher age-of-onset that reported “Some Problems”.
In contrast to age at onset, age tested was a significant determinant of mobility and self-care scale scores. However, similar to the results considering the age at onset of the disease, patients reporting severe problems in the mobility, self- care and usual activities status of the EQ-5D Descriptive System were generally over 40 years old and patients tested between the ages of 40-48 years old, reported severe problems, whereas patients tested when they were over 49 old years reported moderate problems, a difference which was statistically significant. These results are in agreement with another large study, which found that the rate of HD progression was more rapid with younger age at onset, in particular with issues such as motor impairment (dystonia) and the rate of cognitive and functional progression32.
When both variables were entered in multivariate regression models, age tested did not retain its significance, and instead, age at onset was positively and significantly associated with self-care problems compared to no problems. This indicates that of the two ages, age at onset is most influential in determining quality of life.
Disease Duration (years since onset)
Years since onset was used in univariate and multivariate analyses as an indication of disease duration. Even though disease duration was not significantly independently associated with the five EQ-5D scales, in multivariate analyses in symptomatic patients, correcting for age at onset and age tested, disease duration was significantly and positively associated with worsening problems in mobility, self-care and usual activities. This makes disease duration perhaps the most influential predictor of QoL, after accounting for all other demographic and clinical characteristics. This was also evident in multivariate analyses on the cumulative QoL where years since onset was the only significant predictor.
In related research, patients with either juvenile onset of disease or late onset of symptoms had significantly shorter disease duration than those who had onset in mid-life (onset 20-49). The course of HD is probably shorter in the older onset of HD, due to other unrelated conditions which can shorten life expectancy35. These findings might explain why disease duration was significantly associated with QoL only after adjusting for age at onset.
Surprisingly, the impact of disease-duration was not evident in multivariate analyses on the cumulative QoL where, instead, age at onset was the only significant predictor. Larger subject numbers are needed to delineate the interaction between age of onset and disease duration on the QoL and fully explain these findings.
Number of repeats in HD allele
For patients who reported severe problems, the number of repeats in their mutant HD allele usually exceeded 45 repetitions. More specifically, the correlation between the number of repeats and the severity of issues in mobility, the self-care and pain or discomfort status was positive, despite being non-significant with the exception of the self-care scale.
These results are in agreement with a larger related study considering the association of the number of CAG repeats and the clinical progression of more than 500 HD patients31. The result in that study was that the number of repeats was a small but significant predictor of progression rates of HD (measured using neurological signs, motor impairment, cognition and daily function).
Strengths and Limitations
This study assessed, for the first time, the QoL of HD patients in Cyprus and aimed to identify some of the major factors affecting QoL. This study can be regarded as the first step in an approach to improving living conditions among these patients, with informed and targeted health promotion programmes. The study invited all alive patients with Huntington’s disease who were physically and cognitively able to consent to and participate in the study. In addition, all demographic and clinical characteristics were extracted from patient files, instead of obtained through self-report, minimizing information bias.
Despite the strengths of the study described above, it also had some limitations. First, the sample size of the study was too small. Of the Cypriot registered HD patients, only the 42.6 % took part, while the remaining 57.4% did not participate for several reasons. Some were either too severely disabled to come to CING or be contacted for completion of the questionnaire, or because their treating physicians suggested that particular patients had refused contact from CING previously. Not considering these patients is a limitation, because the study may not be capturing the true extent of the issues considered for HD patients, since the most severely affected patients were not part of the study. This is particularly true following the exclusion of the small number of carer/proxy reports for the cognitively impaired, advanced-stage HD patients. Of the other patients, some were unable to attend, due to personal reasons, such as professional obligations or because they were living in a ward.
Secondly, some patients had reported overly positive health states, which may have been related to some mental impairment. A mini mental state of examination was required since it is a reliable method to assess the cognitive disability of the patients and is commonly uses in neurological studies, including HD30,31.
Finally, the Greek translation of the questionnaire may not have been the most accurate in carrying across the meaning of some words. For example, the word ‘discomfort’ in Greek points not only to the physical domain (such pain), but also to the mental domain. This was confusing for the Cypriot patients.
Future work
A first extension of this work would be to further the investigation in order to assess the QoL of the remaining Cypriot patients, who did not have the opportunity or the capacity to take part. Obtaining evidence from the entire Cypriot patient population is important so that we can characterise definitively the aspects affecting QoL. Further work in HD would necessarily include a short mental test prior to the completion of questionnaires, to determine whether the patient can accurately self-assess their physical mental state.
In addition, the study used a generic questionnaire assessing the QoL of HD patients. Once the HD specific questionnaire is approved and a Greek translation is available, it would be useful to see how the new questionnaire could add to the pool of evidence regarding HD. HD is a multi-faceted disease, and the additional considerations of an HD-specific questionnaire will be useful in this aspect.
Conclusions
The study assessed, for the first time, the QoL of HD patients in Cyprus and demonstrated that QoL in the Cypriot HD patient population was moderately to severely affected by the disease. The disease was most frequently found to affect the ability of Cypriot patients to carry out their usual, day-to-day activities and to care for themselves. The psychological state was found to play a crucial role in the QoL of HD patients, since the majority of the patients, including pre-symptomatic ones, reported moderate anxiety and depression. In terms of the physical domain, a large number of HD patients reported moderate problems in their mobility status. The study did not identify pain as being a symptom in the tested population, although discomfort was prevalent. The overall Health Status of the patients was defined as average to poor, whereas the Cumulative QoL score indicated moderate issues with QoL. Disease duration was evidenced as perhaps the most important determinant of QoL, after accounting for all relevant demographic and clinical characteristics, including disease status.
The results of this study could potentially be utilized for improving the quality of management of HD in Cyprus, in both symptomatic and asymptomatic patients. They can be utilized by clinics and patient support groups in order to better support, empower and care for HD patients and their families.
Data Availability Statement
The authors provide detailed data regarding quality of life responses in Tables 3-7. All statistics were derived from information in these tables. Unfortunately, more detailed information and specific subject characteristics cannot be made publicly available due to ethical restrictions from the Cyprus National Bioethics Committee. For further information regarding data availability please contact [email protected].
Competing Interests
The authors have no financial or non-financial competing interests to declare.
Corresponding Authors
Eleni Zamba-Papanicolaou ([email protected]) and Christiana A. Demetriou ([email protected])
Methods: We investigated whether anthocyanin antioxidants added daily to the drinking water could affect CAG repeat instability in several organs and behaviour in R6/1 HD mice. In addition, anthocyanin-treated and untreated R6/1 HD mice at 22 weeks of age were tested in the open field test and on the rotarod.
Results: Anthocyanin-treated R6/1 HD mice showed reduced instability index in the ears and in the cortex compared to untreated R6/1 mice, and no difference in liver and kidney. There were no significant differences in any of the parameters tested in the behavioural tests among anthocyanin-treated and untreated R6/1 HD mice.
Conclusions: Our results indicate that continuous anthocyanin-treatment may have modest effects on CAG repeat instability in the ears and the cortex of R6/1 mice. More studies are required to investigate if anthocyanin-treatment could affect behaviour earlier in the disease course.
]]>Introduction
Huntington’s disease (HD) is a progressive neurodegenerative disorder caused by a CAG expansion in exon 1 of the Huntingtin (HTT) gene encoding the polyglutamine protein HTT 1. There is an inverse relationship between CAG repeat length and age of onset 2. Mouse Htt is ubiquitously expressed and the function of the normal protein is still under extensive investigation, although it is known to interact with trafficking motors and clathrin-interacting protein 3. A selective pattern of neuropathology exist in HD, with loss of neurons that is most severe in the caudate and putamen 1. However, the mechanisms underlying this selective neurodegeneration remain poorly understood. Somatic CAG length expansion is correlated with neuropathology and probably precedes the onset of symptoms 4. The R6/1 transgenic mouse is a widely used HD model containing the human HTT N-terminal fragment containing exon 1 with expanded CAG repeats 5. We have recently shown that the striatum and the cortex in R6/1 mice display a dramatic and periodic expansion that is mechanistically different from the slow expansion observed in most other somatic tissues 6. Stoichiometries of base excision repair (BER) proteins correlates with the degree of somatic instability seen in the striatum and cerebellum of HD transgenic mice 7. Similarly, age-dependent CAG repeat expansion are reduced in R6/1 mice lacking the BER enzyme 7,8-dihydroxy-8-oxoguanine (8-oxoG)-DNA glycosylase (Ogg1) 8. Also, the BER DNA glycosylase Nei-like 1 (Neil1) has recently been shown to be a genetic modifier of both somatic and germline CAG repeat instability in R6/1 mice 9. Deletion of the mismatch repair proteins Msh2 and Msh3 has been shown to abolish somatic expansion in several HD mouse models 10,11,12. Recently, the mismatch repair genes Mlh1 and Mlh3 have also been shown to modify CAG instability in HD mice 13.
It has been proposed that oxidative damage plays a role in the progression of several neurodegenerative diseases 14. Reactive oxygen species are generated as by-products of mitochondrially catalysed reactions of the electron transport chain or cellular inflammation. Mice with expanded polyglutamine have shown Htt on neuronal mitochondrial membranes 15 with elevated levels of 7,8-dihydroxy-8-oxoguanine and lipid peroxidation 16, and mitochondrial dysfunction 17. It has been shown that the presence of aggregated mutant Htt fragments directly causes free radical production 18.
Several anthocyanins and their aglycones have shown strong antioxidant activity 14,19. Anthocyans are flavonols, which occur ubiquitously in the plant kingdom and confer bright red or blue colouration on berries and other fruits and vegetables. Blackcurrant (Ribes nigrum) and bilberry (Vaccinium myrtillus) – which is very similar to blueberry (Vaccinium corymbosum) – are rich in several anthocyanins. Anthocyanins can be metabolised in the intestine and enter the bloodstream to peripheral tissues (reviewed by 20,21). Anthocyanins from dietary blueberry has been detected in several brain regions, including cerebellum, cortex, hippocampus and striatum of rats 22,23, and cerebellum, cortex, midbrain and diencephalon in pigs 24. Blueberry anthocyanins have been shown to enhance cognitive and motor behaviour in aged rodents 22,23,25,26,27,28,29. Wild blueberry juice also improved paired associate learning and word list recall in older human adults with early memory changes 30. Blueberry extract also reduced oxidative DNA damage in mouse brain tissue in vitro as evaluated by the comet assay 26.
At present, there are no curative therapies available for HD. R6/1 HD mice have reduced motor coordination and cognitive deficits 31,32,33.Several antioxidants have been tested on animal models of HD, for instance a combination of coenzyme Q10 and remicade hydrochloride 34, alpha-lipoic acid 35, BN82451 36, resveratrol 37, fisetin 38, and N-Acetylcysteine 39, and have shown varying effects on survival, weight loss and rotarod performance.
We investigated whether anthocyanin antioxidants could reduce CAG repeat expansion and improve behavioural performance in the R6/1 mice. R6/1 HD mice were given Medox®, containing a combination of anthocyanins derived from bilberry and blackcurrant, in their drinking water from 4 weeks of age until they were sacrificed at 22 weeks of age. Several organs including male gonads and brain tissues were harvested to examine whether anthocyanins could reduce CAG repeat expansion in R6/1 mice. Before termination of the experiment, the exploratory behaviour of the mice was investigated in the open field, and balance and coordination was tested on an accelerating rod (rotarod test).
Results
The effect of anthocyanins on body weight of R6/1 HD mice
All mice were weighed regularly to check their health throughout the experiment. The growth curves for female and male anthocyanin-treated and untreated R6/1 HD mice are shown in Fig. 1. The growth rate of female and male R6/1 HD mice is indistinguishable between anthocyanin-treated and untreated mice up to 10 weeks of age.
The R6/1 HD mice were grouped by gender and shown with Loess smoothed curves and a 95% confidence interval for each smoothing (shaded bands around lines). Each mouse was weighted 5-6 times. Untreated R6/1 HD control mice n = 20, 11 males and 9 females; anthocyanin-treated R6/1 HD mice n = 23, 15 males and 8 females.. Untreated R6/1 HD mice n = 20, 11 males and 9 females; anthocyanin-treated R6/1 HD mice n = 23, 15 males and 8 females.")
Fig. 1: Growth curves for anthocyanin-treated and untreated R6/1 HD mice.
Female R6/1 HD mice continue to gain weight throughout the experiment regardless of treatment. However, the growth curves for anthocyanin-treated and untreated R6/1 HD female mice diverge at around 20 weeks of age. As indicated by the 95 % confidence interval around the growth curves in Fig. 1A, anthocyanin-treated female R6/1 HD mice gained significantly less weight than female R6/1 HD untreated mice after this point.
For anthocyanin-treated and untreated R6/1 HD male mice the growth curves begin to diverge at around 11 weeks of age. As indicated by the 95 % confidence interval around the growth curves in Fig. 1B, anthocyanin-treated R6/1 HD male mice were significantly lighter than untreated R6/1 HD male mice up to 21 weeks of age. Notice that both treated and untreated male R6/1 HD mice lost weight from about 14 weeks of age, which is a genotype effect 34,39,40. It appeared that the anthocyanin-treated male R6/1 HD mice maintained their body weight better than untreated R6/1 male mice from about 16 to 22 weeks of age. In contrast, no weight loss was observed in anthocyanin-treated and untreated R6/1 HD female mice.
CAG repeat expansion in R6/1 mice
CAG repeat expansion has been shown to be reduced in mice lacking glycosylases that excise oxidative lesions from DNA, such as Ogg1 8 and Neil1 9. Accordingly, we hypothesized that treatment with anthocyanin antioxidants would reduce the number of oxidative lesions that are repaired by these glycosylases, thereby leading to reduced repeat expansion. We investigated whether treatment with anthocyanin antioxidants could reduce CAG repeat expansion in R6/1 mice. A biopsy from the ear was taken from each mouse at 3 weeks of age and used as a reference value for the number of CAG repeats present at this time point. At birth the repeat length in tail and liver are identical 41. Somatic expansion becomes apparent in some organs at six weeks of age (Supplementary Fig. S1). Samples from several organs of R6/1 HD mice were obtained at 22 weeks of age, including ear, kidney, liver, olfactory bulb, cortex, striatum, testis and sperm. The isolated DNA from these samples was analysed for CAG repeat length. Representative examples of GeneMapper raw data from all organs of one anthocyanin-treated and one untreated R6/1 HD mouse at 22 weeks of age are shown in Supplementary Fig. S2. The average CAG repeat lengths in the analysed organs from anthocyanin-treated and untreated R6/1 mice are shown in Supplementary Fig. S3.
A method to parameterize tissue-specific repeat instability has been published by Lee et al. 42. We applied a similar approach to determine the instability index (see Methods). In short, the magnitude of the peak heights included in the fragment analysis need to be normalized to one, multiplied by the distance to the main allele, and then summed to obtain the instability index. The calculated normalized peaks for each organ of anthocyanin-treated and untreated R6/1 HD mice are displayed in Supplementary Fig. S4.
Anthocyanin-treated R6/1 mice had reduced instability index in ear (P < 0.01) and cortex (P < 0.01) compared to untreated R6/1 mice (Fig. 2).
The instability index calculated in several organs of anthocyanin-treated and untreated R6/1 mice. In order to measure the instability index, the magnitude of the peak heights included in the fragment analysis need to be normalized to one to the peak height of the main allele, multiplied by the distance to the main allele, and then summed (see also Methods, Supplementary Fig. S4 and 42). Untreated R6/1 HD control mice n = 19, 10 males and 9 females; anthocyanin-treated R6/1 HD mice n = 23, 15 males and 8 females; data shown as means ± S.E.M.). * P < 0.05; ** P < 0.01; *** P < 0.001; two-tailed unpaired t-test.
Fig. 2: CAG repeat expansion measured by the instability index.
In striatum and olfactory bulb the P-values for the instability index were 0.07 for both. The negative instability index numbers measured in testis indicated CAG repeat contraction, which was not different between anthocyanin-treated and untreated mice (P = 0.25). No differences in instability index were detected in sperm (P = 0.18), kidney (P = 0.47) and liver (P = 0.55).
Effects of anthocyanins on R6/1 mice in the open field test
Spontaneous locomotor activity, as a general measure of motor function and emotional state, was measured in the open field test 43. The measures of primary interest in the open field were the total distance travelled, the entries into, and the percent time spent in the centre square (20 x 20 cm) of the arena.
A two-way analysis of variance (ANOVA) showed no statistically significant difference between anthocyanin-treated and untreated R6/1 HD mice at 22 weeks of age on the total distance travelled during the whole 45 minutes of the test (P = 0.570; Fig. 3A and 3B).
The 22-week old anthocyanin-treated and untreated R6/1 HD mice were placed in an open arena of 40 x 40 cm and their movement were recorded for 45 minutes from a video camera placed above. A) and B) The total distance travelled showed no significant main effect of anthocyanin treatment. C ) Percent time in the centre square (20 x 20 cm) of the open field arena during the whole 45 minutes test and D ) during the first 5 minutes of the test. Untreated R6/1 HD mice n = 20, 11 males and 9 females; anthocyanin-treated R6/1 HD mice n = 23, 15 males and 8 females; two way ANOVA; data shown as means ± S.E.M.
Fig. 3: The open field test of activity, locomotion and anxiety-like behaviour.
Irrespective of treatment, the female R6/1 HD mice travelled significantly further than male R6/1 HD mice (P = 0.004, two-way ANOVA; data not shown). There was no significant interaction between treatment and sex (P = 0.776, two-way ANOVA; data not shown). During the time course of 45 minutes, anthocyanin-treated R6/1 HD mice appeared to spend less time in the centre compared to untreated R6/1 HD mice (Fig. 3C).
As an index of anxiety-like behaviour, we analysed time spent in the central square of the arena during the first 5 minutes of the observation period. During the first five minutes of the test, there was no statistically significant difference in the time spent in the centre between anthocyanin-treated and untreated R6/1 HD mice at 22 weeks of age (Fig. 3D; P = 0.430; two-way ANOVA), indicating no effects of anthocyanins on anxiety-like behaviour. There were no significant sex differences or interactions on the time spent in the centre (two-way ANOVA; data not shown).
In addition, we analysed a subset of 20-week old R6/1 wild-type (WT) mice and compared them to HD siblings in the open field test (Supplementary Fig. S5). The HD mice used here were not the same as the untreated HD mice in Fig. 3. No statistically significant differences were detected between genotypes in the total distance travelled or in anxiety-like behaviour (Supplementary Fig. S5D). During the whole 45 minutes test, R6/1 HD mice appeared to spend more time in the centre compared to R6/1 WT mice, particularly later in the time course (Fig. S5).
The effect of anthocyanin treatment on the latency to fall in the rotarod test
Motor coordination and balance performance was measured on an accelerating rotarod 44. A two-way repeated measures ANOVA showed no significant main effect of sex on the latency to fall from the accelerating rotating drum (P = 0.469). Using aggregated data from both sexes, the latency to fall was close to significance for anthocyanin-treatment, (Fig. 4; P = 0.0525). Furthermore, there were no significant interactions between any of the variables.
The latency to fall from a rotating drum was repeatedly measured in the accelerating rotarod test of balance and coordination. There was a tendency towards improved latency to fall from the rotating drum after anthocyanin treatment at 22 weeks of age (P = 0.0525, two-way repeated measures ANOVA). Untreated R6/1 HD mice n = 20, 11 males and 9 females; anthocyanin-treated R6/1 HD mice n = 23, 15 males and 8 females; data shown as means ± S.E.M.).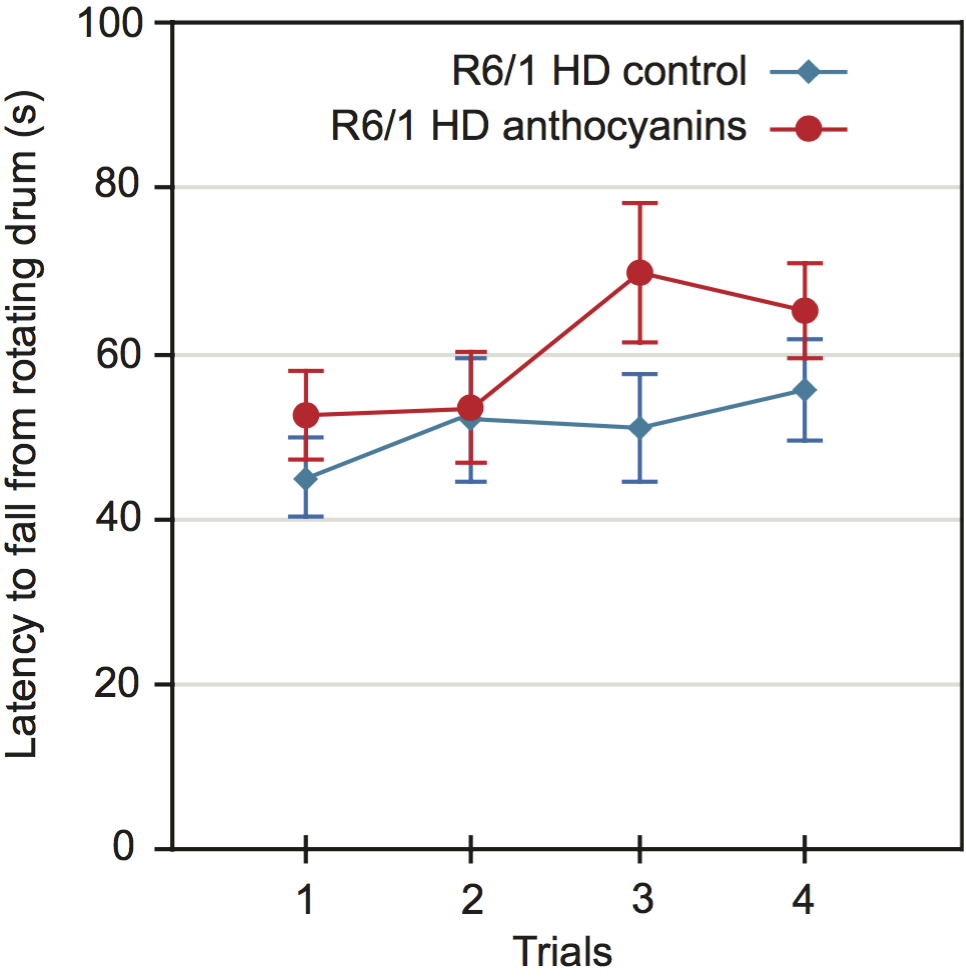
Fig. 4: Motor coordination of 22 weeks old anthocyanin-treated and untreated R6/1 HD mice on the rotarod test.
Since anthocyanin-treatment appeared to affect the weight of the mice, we decided to include weight as a parameter in our ANOVA test. Lighter mice performed significantly better than heavier mice on the rotarod (P = 0.0023).
Since mouse weight affected rotarod performance, we correlated mouse weight with the average latency to fall for each mouse individually (Supplementary Fig. S6). There was a negative correlation between weight and rotarod performance, and no significant effect of anthocyanin treatment. There were no gender differences.
Discussion
Effects of anthocyanins on body weight
The growth rate up to about 10 weeks of age was not affected by anthocyanins in either female or male R6/1 HD mice. The growth curve in R6/1 HD female mice in our study was not affected by anthocyanin-treatment until 20 weeks of age. Another study has shown that R6/1 HD female mice reached a maximum body weight at 22 weeks of age and then showed a decline 45. Therefore, it is likely that we terminated the experiment when the R6/1 HD female mice reached their maximum body weight.
From about 11 weeks of age, the growth rate of anthocyanin-treated male R6/1 HD mice was significantly reduced compared to untreated male R6/1 HD mice (Fig. 1B). Male C57BL/6J mice on a high fat diet, given purified anthocyanins from blueberry, have been shown to have lower body weight gains and body fat than controls 46. Anthocyanin consumption has also been shown to lower epididymal fat, blood glucose and cholesterol in rats 47. These data by others may explain why the anthocyanin-treated R6/1 HD mice had less maximal adult body weight compared to untreated R6/1 HD mice.
From about 14 weeks of age, we observed weight loss among male R6/1 HD mice. Male HD R6/1 and HD-N171-82Q transgenic mice show weight loss from about 12-14 weeks of age compared to WT, which is a genotype effect 34,39,40. The weight loss appeared to be more rapid in untreated male R6/1 HD mice (Fig 1B). Likewise, HD-N171-82Q transgenic mice given a combination of coenzyme Q10 and remicade hydrochloride dietary supplements maintained body-weights better than mice on standard diet 34. On the other hand, treatment with essential fatty acids, resveratrol, or N-acetylcysteine did not ameliorate weight loss in HD transgenic mice 37,39.
CAG repeat expansion
The instability index was reduced in ear and cortex of anthocyanin-treated compared to untreated R6/1 HD mice. When checking for multiple testing with Bonferroni correction (different tissues, n=8), all differences became non-significant, although CAG expansion in different tissues may not be considered as independent tests.
In R6/1 mice, we have previously demonstrated periodic expansions in striatum and cortex brain tissues, and continuous expansion in tail 6. Since large and periodic expansions were observed in both anthocyanin-treated and untreated mice (Supplementary Fig. S7), it seems that anthocyanins have a negligible effect on these types of expansion in brain. However, the continuous expansion in ear was significantly inhibited by anthocyanins, indicating that anthocyanin treatment may reduce expansion in other cell types that display continuous expansion.
One study has shown that the HTT transgene in R6/1 has two CAG repeat tracts 48, which could be relevant for repeat instability analysis. However, the presence of two CAG repeat tracts does not fit with the original analysis 5 and has not been reported elsewhere.
When calculating the instability index, we used the highest peak in the fragment analysis of the ear sample at three weeks of age as the main allele, while Lee et al. 42 apparently used the highest peak of the tail sample at 5 months of age. Although repeat expansion in the tail is considered to be insignificant, we have shown that the CAG repeat length expands with approximately 2 repeats during an 18-week period 6. A main allele from samples taken at five months of age might therefore give a higher starting point when calculating the instability index, leading to false contractions.
Small pool PCR has previously been used to measure repeat instability. GeneMapper traces and instability indices from bulk DNA and frequency distributions of CAG repeat lengths obtained from small pool PCR are highly correlated 42. Although the bulk DNA method may not detect rare large expansion, it gives a good estimate of overall instability.
Overall, anthocyanin-treatment did not affect repeat expansion in R6/1 mice considerably, which indicates that either the antioxidant properties of anthocyanins are insufficient to affect oxidative damage levels and expansion to a major extent, or that other factors than oxidative damage regulate the main expansion processes. The anthocyanin dose used in this study was high. Unfortunately, we were unable to measure the levels of anthocyanins in target tissues. However, anthocyanins have been detected in several brain regions in rats 22,23 and pigs 24 after ingestion of dietary blueberry, demonstrating that anthocyanins penetrate the blood-brain barrier.
CAG repeat instability in male gonads
We did not demonstrate any significant effects of anthocyanin-treatment on repeat instability in male gonads of R6/1 mice. The instability index in testis was negative for both treatment groups, indicating CAG repeat contraction compared to the 3-week ear reference. We cannot exclude that CAG repeats slightly expanded from 0 to 3 weeks in the ear. In Supplementary Fig. S3 we have shown that the average CAG repeat length in ear expanded 2.6 repeats from 3 to 22 weeks of age in untreated R6/1 HD mice, giving an estimate of 0.137 repeats per week. This indicates a maximum of 0.41 repeat increases from birth to three weeks of age in the ear if the expansion rate is constant. Kovtun et al. showed that expansions occurred when spermatids developed into spermatozoa 49, which correlates with our finding that the average CAG repeat length in sperm were longer than in testis from untreated R6/1 mice. However, in humans, expansions have also been reported in pre-meiotic and meiotic cells in testis 50. It is well documented that the repeat length may increase from father to child probably because of large instability in the human sperm 51,52,53.
Behavioural studies
Anthocyanin-treatment did not affect the total distance travelled in R6/1 HD mice. Similarly, there were no significant differences in the total distance travelled among R6/1 WT and HD mice. However, treatment with vaccinium berries has been shown to increase the number of crossings in the open field habituation in adult rats 28 and mice 26.
There were no statistically significant differences between anthocyanin-treated and untreated R6/1 HD mice in the time spent in the centre during the first five minutes of the open field test, indicating no effects of anthocyanins on anxiety-like behaviour in R6/1 HD mice at 22 weeks of age. Likewise, among HD and WT R6/1 mice at 20 weeks of age, no differences in anxiety-like behaviour were observed. R6/1 mice at 12 weeks were also unaltered in anxiety levels 33. In contrast, mice and rat models of HD have previously been shown to spend more time in the open area compared to WT in the elevated plus-maze test, indicating reduced anxiety 54,55.
Later in the time course of the open field test, it appeared that anthocyanin-treated HD mice spent less time in the centre compared to untreated HD mice. R6/1 HD also appeared to spend more time in the centre late in the time course, compared to R6/1 WT mice. This might reflect a cognitive deficit, that the HD mice no longer realize that the centre is a more “dangerous place”. Indeed, R6/1 HD mice show a deficit in short-term spatial memory on the T-maze compared to R6/1 WT mice at 12 weeks of age 33.
HD transgenic mice and rats display a progressive motor deficit on the rotarod 40,55,56,57. The latency to fall in anthocyanin-treated R6/1 HD mice at 22 weeks of age was close to statistical significance. Since body weight affected rotarod performance, we correlated body weight with the latency to fall, and found no difference in treatment. Others have shown that antioxidant treatment improved rotarod performance in HD transgenic mice to some extent 34,36,38,39,57. After testing rotarod performance longitudinally, environmental enrichment delayed the latency to fall in R6/1 HD mice 58. Anthocyanin treatment could have affected rotarod performance earlier in the disease course, but we have no data to confirm this hypothesis.
One study found a beneficial effect on age-related decline in rotarod performance in 19-month old rats given blueberry supplementation 29. We did not test anthocyanin-treatment in R6/1 WT animals and cannot rule out that anthocyanins may affect behaviour in WT mice.
There were more males than females in the R6/1 HD treatment groups. If there are gender differences this could influence the studies. However, the distribution of males and females between each treatment groups were similar. In addition, we did not observe any gender differences within the same treatment group, with the exception of females travelling further in the open field than males, which was not affected by treatment.
Conclusion
In conclusion, the instability index was reduced in the ear and the cortex of anthocyanin-treated compared to untreated R6/1 mice. The time spent in the centre square zone during the first five minutes of the open field test was neither significantly different between anthocyanin-treated and untreated R6/1 HD mice, nor between R6/1 HD and R6/1 WT mice. These results indicate no effects on anxiety-like behaviour. During the open field time course of 45 minutes R6/1 HD mice appeared to have cognitive deficits. Anthocyanin treatment may improve this deficit in R6/1 HD mice, although further studies are required to confirm this. Mouse weight affected the latency to fall in the rotarod test. Longitudinally behavioural studies could clarify whether anthocyanins have an effect on the behaviour of R6/1 HD mice earlier in the disease course. More studies of HD mice are warranted to investigate if anthocyanins can delay the onset and progression of HD symptoms.
Methods
Ethics statement
All experimental procedures were approved by the section for comparative medicine at Oslo University Hospital and the Norwegian animal research authority, and complied with national laws, institutional regulations and EU Directive 86/609/EEC governing the use of animals in research.
Anthocyanin content in Medox® capsules
The anthocyanins were obtained from opened Medox® capsules (MedPalett Pharmaceuticals AS, No) and consisted of purified anthocyanins isolated from bilberries (Vaccinium myrtillus) and blackcurrant (Ribes nigrum). The powder consists of a mixture of 3-O-rutinosides of cyanidin and delphinidin, and 3-O-β-galactosides, 3-O-β-glucosides, 3-O-β-arabinosides of cyanidin, peonidin, delphinidin, petunidin, and malvidin. The 3-O-β-glucosides of cyanidin and delphinidin constituted about 40-50% of the total anthocyanins.
Animals and treatment with anthocyanins
Two male B6CBA-Tg(HDexon1)61pb/J mice of the R6/1 line 5 from the same litter with ~115 CAG repeats in exon 1 of the human HTT gene were crossed with C57BL/6 female mice, and the offspring carrying the human HTT fragment were divided into two groups; the anthocyanin-treated group (23 mice) and the control group (20 mice). The female to male ratio was 9:11 for the control group, and 8:15 for the treatment group. The anthocyanin-treated group was given Medox® stirred in filtered tap water (1,6 g/L), freshly made every day and given from the age of 3-4 weeks. The control group received only plain filtered tap water. The R6/1 mice were weighed regularly and intake of drinking water was measured, giving an estimate of daily anthocyanin intake of approximately 300 mg/kg bodyweight/day. There were no significant differences in water intake between the groups (data not shown). The R6/1 mice were housed in transparent polycarbonate cages with controlled temperature and humidity, and fed Rat and Mouse No.1 maintenance diet (Special Diet Services) and drinking water ad libitum. R6/1 WT and HD mice were subjected to behavioural tests at 20 or 22 weeks of age, respectively. Testing was conducted during the light phase (0600-1800 h) of the light/dark cycle. The R6/1 mice were brought to the laboratory at least 30 minutes before testing, and the open field test was performed the day before the rotarod test.
Tissues, genotyping and sizing of CAG repeats
At 3 weeks of age an ear biopsy was taken from each mouse for genotyping and to measure the number of CAG repeats present at this age. At 22 weeks of age the mice were sacrificed by cervical dislocation, the organs were harvested, frozen on dry ice and stored at −70°C. Sperm was collected by excising the epididymis from the testis, then squeezed out and washed two times in PBS by centrifugation at 400g for 3 min. DNA from all tissues was isolated according to the DNeasy® Blood & Tissue kit (Qiagen GmbH, Germany). The kit procedure was modified for sperm DNA by following protocol 2 on the Qiagen website. CAG repeats were sized by PCR with primers 5’-FAM-atgaaggccttcgagtccctcaagtccttc-3’ and 5’-ggcggctgaggaagctgagga-3’ according to 5 with slight modifications. Approximately 75ng of Genomic DNA was amplified with 0,15U AmpliTaq® Gold DNA polymerase (Applied Biosystems, CA), PCR Buffer II, 1.25 mM MgCl2, and 2.5 mM dNTPs (Applied Biosystems). The cycling conditions were 94°C for 10 min, 35 cycles of 94°C for 30 sec, 64°C for 30 sec, 72°C for 2 min, and a final extension at 72°C for 10 min. The FAM-labeled PCR products were mixed with GeneScan™ – 600 LIZ® Size Standard and HiDi™ Formamide (Applied Biosystems) and run on an ABI 3730 Genetic Analyzer (Applied Biosystems). Sizing of the PCR fragments was done by using the GeneMapper® Software Version 3.7 (Applied Biosystems). Levels of anthocyanins in different tissues were not measured.
Calculation of instability index
Calculation of instability index was done with a custom script in MATLAB (R2012b; MathWorks Inc., USA) as previously described 42, with minor changes: We used a 10 % peak threshold of the highest peak from the GeneMapper sample plots instead of 20 %, and ear samples taken at 3 weeks of age instead of tail samples. Ear and tail samples from the same mouse have shown identical CAG repeat values at 3 weeks of age (Møllersen et al., unpublished results). Normalized peak heights were calculated by dividing the peak height of each peak by the sum of all peak heights. The change in CAG repeat length was determined by referring to the main allele (the highest peak in the ear sample of the mouse at three weeks of age), and then giving the peaks in the sample from 22 weeks a position number according to their distance from the main allele. The normalized peak heights were then weighted by multiplication with the position numbers, and the instability index was the sum of the normalized and weighted peaks.
Open field test
The open field test was conducted in four identical square arenas (L40 cm x W40 cm x H35 cm), custom made from white PVC plastic. The arenas were evenly and indirectly illuminated from above (~200 lux). The R6/1 mice were individually placed along a wall of the open field and allowed to explore freely for 45 minutes. Spontaneous exploratory activity was monitored by a ceiling-mounted camera (Creative NX Ultra, Creative Technology Limited, Singapore) and tracked in real time by a video tracking system (ANY-maze, Stoelting Co., USA). The experimenter left the room after initiating the open field test and returned at the end of the 45 minutes test.
Rotarod test
The rotarod test was conducted on a TSE RotaRod Advanced with an Ø = 30 mm grooved drum for mice and a fall height of 15.8 cm (TSE Systems GmbH, Germany). The R6/1 mice were placed on the drum in one of four lanes facing away from the experimenter. Three 60 sec practice trials, with the drum rotating at 4 rpm, were given with an inter-trial interval of 10 minutes. Thirty minutes after the last practice trial the first of four test trials were given. During the test trials the drum rotation accelerated from 4 to 40 rpm over 300 seconds. The inter trial interval between test trials was fifteen minutes. The latency to fall was taken as an indicator of motor coordination and balance.
Statistical analysis
Student’s t-test was used for normally distributed data to compare average CAG repeat lengths and the instability index in all sampled organs between the anthocyanin-treated and the untreated HTT transgenic mice (Excel and MATLAB). Student’s t-test, Mann-Whitney test, two-way ANOVA, and repeated measures ANOVA (rmANOVA) were used as appropriate to analyse the effects of treatment, sex, weight and trials on the behavioural tests (Minitab, R and ANY-maze). A P-value < 0.05 was considered significant.
Abbreviations
8-oxoG, 7,8-dihydroxy-8-oxoguanine; BER, base excision repair; HD, Huntington’s disease; HTT/Htt, Huntingtin; Neil1, nei endonuclease VIII-like 1 (E. coli); Ogg1, 8-oxoguanine DNA glycosylase; WT, wild-type.
APPENDIX
Supplementary figures
Supplementary Fig. S1: GeneMapper raw data from one male R6/1 HD mouse at six weeks of age. The repeat length in tail at three weeks is identical to spleen and testis at six weeks, and only slightly increased in liver, cortex and striatum. These data indicate that there is no repeat instability in spleen and testis, and minimal expansion in liver and brain, from three to six weeks of age in R6/1 mice. The red line indicate the mean number of CAG repeats present in tail at 3 weeks.
Supplementary Fig S2: GeneMapper traces. Displayed plots from GeneMapper showing the fragment distribution in the organs of one male anthocyanin-treated R6/1 mouse and one male R6/1 control mouse at 22 weeks of age. The red lines indicate the mean number for CAG repeats present in ear at 3 weeks.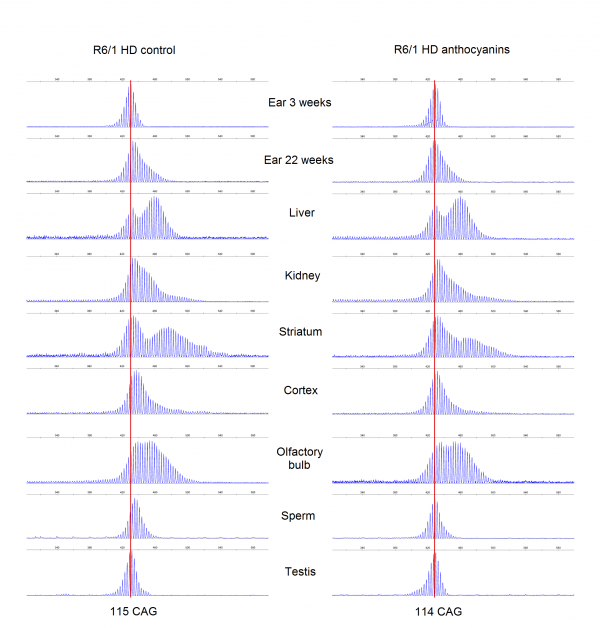
Supplementary Fig. S3: The average CAG repeat lengths in several organs from anthocyanin-treated and untreated R6/1 HD mice populations. The mean CAG repeat length from the organs of each mouse was calculated from the GeneMapper raw data using the formula ((∑(peak heights x basepair lengths)/∑peak heights)-86)/3 with a 10% peak threshold. Untreated R6/1 HD control mice n = 20, 11 males and 9 females; anthocyanin-treated R6/1 HD mice n = 23, 15 males and 8 females; data shown as means ± S.E.M.). * P < 0.05; two-tailed unpaired t-test.
Supplementary Fig. S4: Normalized and weighted peak heights for every organ in each R6/1 HD mouse. Dotted lines show the normalized and weighted peak heights for one mouse, while the thick lines display the mean values for the treatment groups.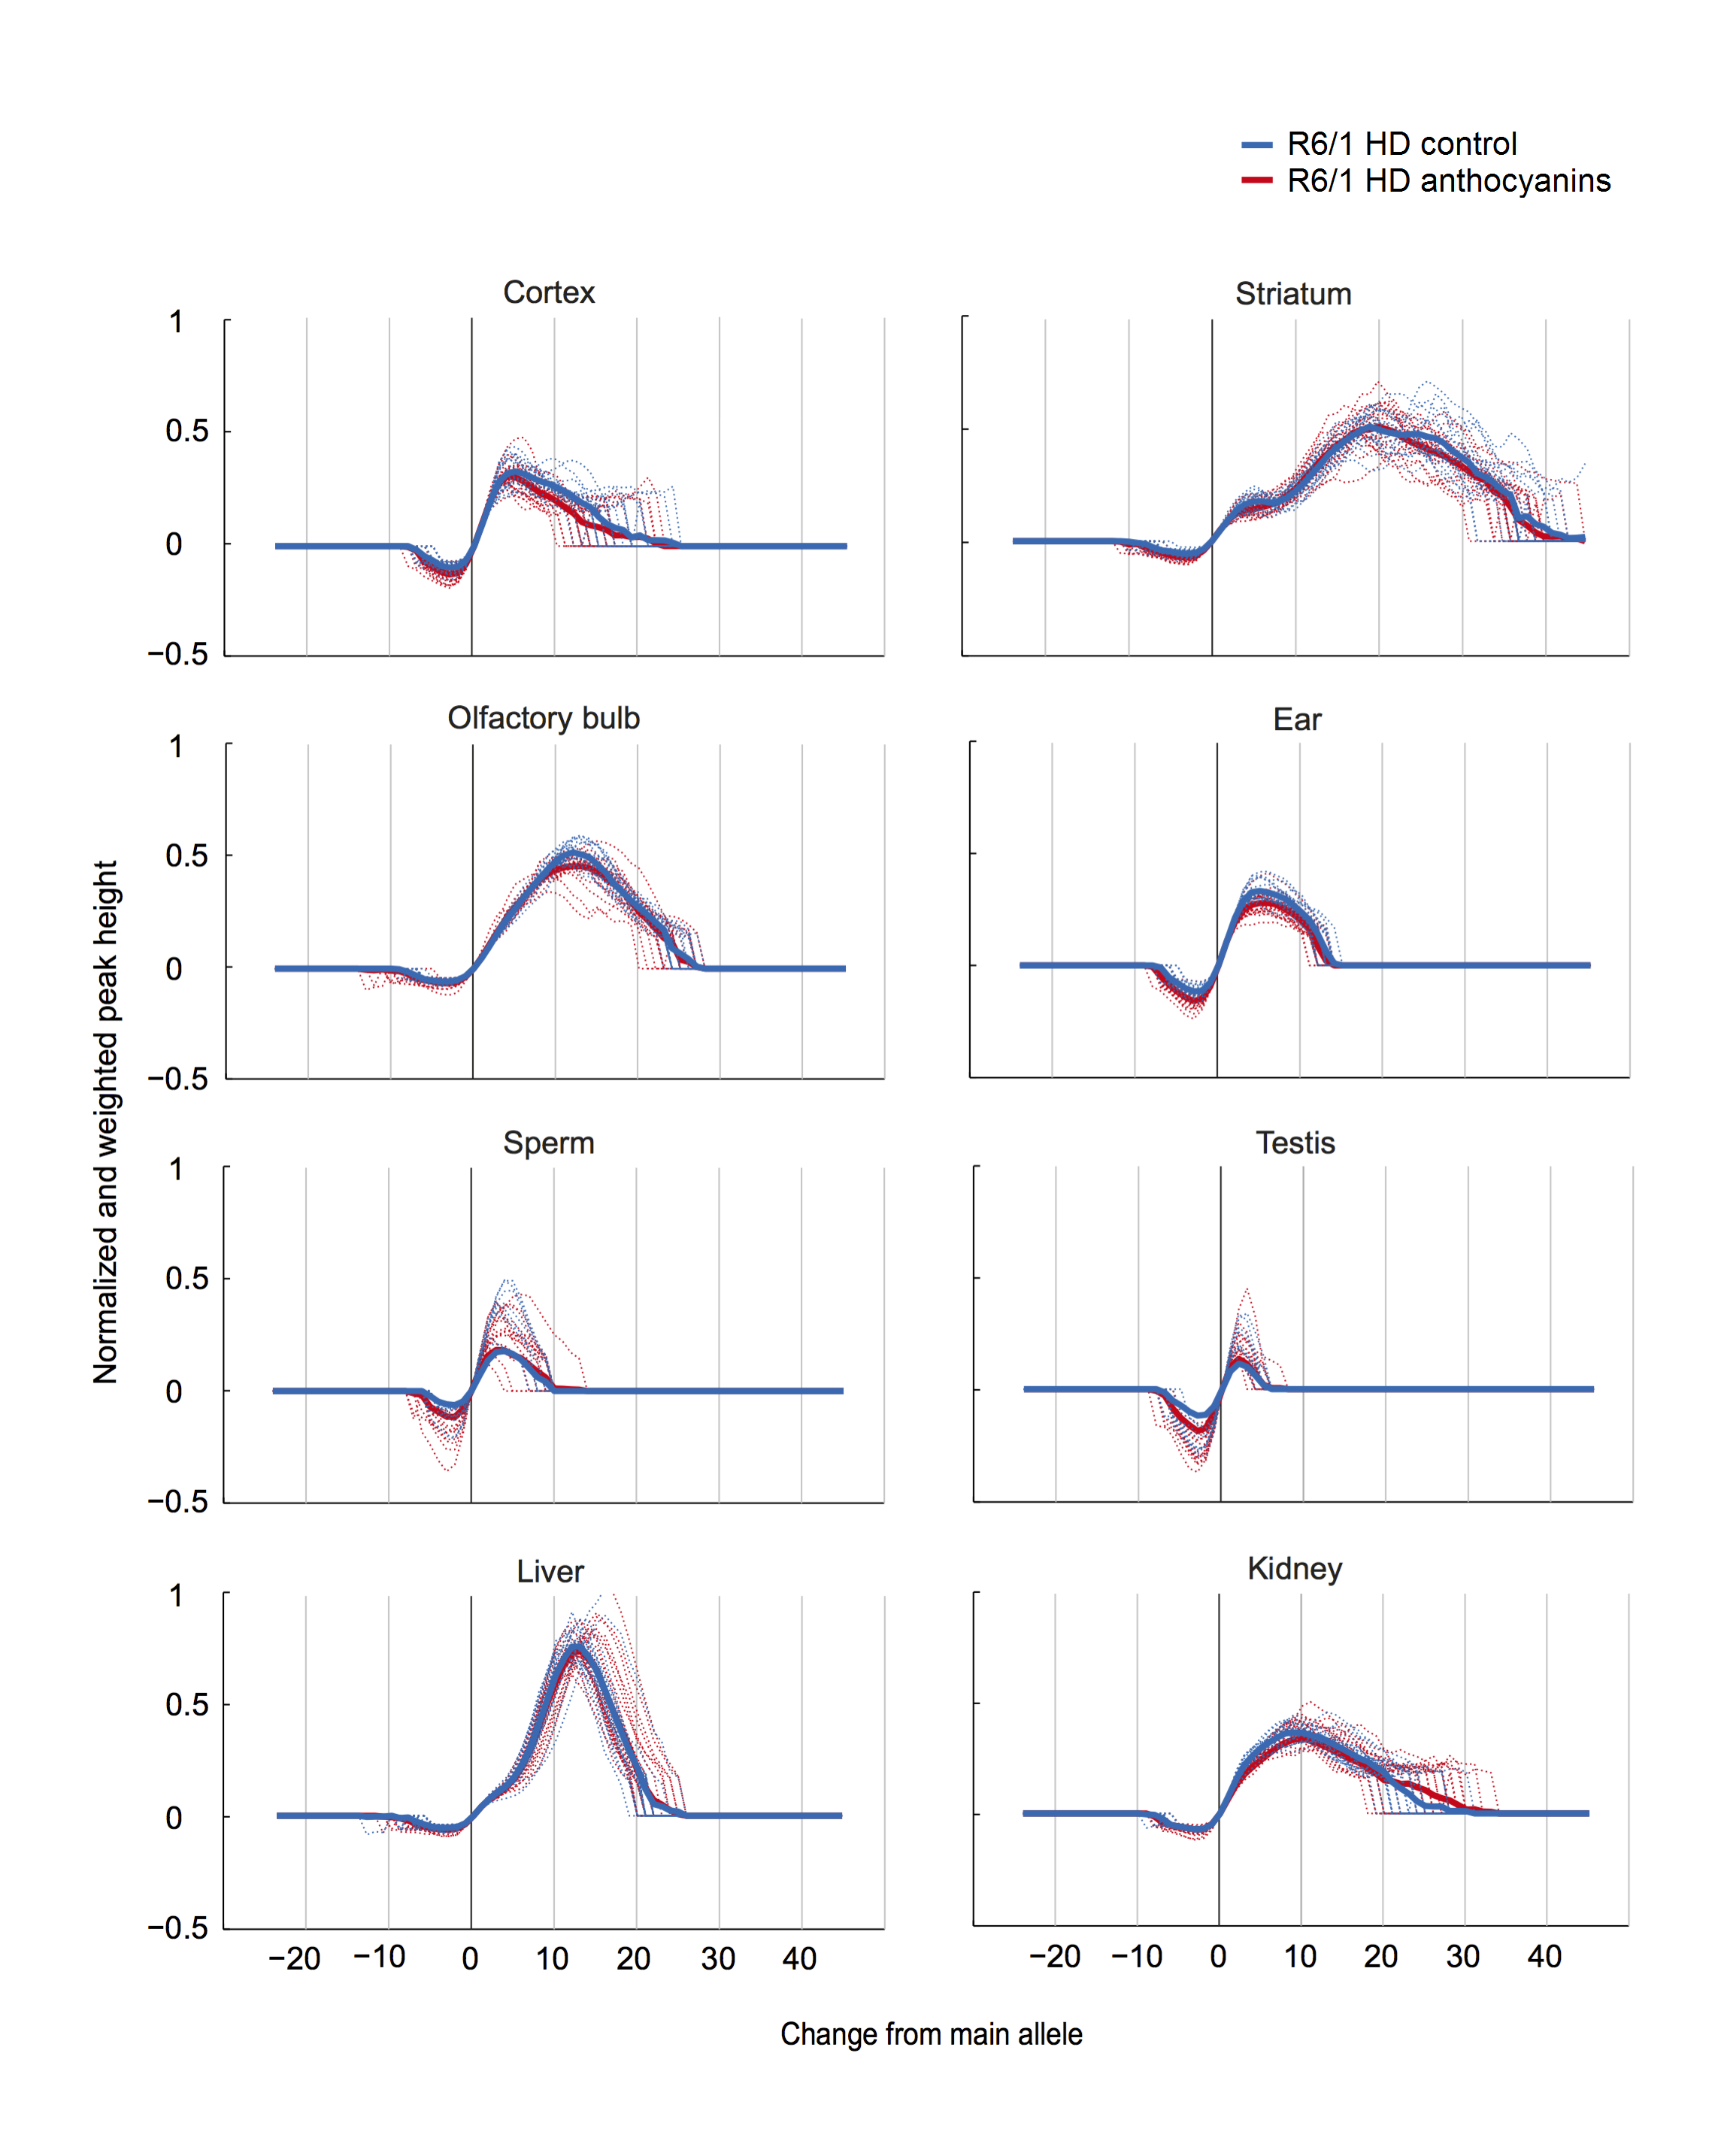
Supplementary Fig. S5: R6/1 WT and HD mice of 20 weeks of age were tested in the open field test. A) and B) There was no difference in the total distance travelled among genotypes during the 45 minutes test (P = 0.519 Mann-Whitney). However, it appeared that the R6/1 HD mice had higher activity in the beginning of the test that declined over time, while the R6/1 WT mice had more stable activity after the first 5 minutes. C) After the initial time period, R6/1 HD mice appeared to spend more time in the centre overall, while the R6/1 WT mice continued to avoid spending time in the centre arena. D) During the first five minutes of the test, there were no significant differences between R6/1 WT and HD siblings in the time spent in the centre of the arena (P = 0.606, Mann-Whitney). Because the sample sizes were small in this experiment, no meaningful analysis could be performed with sex as an additional factor. Data is shown as means ± S.E.M; n = 8 WT (5 females, 3 males), and n = 6 HD (3 females and 3 males).
Supplementary Fig. S6: Correlation of the mouse weight with the average latency to fall from the rotarod. A) Trend lines for anthocyanin-treated and untreated R6/1 HD mice show both a negative correlation. The 95 % confidence intervals for each treatment groups shown in grey are overlapping and indistinguishable, indicating no significant difference in treatment. B) From a linear model with combined treatment groups the latency to fall equals 181.24 – 5.15*weight. The coefficient for weight has a P-value of 0.014, confirming that mouse weight affects the latency to fall. Untreated R6/1 HD control mice n = 18, 11 males and 7 females; anthocyanin-treated R6/1 HD mice n = 23, 15 males and 8 females.
Supplementary Fig. S7: Examples of striatum and cortex samples from anthocyanin-treated and untreated R6/1 mice HD showing periodicity as previously reported 6. Most of the striatum samples and up to about half of the cortex samples displayed clear periodicity. No apparent differences were seen in periodicity between anthocyanin-treated and untreated R6/1 HD mice. Periodicity was not observed in any other organs than striatum and cortex.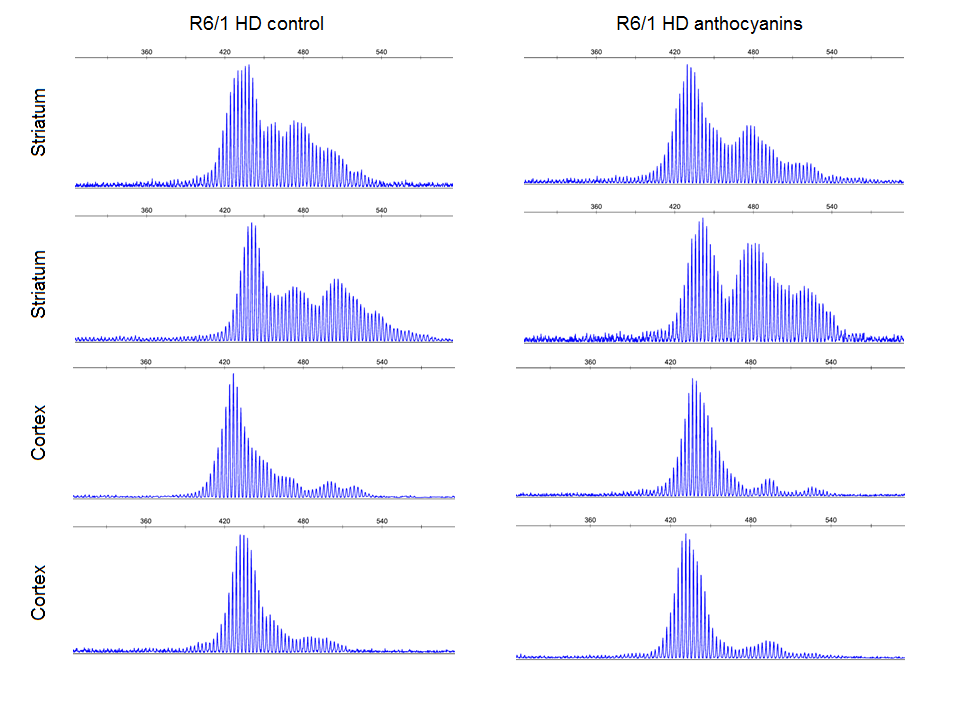
Methods: We conducted analyses of associations among current physical activity level, current and retrospective rate of change for hippocampus and striatum volume, and cognitive, motor, and day-to-day functioning variables. Participants were 48 gene-expanded cases with prodromal and early-diagnosed HD and 27 nongene-expanded control participants. Participants wore Fitbit Ultra activity monitors for three days and completed the self-reported International Physical Activity Questionnaire (IPAQ). Hippocampal and striatal white matter volumes were measured using magnetic resonance imaging. Cognitive tests included the Stroop Color and Word Test, and the Symbol Digit Modalities Test (SDMT). Motor function was assessed using the Unified Huntington’s Disease Rating Scale total motor score (TMS). Day-to-day functioning was measured using the World Health Organization Disability Assessment Schedule (WHODAS) version 2.0.
Results: Higher Fitbit activity scores were significantly related to better scores on the SDMT and WHODAS in case participants but not in controls. Fitbit activity scores tracked better with TMS scores in the group as a whole, though the association did not reach statistical significance in the case participants. Higher Fitbit activity scores related to less day-to-day functioning decline in retrospective slope analyses. Fitbit activity scores did not differ significantly between cases and controls.
Conclusions: This is the first known study examining the associations between activity level and imaging, motor, cognitive, and day-to-day functioning outcomes in prodromal and early HD. Preliminary results suggest physical activity positively correlates with improved cognitive and day-to-day functioning and possibly motor function in individuals in the prodromal and early phase of the condition.
]]>Introduction
Huntington disease (HD) is a rare neurological disease affecting 2.71 persons for every 100,000 persons worldwide1 that leads to progressive behavioral, cognitive, and motor decline. This autosomal dominant disorder is caused by an expansion of the cytosine-adenine-guanine (CAG) repeat, which codes for the huntingtin protein2. The huntingtin protein is expressed ubiquitously and its function remains unknown, but is thought to play a role in transcription regulation3. Onset of clinical manifestations typically occurs between ages 30 and 503. CAG repeat length may explain approximately 50–70% of the variance in age of onset4,5,6, with a recent study reporting a correlation of 0.53 between CAG repeat length and age of diagnosis7. Genetic modifiers are likely to contribute to the wide variance in age of onset, and several potential genetic modifiers have been identified8,9,10. Nevertheless, the range of age of onset of motor features can vary widely at each CAG repeat length6,7,11,12. The range with the greatest variability in age of onset encompasses those with CAG repeats between 40 and 48, which accounts for 80% of the gene-expanded (i.e. CAG ≥36) population7,13,14. Wexler and colleagues6, controlling for CAG repeat length along with shared and nonshared environments, found that in almost 4000 individuals, factors other than genetic and heritable factors accounted for approximately 60% of the variance in age of onset. More recently, Lee and colleagues15 found that 30% of variance in age of onset could be related to factors besides CAG repeat length. Together, these data indicate a significant amount of variance related to disease onset may be associated with other modifying factors.
Lifestyle factors, such as diet, substance use, cognitive reserve, and physical activity might be related to age of HD onset5,16,17,18. Pathological mechanisms in HD that could be impacted by lifestyle include oxidative stress and inflammation, neuronal damage, altered DNA synthesis and repair, and epigenetic modifications19,20,21,22,23.
Several randomized controlled trials have shown that physical exercise and physical therapy interventions improve gait, balance, mood, and quality of life, as well as cognitive and day-to-day functioning in persons with diagnosed HD24,25,26,27,28,29. Data also indicate physical activity relates to improved cognitive performance, physical functioning, mood, and quality of life in persons with dementia and mild cognitive impairment30,31,32,33. Physical activity protects against brain volume loss in healthy aging adults, and those at risk for, or diagnosed with, neurodegenerative diseases, including those that affect areas of the brain affected by HD, such as the basal ganglia and hippocampus25,34,35,36. Putative protective effects of exercise on cognition include decreased neuroinflammation37, increased brain-derived neurotrophic factor (BDNF) activity38,39, induction of neurogenesis40, upregulation of heat shock proteins41, and reduction of stress-induced hormone activity42.
Despite data indicating positive effects of physical activity in diagnosed HD, the impact of physical activity on prodromal HD remains unknown. Interventions to delay onset of HD should ideally begin before onset of motor features43, by which time the neurodegeneration is often extensive44. In a retrospective study of 154 people with diagnosed HD, researchers compared physical, intellectual, and passive lifestyles (based on leisure activities, education, occupation, and domestic activity) and found that a passive lifestyle (i.e., low-intensity physical activity and high sedentary activity) related to earlier onset and predicted age of onset independent of CAG repeat length, although physical activity alone was not associated with age of onset5. Data from mouse models are equivocal with regard to whether physical activity can delay onset of HD manifestations, with some studies indicating wheel running from an early age delays motor onset45,46 while others have suggested the opposite47. A single human case study in prodromal HD indicated running may have accelerated HD progression in a marathon runner48. The limited data regarding the impact of physical exercise in prodromal HD reveals that understanding the effects of differing levels of physical activity in people with the HD gene expansion is incomplete. Our study is the first that examines the relationship between physical activity and brain volume, as well as cognitive, motor, and day-to-day functioning in a prodromal and early HD sample.
Methods
Participants
The results in this article are from a subset of participants from the Neurobiological Predictors of Huntington’s Disease (PREDICT-HD) study, a longitudinal 32-site observational study that has followed over 1300 gene-expanded individuals and nongene-expanded control participants for over 12 years7,49,50,51. All participants traveling to the University of Iowa PREDICT-HD site between July 2012 and May 2013 were invited to participate in the substudy. The study procedure was explained to all participants, and all participants gave written informed consent. The study was done in accordance with the World Medical Association Declaration of Helsinki.
Participants included gene-expanded cases and nongene-expanded controls. Participants are considered gene-expanded cases when they have CAG repeat lengths greater than 36. Controls have tested negative for the HD gene expansion with CAG repeat lengths less than 35. All analyses compared outcomes of physical activity between cases and controls.
Participants in PREDICT-HD have been tested for the HD gene expansion and know their gene status, but do not exhibit motor features sufficient for an HD diagnosis upon enrollment into the study. However, some participants meet the Unified Huntington’s Disease Rating Scale (UHDRS) criteria for motor diagnosis during the course study participation and are at that time considered to have early stage HD. There were four such participants in our sample. Participants undergo a battery of cognitive, behavioral, and motor assessments, and MRI scans. Participants were excluded from participating if they had any of the following: clinical evidence of an unstable medical or psychiatric illness; alcohol or drug abuse within the past year; learning or developmental disability requiring special education; or history of another neurological condition.
Activity monitoring
We used Fitbit Ultra activity monitors (Fitbit, Inc., San Francisco) and the self-report International Physical Activity Questionnaire (IPAQ)52 to collect physical activity data from participants. The Fitbit Ultra (herein referred to as Fitbit) is a pedometer with a built-in accelerometer and altimeter that calculates steps taken, steps climbed, and distance in miles. In a validation study, Fitbit was shown to underestimate energy expenditure by approximately 15%, but compliance was higher than with other devices53. In order to facilitate compliance, the Fitbit was preferred due to the possibility of mildly impaired cognitive function in prodromal and early HD54. In a treadmill validation study, the Fitbit was shown to be as reliable as ActiGraph for step counts, which was the primary metric used for analysis55. A systematic review evaluating the reliability and validity of common activity tracking devices found that the Fitbit was highly correlated with laboratory-based studies while other studies found that at some speeds, the Fitbit underreported steps56. Given the exploratory nature of this study we proceeded with the Fitbit trackers.
Participants were shown how to use the Fitbit and were instructed to wear it clipped on to their waist during three self-defined “typical” days in a one-week period and to record dates of use on a record sheet. For example, participants who worked 40 hours per week were instructed to wear the Fitbit for two work days and one weekend day. If they participated in a regularly-scheduled physical activity (e.g. exercise class, recreation league sport, gym workout), they were instructed to wear the Fitbit tracker on a day that included this activity. Participants were instructed to put the Fitbit on immediately after waking up on selected days, and to remove it only when engaging in physical activities involving water, when showering, and when going to sleep for the night. For physical activity that involved water and required removing the Fitbit, participants were instructed to record their activity on the record sheet. They were informed that they did not have to include showering as water activity. Participants were instructed to mail back the Fitbit trackers and record sheets in the provided addressed-and-stamped envelopes. Activity data were downloaded to the web interface provided by Fitbit, Inc. Fitbit activity scores were calculated by combining the mean number of steps, miles, and stairs climbed over the three days to generate a total activity score for each participant.
The 7-item IPAQ52 is a self-report measure of physical activity that prompts participants to report the number of days in the past week they engaged in sitting, walking, and moderate or vigorous physical activity, and to specify the number of hours and minutes per day they spent in each activity. The IPAQ has demonstrated adequate reliability and validity, including good test-retest reliability (Spearman’s ρ = 0.8 within 8 days), and fair to moderate correlation (ρ = 0.30) between the IPAQ and accelerometer data57. Although there are some reported concerns about the reliability of the short form58, we decided to use the IPAQ because it is a short measure that creates minimal participant burden. While the Fitbit supplies data regarding the quantity of exercise a person participates in on a daily basis, the IPAQ provides the self-reported level of vigor of physical activity levels. Participants completed the IPAQ at home and returned it with the Fitbit trackers. We calculated IPAQ scores using the MET-minutes (MET = median metabolic equivalent) method for continuous IPAQ scores59. Essentially, each participant indicates (for each category: walking, moderate, and vigorous activities) the average number of days during which they engage in the specified activity, and how many hours each day they engage in said activity. These values are then multiplied together by a corresponding weight based on estimated MET. It should be noted that sitting time is not factored into the IPAQ variable analyzed below. The IPAQ and Fitbit participant scores were subsequently matched to the entire PREDICT-HD dataset for analysis.
Outcome variables
Outcomes of interest included variables consistently shown to be associated with disease progression in HD7,60,61,62,63,64,65. The striatum and hippocampus imaging was conducted using various 1.5 and 3T scanners based on study site. Volumes were analyzed using BRAINS image-processing software66.
Cognitive tests included the Symbol Digit Modalities Test (SDMT)67 and the Stroop Color and Word Test68. The SDMT is a timed test in which participants have 90 seconds to match digits with a provided symbol code. The score reflects the number of correct responses, with higher scores indicating better cognitive function. The Stroop Color and Word Test is made up of three timed tests in which participants (1) read color names printed in black ink; (2) identify the color of ink patches on a sheet; and (3) identify the color of ink that color words are printed in, including matching and non-matching word-color combinations. The final score refers to the number of correctly stated items for each test in 45 seconds, with higher scores indicating better cognitive function.
The UHDRS is a clinician-rated exam that generates a total motor score (TMS) from a battery of motor assessments (e.g., gait, involuntary movement, eye movement, dysarthria)69. Scores can range from 0–124, with higher scores indicating greater motor impairment. The 12-item World Health Organization Disability Assessment Schedule (WHODAS) version 2.0 is a test of global day-to-day functioning70 in which higher scores indicate worse functioning. We chose to include the companion-rated measure in addition to the participant-rated measure due to evidence of impaired reliability of self-report in the late prodromal period63.
Analysis
All analyses were performed using the statistical software program R (version 3.1.2). The overall goal of the analysis was to determine whether activity level is associated with progression in HD, and our exploratory aim was to examine whether being physically active may have a protective effect with respect to HD-associated changes. We calculated correlations between activity level (as measured by Fitbit and IPAQ) and cognitive, imaging, motor, and functional variables to assess whether activity level correlates with variables collected in PREDICT-HD. We also calculated correlations separately for gene-expanded and nongene-expanded individuals so as to assess whether the correlation structure changed by gene status. Next, we fitted linear mixed models (LMMs) using all available longitudinal data collected between 2002–2014 from PREDICT-HD to calculate progression indices for individuals in the subset with physical activity data. Progression indices were defined in terms of fixed and random slopes, so that each individual’s progression index is equal to his or her estimated annual change in the variable under consideration. Random slopes were then correlated with activity data. Multiple testing was accounted for using the false discovery rate (FDR).
Results
Descriptive analyses
For this sub study, 87 PREDICT-HD participants at the University of Iowa were invited to participate. Of these 87, one person declined to participate due to time concerns; one participant was ill the day of the study and withdrew; one participant did not return physical activity data; nine participants had incomplete data (four participants did not return IPAQ forms, four returned incomplete IPAQ forms, and six people returned Fitbits with no data on them); and one participant for which activity data were collected was removed from the analysis because that participant’s data were not contained in the latest data cut. Therefore, 75 participants with complete Fitbit and IPAQ data were used for these analyses. Table 1 shows participant demographic data. Most of the gene-expanded participants were in the prodromal stage. Four participants who completed the study had UHDRS diagnostic confidence level scores of 4, indicating that they had symptoms consistent with HD motor diagnosis. The only significant difference between cases and controls was mean CAG repeat length (F = 953.53, p < 0.001). For all other comparisons, p > 0.40.
| Variable | Case | Control |
|---|---|---|
| n | 48 | 27 |
| Baseline mean age (SD) | 45.68 (13.60) | 47.99 (10.47) |
| Baseline mean age (SD) prodromal only | 45.33 | – |
| Gender: female n (%) | 32 (66.66) | 19 (70.37) |
| Gender: male n (%) | 16 (33.33) | 8 (29.63) |
| Mean CAG repeat length (SD) | 41.81 (2.09) | 20.63 (3.86) |
| Mean years of education (SD) | 15.23 (2.20) | 15.56 (2.22) |
| DCL = 4 | 4 | N/A |
Activity monitoring
Most participants returned the Fitbits along with the Fitbit activity record sheet and IPAQ questionnaires. Four participants did not return Fitbit activity records with the Fitbits; however, we were able to use the data for analyses by extrapolating their activity data and dates of activity from the Fitbit website. In these cases, the three days with the most complete data were used. Seven participants recorded removing the Fitbits to shower or for water activities (e.g. 5 hours at a water park, 1 hour water volleyball, 40 minutes water aerobics, 1 hour kayaking). Several participants made notes on the record sheets to indicate atypical activity. These aberrations were either more sedentary than usual (e.g., long car rides, watching a football game, heavy rain inhibiting daily walk) or more active than usual (e.g., shoveling snow, long shopping trip, training for a marathon). Two participants recorded they removed the Fitbit during intensive exercise (an intensive video exercise program, a marathon training run) because the intensive exercise was not “typical” for them. We also encountered some technical issues with our physical activity monitoring, with one of the Fitbits recording implausible data (e.g., a mismatch between steps taken and miles tracked in a day or a mismatch in self-reported dates of activity and Fitbit recorded dates). The tracker with step/miles mismatch was retired as soon as the problem occurred. One Fitbit tracker was lost, and one was not returned.
Table 2 presents means, standard deviations, and ranges for variables in the analyses and shows that cases had worse performance than controls on SDMT and TMS at the 0.05 level. At the 0.10 level, daily functioning for cases was worse than controls, as rated by both participants and their companions. These findings indicate that even in the prodromal phase, cases displayed subtle differences in cognitive, motor, and day-to-day functioning. Cases self-reported higher physical activity levels on the IPAQ at the 0.10 level, although cases did not significantly differ from controls in physical activity levels recorded by the Fitbits.
Note: ~ corresponds to 0.05 < p < 0.10, + corresponds to 0.01 < p < 0.05SDMT = Symbol Digit Modalities Test; WHODAS = World Health Organization Disability Assessment Schedule 2.0; (p) = participant; (c) = companion; TMS = total motor score from the United Huntington’s Disease Rating Scale; IPAQ = International Physical Activity Questionnaire.
Variable
Case mean (SD)[range]
n
Control mean (SD)[range]
n
SDMT
50.80 (11.77)+ [25–76]
45
58.11 (8.88)[43–78]
27
WHODAS (p)
16.67 (6.36)~ [12–35]
40
13.48 (1.97)[12–19]
24
WHODAS (c)
15.97 (4.39)~[12–26]
39
13.73 (2.61)[12–21]
18
TMS
8.23 (11.65)+[0–45]
47
2.15 (3.17)[0–12]
27
IPAQ
3728 (3696)~[0–17788]
39
2051 (2131)[0–8088]
25
Fitbit
6781 (3587)[1414–16091]
48
7137 (2515)[3455–15054]
26
Cross-sectional correlations
Table 3 contains cross-sectional correlations. For the combined sample, activity level (as measured by the Fitbit) positively correlated with SDMT at the 0.10 level (r = 0.25, p = 0.056) and negatively correlated with the participant-rated WHODAS (r = -0.36, p = 0.009). Fitbit activity level negatively correlated with TMS at the 0.10 level (r = -0.23, p = 0.080). Fitbit also positively correlated with IPAQ activity levels (r = 0.41, p = 0.002). For the cases only sample, Fitbit activity level positively correlated with SDMT (r = 0.37, p = 0.034) and negatively correlated with participant-rated functional level on the WHODAS (r = -0.37, p = 0.047). Fitbit activity level positively correlated with IPAQ (r = 0.47, p = 0.009). No associations were significant in controls.
Note: ~ corresponds to 0.05 < p < 0.10, + corresponds to 0.01 < p < 0.05, ++ corresponds to 0.001 < p < 0.01. SDMT = Symbol Digit Modalities Test; WHODAS = World Health Organization Disability Assessment Schedule 2.0; (p) = participant; (c) = companion; TMS = total motor score from the United Huntington’s Disease Rating Scale; IPAQ = International Physical Activity Questionnaire.
Combined sample
Cases
Controls
Outcome Variable
IPAQ
Fitbit
IPAQ
Fitbit
IPAQ
Fitbit
Stroop Word
-0.17
0.07
-0.11
0.05
-0.20
0.10
Stroop Color
-0.13
0.13
-0.05
0.14
-0.16
0.03
Stroop Interference
-0.11
0.10
-0.13
0.11
0.08
0.04
SDMT
-0.04
0.25~
-0.02
0.37+
0.12
-0.13
WHODAS (p)
-0.01
-0.36++
-0.08
-0.37+
-0.09
-0.35
WHODAS (c)
0.10
-0.20
0.03
-0.21
0.12
-0.15
TMS
0.18
-0.23~
0.10
-0.24
0.34
-0.15
Hippocampal volume
-0.20
-0.07
-0.18
-0.17
0.08
0.03
Striatal volume
-0.10
0.06
-0.03
-0.05
0.27
0.18
IPAQ
–
0.41++
–
0.47++
–
0.35
Fitbit
0.41++
–
0.47++
–
0.35~
–
Scatterplots of Fitbit activity level with PREDICT-HD variables
Figure 1 depicts scatterplots of all cross-sectional pairs of Fitbit activity levels with commonly analyzed PREDICT-HD variables, such as the Stroop Color and Word Test, SDMT, WHODAS, TMS, and hippocampal and striatal brain volumes. These plots suggest activity levels, as measured with the Fitbit, may be associated with important outcomes in HD, including cognition (SDMT) and daily functioning (WHODAS).
Notes: SDMT = Symbol Digit Modalities Test (higher scores indicate higher cognitive function); WHODASp = World Health Organization Disability Assessment Schedule 2.0 participant version (lower scores indicate higher day-to-day function).
Fig. 1: Scatterplots of correlations between Fitbit activity scores and outcome variables.
Random slope correlations
A correlation matrix for the random slopes calculated from a linear mixed-effects regression analysis and activity level data is presented in Table 4. WHODAS participant slopes were negatively correlated with Fitbit activity level (r = -0.28, p = 0.039), and WHODAS (companion) slopes were negatively correlated with Fitbit activity level (r = -0.26, p = 0.065) at the 0.10 level.
Note: ~ corresponds to 0.05 < p < 0.10, + corresponds to 0.01 < p < 0.05. SDMT = Symbol Digit Modalities Test; WHODAS = World Health Organization Disability Assessment Schedule; (p) = participant; (c) = companion; TMS = total motor score from the United Huntington’s Disease Rating Scale; IPAQ = International Physical Activity Questionnaire.
Stroop Interference
SDMT
WHODAS (p)
WHODAS (c)
TMS
Hippocampal Volume
Striatal Volume
IPAQ
-0.12
-0.10
-0.15
0.08
0.20
-0.06
-0.20
Fitbit
0.16
0.08
-0.28+
-0.26~
-0.20
-0.04
0.04
Discussion
In this study, we examined associations between physical activity level and a variety of outcome variables with demonstrated sensitivity to changes in prodromal HD7. We collected physical activity data at participants’ most recent visit and compared this to their cognitive, behavioral, motor, functional, and imaging variables at the same visit, and to the rate of changes in the same variables from previous annual research visits. HD gene-expanded participants self-reported more physical activity on the IPAQ than nongene-expanded controls, but did not significantly differ in physical activity captured by Fitbit activity monitors. We used the short form of the IPAQ to limit participant burden. However, the short form of the IPAQ has questionable reliability58, which might account for the low correlations with the Fitbit scores in our study. The low correlations of the IPAQ to Fitbit scores may also be due to the fact that this is a cognitively impaired population, so perhaps self-reported exercise measures are not appropriate. Due to the limitations of the IPAQ, we focused on the associations between the more objectively recorded Fitbit physical activity measures rather than the self-reported IPAQ.
Given that Fitbit physical activity levels were similar between cases and controls, differences in outcome measures between cases and controls are less likely to be due to differences in level of physical activity between the groups. That is, any benefit seen is likely related to the level of physical activity since we only expect to see a cognitive or functional decline in the gene-expanded cases. In this study, higher Fitbit activity scores correlated with better cognitive functioning on the SDMT at the most recent visit for cases but not for controls. Since activity levels were similar between cases and controls this finding suggests that physical activity might provide cognitive benefits for people with the HD gene expansion.
The positive association between physical activity and the SDMT is a provocative preliminary result because the SDMT provides greater sensitivity to change in cognitive function in prodromal HD than the Stroop tests71. This enhanced effect size permitted us to identify changes in SDMT that would likely not be possible with Stroop tests. Our finding supports those from Piira and colleagues28, who found improvement on the SDMT, but no significant improvement on the Stroop tests, in a similarly-sized sample of early- and mid-stage HD participants following an intensive physical rehabilitation program.
We did not find evidence that physical activity is related to hippocampal or striatal volume, despite studies indicating that physical activity can maintain the volumes of these structures in aging adults and adults at risk for Alzheimer disease (AD)34,35,36. However, we did not collect longitudinal physical activity data, which is a limitation of this study and a necessity for future studies looking at brain volume changes over time. Physical activity may also produce cognitive benefits by promoting compensatory neuronal pathways via increased connectivity, which would require use of other imaging techniques, such as functional connectivity with resting state MRI or white matter tract integrity with diffusion tensor imaging.
In the rate-of-change analyses, we analyzed the correlations between physical activity, as measured at the most recent research visit, and rate of change over time. We found positive correlations between physical activity level and performance on the WHODAS, a measure of day-to-day functioning. This finding suggests physical activity might help preserve physical functioning and independence. However, we cannot discount the possibility that people who have better day-to-day functioning feel able to be more physically active. The relationship between higher activity levels and WHODAS performance is also a promising indicator that, if indeed physical activity can improve functioning and independence, health-related quality of life would also improve63.
Our study had a high recruitment-and-retention rate; only one PREDICT-HD participant declined to participate in the add-on study due to concerns about time commitment. In addition, 75/83 (90%) of the participants we enrolled completed the activity portion of the study, in line with another study involving an exercise intervention for people with diagnosed HD that had a retention rate of 81%24. This indicates that physical activity intervention programs are feasible, even in patients with early diagnosed HD.
This study had some limitations. We did not measure physical activity longitudinally. Instead, we made the assumption that one-time physical activity data for each participant would reflect their recent exercise history. However, collecting longitudinal physical activity data would be preferable. We have a small sample size for this study. More data are needed with larger samples to determine the effects of physical activity on cognitive function.
We also encountered some technical issues with the Fitbit, as noted above. More recent models of the Fitbit are now available and could provide more accurate data. It is also possible that people did not accurately report compliance with wearing the Fitbits. However, the number of people recording deviations in following the protocol (temporary removal) provides some indication that at least those participants were conscientious about using the Fitbit as instructed. There were other instances where a Fitbit was returned without self-reported date sheets. In these situations we extrapolated accurate data by using dates with physical activity recorded in the Fitbit database. There is also a limitation of the reliability of the accelerometer accuracy in a population that could have chorea movements. It is not known how this Fitbit device would calculate these disease-associated movements.
Also, we recruited participants year round. It is possible that participants recruited in the winter months had lower activity levels than others given that it is more difficult to participate in outdoor activities in cold weather. We also did not account for water activities that were not recorded by the Fitbit. In future studies, water activity should be accounted for, and all activity scores should be converted to one metric, such as METs. Despite the limitations in using the Fitbit and the IPAQ, our study demonstrates it is feasible to collect physical activity data from participants with prodromal and early stage HD. Future studies might also benefit from ensuring that a companion is involved, which might help ensure accurate completion of forms.
The prodromal participants in our study may be older than other prodromal individuals in the population. HD typically manifests in the late thirties or early forties. Our mean age of enrollment of 45.3 years for prodromal participants is comparable with manifest participants from other studies. If health behaviors impact age of onset, this age difference might reflect lifestyle factors that delay onset. For example, our gene-expanded participants had a higher average education level (15.1 years) than the average for United States residents. More education has been associated with better cognitive function in people with HD72, ostensibly by contributing to cognitive reserve, which is also associated with a reduced risk of AD73.
Conclusion
Interventions that could delay the onset of an HD motor diagnosis, particularly at a time when people are at their peak earning potential and raising families, may improve functioning and health-related quality of life. Interventions should begin prior to motor diagnosis because there is some evidence that much of the damage the disease causes is done by the time of diagnosis16,74,75. More specific recommendations require prospective, randomized controlled trials of physical activity interventions. There is evidence that metabolic and physiological responses to exercise are altered in HD76 and that intensive exercise might damage muscle tissue77,78, requiring a careful determination of the proper dose of exercise to forestall HD progression. In one study involving aging adults at risk for mild cognitive impairment (MCI), moderate exercise was more strongly related to reduced odds for developing MCI than light or vigorous exercise31. Perhaps this is a recommendation that could be explored for relevance for HD.
Physical activity is an easy-to-implement, low-cost intervention that may help delay cognitive decline in gene-expanded persons, and also may have health benefits for at-risk HD family members who have not yet been tested or who do not want to be tested. Physical activity is a health behavior that can be started at a very young age. Children who are at risk can participate in family physical activities. Those habits started at a young age can continue throughout the child’s life, offering benefits for overall health, and could have a potential protective effect with respect to early cognitive decline associated with HD.
Competing Interest Statement
Dr. Long has a consulting agreement with NeuroPhage, LLC, and is a paid consultant for Roche Pharma (F. Hoffmann-La Roche Ltd), and Azevan Pharmaceuticals, Inc.
Jane S. Paulsen has served on an advisory board for Lundbeck, LLC and has a consulting agreement with ProPhase, LLC.
PREDICT-HD Investigators, Coordinators, Motor Raters, Cognitive Raters
Isabella De Soriano, Courtney Shadrick, and Amanda Miller (University of Iowa, Iowa City, Iowa, USA);
Edmond Chiu, Joy Preston, Anita Goh, Stephanie Antonopoulos, and Samantha Loi (St. Vincent’s Hospital, The University of Melbourne, Kew, Victoria, Australia);
Phyllis Chua and Angela Komiti (The University of Melbourne, Royal Melbourne Hospital, Melbourne, Victoria, Australia);
Lynn Raymond, Joji Decolongon, Mannie Fan, and Allison Coleman (University of British Columbia, Vancouver, British Columbia, Canada);
Christopher A. Ross, Mark Varvaris, Maryjane Ong, and Nadine Yoritomo (Johns Hopkins University, Baltimore, Maryland, USA);
William M. Mallonee and Greg Suter (Hereditary Neurological Disease Centre, Wichita, Kansas, USA);
Ali Samii, Emily P. Freney, and Alma Macaraeg (University of Washington and VA Puget Sound Health Care System, Seattle, Washington, USA);
Randi Jones, Cathy Wood-Siverio, and Stewart A. Factor (Emory University School of Medicine, Atlanta, Georgia, USA);
Roger A. Barker, Sarah Mason, and Natalie Valle Guzman (John van Geest Centre for Brain Repair, Cambridge, UK);
Elizabeth McCusker, Jane Griffith, Clement Loy, Jillian McMillan, and David Gunn (Westmead Hospital, Sydney, New South Wales, Australia);
Michael Orth, Sigurd Süβmuth, Katrin Barth, Sonja Trautmann, Daniela Schwenk, and Carolin Eschenbach (University of Ulm, Ulm, Germany);
Kimberly Quaid, Melissa Wesson, and Joanne Wojcieszek (Indiana University School of Medicine, Indianapolis, Indiana, USA);
Mark Guttman, Alanna Sheinberg, Albie Law, and Irita Karmalkar (Centre for Addiction and Mental Health, University of Toronto, Markham, Ontario, Canada);
Susan Perlman and Brian Clemente (UCLA Medical Center, Los Angeles, California, USA);
Michael D. Geschwind, Sharon Sha, Joseph Winer, and Gabriela Satris (University of California, San Francisco, San Francisco, California, USA);
Tom Warner and Maggie Burrows (National Hospital for Neurology and Neurosurgery, London, UK);
Anne Rosser, Kathy Price, and Sarah Hunt (Cardiff University, Cardiff, Wales, UK);
Frederick Marshall, Amy Chesire, Mary Wodarski, and Charlyne Hickey (University of Rochester, Rochester, New York, USA);
Peter Panegyres, Joseph Lee, Maria Tedesco, and Brenton Maxwell (Neurosciences Unit, Graylands, Selby-Lemnos & Special Care Health Services, Perth, Western Australia, Australia);
Joel Perlmutter, Stacey Barton, and Shineeka Smith (Washington University, St. Louis, Missouri, USA);
Zosia Miedzybrodzka, Daniela Rae, Vivien Vaughan, and Mariella D’Alessandro (Clinical Genetics Centre, Aberdeen, Scotland, UK);
David Craufurd, Judith Bek, and Elizabeth Howard (University of Manchester, Manchester, UK);
Pietro Mazzoni, Karen Marder, and Paula Wasserman (Columbia University Medical Center, New York, New York, USA);
Rajeev Kumar, Diane Erickson, Christina Reeves, and Breanna Nickels (Colorado Neurological Institute, Englewood, Colorado, USA);
Vicki Wheelock, Lisa Kjer, Amanda Martin, and Sarah Farias (University of California, Davis, Sacramento, California, USA);
Wayne Martin, Oksana Suchowersky, Pamela King, Marguerite Wieler, and Satwinder Sran (University of Alberta, Edmonton, Alberta, Canada);
Anwar Ahmed, Stephen Rao, Christine Reece, Alex Bura, and Lyla Mourany (Cleveland Clinic Foundation, Cleveland, Ohio, USA);
Executive Committee
Principal Investigator Jane S. Paulsen, Jeffrey D. Long, Hans J. Johnson, Thomas Brashers-Krug, Phil Danzer, Amanda Miller, H. Jeremy Bockholt, and Kelsey Montross.
Scientific Consultants
Deborah Harrington (University of California, San Diego); Holly Westervelt (Rhode Island Hospital/Alpert Medical School of Brown University); Elizabeth Aylward (Seattle Children’s Research Institute); Stephen Rao (Cleveland Clinic); David J. Moser, Janet Williams, Nancy Downing, Vincent A. Magnotta, Hans J. Johnson, Thomas Brashers-Krug, Jatin Vaidya, Daniel O’Leary, and Eun Young Kim (University of Iowa).
Core Sections
Biostatistics: Jeffrey D. Long, Ji-In Kim, Spencer Lourens (University of Iowa); Ying Zhang and Wenjing Lu (University of Indiana).
Ethics: Cheryl Erwin (Texas Tech University Health Sciences Center); Thomas Brashers-Krug, Janet Williams (University of Iowa); and Martha Nance (University of Minnesota).
Biomedical Informatics: H. Jeremy Bockholt, Jason Evans, and Roland Zschiegner (University of Iowa).
1. Introduction
Huntington’s disease (HD) is a devastating neurological disorder caused by a dominantly inherited CAG repeat expansion in the huntingtin gene. HD has diverse and progressive symptoms and is characterised by deteriorating motor and cognitive functions, as well as behavioural and neuropsychiatric disturbances. White-matter atrophy is detectable in the earliest premanifest stages of the disease and caudate, putamen, and grey-matter volumes have strong predictive value for future clinical diagnosis of HD in those carrying the gene mutation1,2. However, despite the prognostic value of these structural measures, it is clearly the associated cognitive decline and behavioural changes that present the most challenging features of the disease for HD patients and their families.
The identification of targets for potential disease-modifying therapies is the focus of considerable research effort, but most current interventions rely on symptomatic management of HD (see Videnovic 20133 for a summary). Insufficient clinical evidence exists to guide the long-term pharmacological management of HD. Currently the only FDA-approved treatment for HD is tetrabenazine, which was endorsed for the management of chorea in 2008. Otherwise, treatment of motor dysfunction is largely confined to neuroleptics (e.g. risperidone, olanzapine and quetiapine), some of which may also help to control severe neuropsychiatric symptoms such as delusions, hallucinations and violent outbursts. Other behavioural and neuropsychiatric indications are more commonly managed with serotonin reuptake inhibitors (SSRIs, e.g. fluoxetine, citalopram and paroxetine) and serotonin-norepinephrine reuptake inhibitors (SNRIs, e.g., duloxetine and venlafaxine), and other drugs which increase central noradrenergic and serotonergic neurotransmission (e.g. mirtazapine).
Paradoxically, many of the drugs used in the symptomatic management of HD have side effects that are difficult to distinguish from the progressive symptoms of the disease. Tetrabenazine, for example, carries a risk of potentially serious adverse reactions and may increase the risk of depression4, whereas neuroleptics and SSRI/SNRIs may be associated with fatigue, restlessness, anxiety and hyperexcitability. Use of such pharmacological agents may therefore be prohibited before or during future clinical trials, and at the very least their potential effect on a study’s endpoints must be understood in order to establish independent effects of concomitant and study therapies.
Evidence suggests that some pharmacological treatments for symptoms in HD can have unintended effects on potential study endpoints. For example, nearly all clinical trials in HD to date have used the Unified Huntington’s Disease Rating Scale total motor score (UHDRS-TMS) and total functional capacity (UHDRS-TFC) measures5 as either primary or secondary outcomes. Yet components of the UHDRS, and in particular chorea, are known to improve with tetrabenazine4 and neuroleptics, such as clozapine6 and tiapride7. Candidate therapeutics for cognitive dysfunction are in development8, but even less is known about how frontline symptomatic treatments affect cognitive manifestations of HD. Neuroleptic use has been linked with poorer recognition of facial emotions, whereas SSRI use was associated with improved recognition9. In the few trials in HD that have included endpoints such as attention, memory and executive function10,11,12, the extent to which concomitant medication was controlled varied, and only one excluded participants who had used cholinergic/anticholinergic/antidopaminergic drugs within 4 weeks of enrolment. None of the trials demonstrated any significant improvement in cognition. Furthermore, there are few studies of the association between neuroleptics and neuropsychiatric symptoms in HD3, but evidence from other fields suggests there may be modest improvements in neuropsychiatric symptoms, e.g. in AD13,14. However, these are often accompanied by increases in adverse events, and concerns about increased mortality associated with their long term use have emerged15.
For this study, we evaluated associations between use of neuroleptics and commonly used antidepressants, common therapeutic strategies for HD, and measures of motor function, cognition, neuropsychiatry and emotion recognition in individuals in the early stages of HD using 36 months of data from TRACK-HD1,2,16,17. TRACK-HD is a longitudinal, natural history study examining disease progression in individuals with premanifest and early-stage HD and each annual assessment included a battery of potential clinical and biological outcome measures, as well as a detailed history and record of ongoing medication use. Not surprisingly, medication use was highest among the manifest HD participants and the most commonly prescribed drugs in this group were neuroleptics, SSRIs and SNRIs. We focus on use of these most commonly used medications in this paper.
Randomized controlled trials are the gold standard for establishing potentially causal relationships between use of treatments and endpoint measures. However, most allow the use of some medications, particularly antidepressants, so it is important to understand the impact of such concomitant medications on trial endpoints. In the absence of randomized controlled trials, observational data may be used to study the effects of treatments on endpoints of interest. In order to attempt to establish potentially causal effects of treatments on outcomes from observational data we must account for the lack of randomization to treatments. This is done by careful control for variables which are associated with both medication use and the endpoint of interest. There is a growing literature on the use of observational data to estimate the causal effects of treatments18. For example observational data has been used to study the causal effects of Zidovudine on CD4 count in individuals with HIV19 and that of postmenopausal hormone therapy on coronary heart disease in women20.
The aim of our investigation was to use observational data from the TRACK-HD study to estimate, as far as possible, the causal effect of medication on motor function, cognition, neuropsychiatry and emotion recognition (a subset of the TRACK-HD assessments). Since functionality may affect whether a medication is prescribed by the participant’s doctor, prior measures of clinical performance were considered as potential confounders, in the sense that they may serve as indirect indicators of functional decline. Prior medication use was also considered in our analysis as this in turn may affect function and performance of the TRACK-HD assessments. Although these issues presented a challenge for the statistical analysis, the longitudinal nature of the TRACK-HD study data made it possible to perform an analysis that adjusts for potential confounding variables measured in the past (`prior measures’).
2. Methods
2.1 Participants
The inclusion criteria for TRACK-HD have been described previously1. Participants attended annual visits (2008-2011) at four study sites in London (UK), Paris (France), Leiden (Netherlands), and Vancouver (Canada), and 123 early-stage HD individuals were included. Our analysis excluded the TRACK-HD premanifest cohort as medication use in this group was relatively low and the early HD patients represent the most likely participants in imminent clinical trials. Using the UHDRS5, early HD participants were designated at baseline as either stage 1 (TFC 11-13) or stage 2 (TFC 7-10)21. The study was approved by local ethics committees and written informed consent was obtained from each participant before enrolment.
2.2 Medication use
In TRACK-HD, drug name, indication, dose, regimen, frequency and route were recorded together with start and stop dates for each medication. The most commonly prescribed medications were neuroleptics, and serotonergic antidepressants (SSRIs, SNRIs and related compounds or both, referred to henceforth as SSRI/SNRI). Only a very small number of individuals were recorded to be using tetrabenazine in this study and so we excluded this from our analyses. Our analysis therefore focuses on neuroleptics and SSRI/SNRIs and Supplementary Table 1 catalogues the specific agents in use for each class of medication. Start and stop dates were used to identify whether a given medication was being taken at each participant study visit.
2.3 Clinical performance assessment
TRACK-HD included a range of clinical, cognitive, quantitative motor (Q-Motor), and neuropsychiatric assessments; significant cross-sectional and longitudinal differences in performance between the early-HD group and controls have been reported previously1,2,16,17 and are not discussed here. The individual tests below were selected from the TRACK-HD assessments on the basis that they have been reported on previously1,2,16,17, were measured at all participant visits and have been found to change significantly over time in early HD individuals relative to controls or to be associated with progression over time in TFC in early HD individuals. The UHDRS measures were also selected because they are used as primary outcomes in randomized controlled trials in HD.
Motor function was assessed by total motor, chorea, oculomotor, and bradykinesia scores from the UHDRS5. Motor performance was also assessed quantitatively using a Q-Motor battery, which included chorea position and chorea orientation indices (Choreomotography, assessing involuntary choreatic movements), and variability in grip force (Manumotography), isometric tongue protrusion force (Glossomotography), and speeded tapping (Digitomotography).
Cognitive performance was measured using the Symbol Digit Modalities Test (SDMT; number correct), Stroop Word Reading condition (number correct), Direct and Indirect Circle Tracing (annulus length), and a visual working memory task known as Spot the Change (set size 5; number correct). The cognitive battery also included a test of recognition of facial expressions of emotions. We used the scores for the number of correctly identified following emotions: anger, disgust, fear, happiness, neutral, sadness, surprise.
Neuropsychiatric symptoms were identified during a structured interview using a shortened version of the Problem Behaviours Assessment (PBA-s)22. Depression, suicidal ideation, anxiety, irritability, aggression, apathy and perseveration were scored on a five‐point (0‐4) scale for severity and a five‐point scale for frequency (over the course of the previous four weeks). The severity and frequency scores were then multiplied to yield an overall score for each symptom, which were then added to produce composite scores for affect (sum of scores for depression, suicidal ideation and anxiety) irritability (sum of scores for irritability, anger and aggression, and perseveration), apathy and a total behavioural score (sum of scores for depression, suicidal ideation, anxiety, irritability, anger and aggression, apathy and perseveration). In the analyses outlined below, we also made use of estimates of the worst levels of severity of affect, irritability and apathy in the preceding year; these are referred to as the ‘secondary neuropsychiatry scores’. In addition we included the Hospital Anxiety/Depression Scale (HADS) total score.
2.4 Statistical methods
We let denote medication use (either neuroleptics or SSRI/SNRI) at study visit
; this is a binary variable taking value 1 if an individual is taking the medication at visit
and value 0 otherwise.
denotes the task performance measure of interest as the outcome at study visit
.
denotes the collection (i.e. a vector) of all other task performance measures at study visit
that we need to take account of in a study of the causal effect of
on
. Baseline variables are denoted by
, which contains sex, disease subgroup (stage 1 or stage 2), age and CAG and their interaction, study site, education level (six categories). A bar over a variable at time
denotes the history of measures of that type up to time , e.g.
. Under the models described below, the task performance measure is the outcome or response variable and medication use is the main exposure of interest.
We started by considering Model 1 in which only baseline variables are included as potential confounders of the association between medication use at time t and clinical performance at time
Model (1):
Under this model, the expected outcome at time (
) is modelled as a function of concurrent medication use (
) and baseline variables (
). Parameter
denotes the association of the exposure with the outcome given baseline variables; that is, the mean difference in the outcome
for individuals taking medication versus not taking medication at a given time, conditional on baseline variables
. We emphasise that the baseline variables do not include medication status or clinical performance measures at baseline.
Model 1 does not accommodate confounding by prior medication use and prior clinical performance measures. To attempt to come closer to a causal interpretation for the estimates of associations between medication use and clinical performance measures we need to control for the potential roles of these other variables. Directed acyclic graphs (DAGs) or ‘causal diagrams’ are used to describe the potential longitudinal relationships between medication use and clinical performance. Here we use the causal diagram in Figure 1. This takes into account the possibility that prior clinical performance. i.e. the outcome at the previous visit, may affect whether a patient is prescribed a medication, and vice versa. It also indicates the possible need to adjust for other prior measures of clinical performance – the aim of such adjustment is to help to control for some of the confounding implied by the connections of unmeasured disease status (D) with clinical performance measures and medication use. Use of other medications may also confound associations. Figure 1 also illustrates the need to consider the possibility that there could be unmeasured confounding that we cannot control for in the analysis. Corresponding to Figure 1, the more complex model we fitted, denoted Model 2, is of the form:
Model (2):
where denotes SSRI/SNRI use if
denotes neuroleptics use, and vice versa. The variables contained in
,
, and
for each type of clinical performance measure and for each medication type are shown in Table 1. Note that we do not necessarily believe that the
causally affect
, but rather that there is an association between these variables via the unmeasured underlying disease status, which is likely to more realistic – this is represented in Figure 1 by showing the unobserved underlying disease states
influencing
,
and
and therefore inducing confounding by
. This motivates adjusting for
in Model 2. Inclusion of additional variables, from those considered in this study, in
aside from those listed in Table 1 did not have any material impact on the results. For example, adjustment for cognitive, neuropsychiatric or emotion recognition measures in models for Neuroleptics with a motor function measure as the outcome. We did not consider adjustment for use of medications other than neuroleptics and SSRI/SNRIs due to small numbers of individuals using other medications.
Parameter denotes the association of medication use with clinical performance given baseline variables and all other variables in the model. This parameter is represented in Figure 1 by the direct arrows from
to
. Note that the model is focused on estimating this particular association and by fitting model (2) we do not directly estimate the parameters associated with the other arrows shown in Figure 1. If there is no unmeasured confounding (as depicted in Figure 1) and the model is correctly specified then the parameter
is interpreted as the causal effect of medication use on the clinical outcome measure, as measured by a mean difference in the outcome for individuals on medication versus those not on medication. However, causal interpretations should be made with caution because the assumption of no unmeasured confounding may not be met, despite us adjusting for a large number of variables in the analyses.
Models 1 and 2 are fitted using generalised estimating equations (GEEs) using independence working correlation structure23,24. We do not use the data on the association between medication use and clinical performance from visit 1 – this is because we assume that there is unmeasured confounding due to prior measures which are not observed. However, data from visit 1 will still be used to provide adjustment variables for visit 2 associations.
There is some missing data due to drop out from the study and due to some participants not completing a particular assessment at a given study visit. This is summarised in Supplementary Table 2. Models 1 and 2 were fitted first using a complete-case analysis, i.e. dropping any subjects with any incomplete data. Note that Model 2 suffers a greater missing data problem than Model 1 because it includes more explanatory variables. We also used multiple imputation by chained equations25,26 to impute the missing data, using the approach for longitudinal data described by Nevalainen et al (2009)27, with 100 imputed data sets. Model 2 was refitted on the imputed data sets and the resulting estimates combined using Rubin’s Rules25. All analyses were performed using R. The multiple imputation was performed using the ‘mice’ package28

Fig. 1: Associations between exposures X (medication use) and outcomes Y (clinical performance measures) at four study visits, including other longitudinal measured variables L and unmeasured ‘underlying disease status’ D, which is assumed to be not completely captured in the measured variables Y and L. Solid-line arrows represent the possible effect of one variable on another. Dotted lines represent possible effects of measured variables on unmeasured disease status, and vice versa. Baseline variables Z, which are not time-varying, are not shown but are assumed to potentially affect all other variables.
Table 1: The variables contained in Model 2 for each type of clinical performance measure and for each medication type.
3. Results
3.1 Summary of medication use
Table 2 summarises medication use by study visit. Table 3 shows a summary of the baseline characteristics of the early-HD population in TRACK-HD, overall and by medication use (neuroleptics and SSRI/SNRIs).
Use of neuroleptics at baseline was higher in men than women (33.9% versus 17.9%, p-value 0.042). There was a strong association between study site and neuroleptics use (p-value <0.001), with the Paris site having a high proportion of users (56.7%) compared to the London site, which had the lowest proportion (6.7%). A higher level of education was also statistically significantly associated with greater use of neuroleptics (p-value 0.004). No associations were found between neuroleptics use and disease stage, CAG, or age.
A quarter of early-HD participants were users of neuroleptics at baseline (25.2%) and this increased to 42.3% at 36 months (visit 4). Many individuals were continuing users, but there were also 28 new users of neuroleptics over the course of the study. Use of SSRI/SNRIs was higher, increasing from 46.3% at baseline to 55.7% by 36 months, but with fewer new users, at just 18 over the course of the study. At baseline, 13.8% were using both neuroleptics and SSRI/SNRIs, and this increased to 28.9% at 36 months.
The average age of SSRI/SNRI users was significantly higher than in non-users (51 versus 46, p-value 0.007) and those with stage 2 HD were more likely to be taking SSRI/SNRIs than those who were HD stage 1 (54.4% versus 33.7%, p-value <0.001). Use of SSRI/SNRIs did not differ statistically significantly between men and women, by CAG, by study site or by education.
Table 2: Summary of medication use among early-HD participants in TRACK-HD. Results are Number or Number (%).
Table 3: Summary of baseline characteristics of early-HD participants in TRACK-HD, and associations with medication use at visit 1. Results are Number (%) unless otherwise specified.
3.2 Effects of medication on clinical performance measurements.
In the reporting of the results we focus not only on statistical significance but also on the magnitude and direction of the association between medication use and the measures of performance. In particular we consider the impact of adjustment for potential confounding by prior medication use, prior performance measures and use of other medications on the direction of the association.
Motor
The estimated associations between medication use and performance on motor tasks are shown in Table 4 (higher scores represent a worse performance). After adjustment for baseline covariates only (Model 1), those using neuroleptics tended to have higher scores on UHDRS-TMS and Q-Motor tasks than those not using neuroleptics. The difference was statistically significant (p-value <0.05) for the UHDRS-TMS, its oculomotor and bradykinesia sub-scores, and for grip force variability, and chorea orientation and position indices. One reason for these results may be that individuals with worse disease status were more likely to take neuroleptics. In Model 2 we made additional adjustment for prior medication use, use of other medications, and prior performance measures, in addition to the baseline variables. In the results from Model 2 we see a reversal of the direction of the association between medication use and some measures of motor performance, in particular for UHDRS-TMS, UHDRS chorea sum score and grip force variability, compared with the results from Model 1. After conditioning on prior medication use, use of other medications, and prior performance measures in addition to baseline covariates, those using neuroleptics had significantly lower UHDRS chorea sum score compared to non-users and total motor score and grip force variability were also slightly improved compared with non-users, though these differences were not statistically significant. The associations between neuroleptic use and other motor and Q-motor performance measures were reduced to approximately zero under Model 2, with the exception of the UHDRS oculomotor sum score, for which the association under Model 2 is the same direction as that under Model 1, but the association is no longer statistically significant. Differences in the results found under Models 1 and 2 are indicative of the existence of arrows between and
and between
and the other variables as shown in Figure 1.
Accounting for missing data using multiple imputation does not have a material impact on the estimate coefficients, although the association between the chorea score and neuroleptic use is weaker and no longer statistically significant.
In Model 1, which adjusts only for baseline covariates, we found positive and statistically significant associations between use of SSRI/SNRIs and several of the measurements of motor performance. All but one of these statistically significant associations disappeared after adjustment for the further variables under Model 2. The speeded tapping mean inter-tap interval remained significantly higher in SSRI/SNRI users, all else being equal, though this association disappeared after accounting for missing data.
Table 4: Associations between medication use and performance on motor tasks and Q-Motor tasks using Model 1 (adjusted for baseline covariates only – sex, disease group, age, CAG, study site, education) and Model 2 (fully adjusted – for baseline covariates, prior medication use, use of other medications, prior performance measures). The models were first fitted on complete cases with no dropout or other missing data (N). Model 2 was then fitted by using multiple imputation to impute missing data.
Cognition
The estimated associations between medication use and cognitive scores are shown in Table 5 (higher scores represent a better performance). After adjustment for baseline variables under Model 1, users of neuroleptics had statistically significantly worse performance on all of the cognitive tasks compared with non-users. After adjustment for prior medication use, use of other medications and prior performance measures using Model 2, the associations are in the same direction but are very substantially weakened and rendered non-statistically significant.
Under Model 1, users of SSRI/SNRIs tended to have worse performance on four of the five cognitive tasks, though only one of the associations is statistically significant (Indirect Circle Tracing). After additional adjustment under Model 2, the significant association with indirect circle tracing is no longer evident. For two of the measures, the direction of the association with SSRI/SNRIs is reversed under Model 2. Handling of the missing data using multiple imputation does not materially change the results, though the negative, albeit non-statistically significant, association between SSRI/SNRIs and performance on the Stroop task is markedly attenuated.
Table 5: Associations between medication use and performance on cognitive tasks using Model 1 (adjusted for baseline covariates only – sex, disease group, age, CAG, study site, education) and Model 2 (fully adjusted – for baseline covariates, prior medication use, use of other medications, prior performance measures). The models were first fitted on complete cases with no dropout or other missing data (N). Model 2 was then fitted by using multiple imputation to impute missing data.
Emotion recognition
The estimated associations between medication use and emotion recognition scores are shown in Table 6 (higher scores represent a better performance). Under Model 1 which adjusts only for baseline covariates, neuroleptic users had worse performance on all emotion recognition tasks, and several of these associations were statistically significant. The direction of the association remained the same under Model 2 except for ‘happiness’, although became weaker on the whole. Similar results were found after accounting for missing data and three of the associations (neutral, sadness, surprise) remained borderline statistically significant. This provides some evidence that use of neuroleptics may impair emotion recognition.
There was no evidence of any association between use of SSRI/SNRIs and emotion recognition.
Table 6: Associations between medication use and emotion recognition scores using Model 1 (adjusted for baseline covariates only – sex, disease group, age, CAG, study site, education) and Model 2 (fully adjusted – for baseline covariates, prior medication use, use of other medications, prior performance measures). The models were first fitted on complete cases with no dropout or other missing data (N). Model 2 was then fitted by using multiple imputation to impute missing data.
Neuropsychiatry
The estimated associations between medication use and neuropsychiatry scores are shown in Table 7 (higher scores represent a worse performance). Adjusting only for baseline variables (Model 1), those taking neuroleptics had significantly higher (worse) apathy scores, but this disappeared after adjustment for prior medication use, use of other medications, and prior performance measures under Model 2. Neuroleptic use was associated with less depression as measured by the HADS total score. This improvement was in fact stronger and statistically significant under Model 2 compared with Model 1, and the effect remained strong and of borderline statistical significance after accounting for missing data.
After adjustment for baseline variables (Model 1) users of SSRI/SNRIs had worse scores for apathy, affect, irritability and total behaviour. However, after adjustment for confounding by prior medication use, use of other medications, and prior performance measures using Model 2, the direction of these associations was reversed, and the scores for apathy, affect and total behaviour were found to be statistically significantly lower in SSRI/SNRI users. The associations with apathy and total behaviour scores remained borderline statistically significant after accounting for missing data. The scores for affect and irritability were in the expected direction but not statistically significant.
Note that under Model 2 we adjusted for use of the other medication type in the models for neuroleptics and SSRI/SNRIs. Therefore the observed associations are independent of use of the other medication. Neuroleptic use was therefore associated with a borderline statistically significant lower (i.e. better) total HADS score independently of use of SSRI/SNRIs. Similarly, use of SSRI/SNRIs was associated with borderline statistically significant lower (i.e. better) scores for apathy and total behaviour independently of neuroleptics use.
Table 7: Associations between medication use and neuropsychiatry scores using Model 1 (adjusted for baseline covariates only – sex, disease group, age, CAG, study site, education) and Model 2 (fully adjusted – for baseline covariates, prior medication use, use of other medications, prior performance measures). The models were first fitted on complete cases with no dropout or other missing data (N). Model 2 was then fitted by using multiple imputation to impute missing data.
4. Discussion
Using 36 months of data from early HD participants in TRACK-HD, we have studied associations between neuroleptics, SSRIs and SNRIs and performance on motor, cognitive and neuropsychiatric assessments. Our aim was to investigate whether therapies that are widely used in the symptomatic management of HD were likely to have concomitant effects not only on the symptom for which they were prescribed, but also for other endpoints. We adopted a statistical approach making use of the longitudinal nature of the data, using up to date methods and thinking on causality, accounting for prior medication use, use of other medications and prior clinical performance as potential confounding variables. In doing so, our aim was to come closer to a causal interpretation for estimated associations between use of medications and measures of clinical performance.
In the TRACK-HD cohort, the prevalence of SSRI/SNRI use was almost double that of neuroleptics at baseline, but use of neuroleptics increased at a greater rate during the 36 months of the study. Nevertheless, the type of medication was consistent from one study visit to the next in over 80% of cases, i.e. there were a higher number of new cases for neuroleptics, but once a participant was taking either neuroleptics or SSRI/SNRI it was probable that they would continue on the same medication until the next visit. Neuroleptic use at baseline was significantly greater in Paris participants, which may be due to regional or local prescribing practices, but there was no association between neuroleptics and disease stage. In contrast, use of SSRI/SNRIs was significantly more likely in those with stage 2 disease, with over half of participants in this group prescribed SSRI, SNRI or both, and use was consistent across sites.
Without adjustment for prior medication use and prior clinical performance, medication use was typically associated with worse concomitant outcomes on a number of measures, even after adjustment for demographic factors and disease severity; this at least in part reflects the fact that sicker patients tend to receive more medication. After adjustment for prior clinical performance, prior medication use and concomitant use of other medications many (but not all) of these “inverse” associations between medication use and clinical performance were eliminated. That is, participants who were taking neuroleptics at the time of assessment, tended to have better motor performance, poorer cognitive performance, and better affect; those taking SSRI/SNRIs had less apathy, less affect and better total behaviour scores. However, with the exception of the improvement in neuropsychiatric scores, we did not uncover many statistically significant associations.
Associations between neuroleptics and motor performance were particularly sensitive to adjustment for prior medication use, use of other medications, and prior performance measures. After adjustment for baseline variables only (sex, disease group, age, CAG, study site, education), those using neuroleptics had significantly worse motor performance. Ideally, neuroleptics are prescribed taking the risk-benefit into account where the benefit in reducing chorea is thought to outweigh the risks and other motor side effects. It is possible that neuroleptics were associated with a worsening of some motor symptoms even if there is an improvement in chorea. When the additional variables were taken into account we unveiled a statistically significant improvement in chorea in those taking neuroleptics and a tendency for improvement in grip force variability. However, the former result was non-significant after accounting for missing data, and there were no other measurable improvements compared to non-users. We note that we were not examining one agent in isolation and it is possible that some of the 18 different neuroleptics included here were less efficacious than others.
A limitation of this investigation, and likely an important reason why we did not find stronger associations, is the relatively small sample size, in particular relative to the number of variables adjusted for in order to account as far as possible for confounding using the data available. Furthermore, we must consider the possibility of unmeasured confounding. We cannot exclude the possibility that there are additional variables which confound the association between medication use and the clinical performance measures. For example, uncontrolled confounding may arise because participants within the neuroleptic or SSRI/SNRI groups differ in the severity of their symptoms or rate of disease progression, and thus their need for or response to medication, in a way not accounted for by the variables included in our analyses. Potential errors in measurements of clinical performance are a further limitation of this investigation and may have resulted in bias in our results, probably towards the null. Without additional information on any potential measurement errors it was not possible to make corrections for this. We were also lacking information on the reasons why a given medication was prescribed for a particular individual. Confounding may also occur because we cannot assume that neuroleptics were always prescribed for motor indications such as chorea. This may be broadly correct in a cohort of early HD participants such as those in TRACK-HD, but any HD group is also likely to contain at least some individuals who were prescribed neuroleptics for behavioural indications, especially irritability and aggression. In these cases the possible impact of a given medication on motor function is likely to be seen as a necessary consequence of controlling the antisocial behaviour. Although we collected information about indication during TRACK-HD, this was not standardised across sites until the 24-month visit and the data is therefore not considered suitable for this analysis. We had some limited information on duration of medication use, however it was not deemed appropriate to investigate the effects of duration of use given the quality of the data on this and the sample size.
In this investigation we studied the association between concomitant medication use and performance measures, with careful adjustment for confounding. The sample size was not sufficient to allow a more complex investigation into the impacts of longer term medication use on clinical performance. We also did not use information on individual medication doses or duration of use.
We had expected the association between medication and motor aspects of HD to be the easiest to demonstrate because it is arguably the most well documented to date. Current understanding of cognitive decline is largely focused on improving methods for measuring the earliest signs of onset and subsequent longitudinal change2,29. However, the direction of the associations we estimated did not contradict clinical observations that neuroleptics have an adverse impact on cognition, and the pattern of results for SSRI/SNRIs was broadly similar. As with the associations with motor performance, it is possible that we have not been able to uncover a statistically significant association due to the sample size or the large number of adjustment variables used under Model 2. However, as cognitive aspects of HD are less well documented, it is also possible that the association between neuroleptic or SSRI/SNRIs use and improvements in cognition in early HD is in reality not that strong.
After adjustment for baseline variables (Model 1) users of SSRI/SNRIs had worse scores for apathy, affect, irritability and total behaviour. However, after adjustment for confounders using Model 2, the direction of these associations was reversed, and the scores for apathy, affect and total behaviour were found to be significantly lower in SSRI/SNRI users. The associations with apathy and total behaviour scores remained borderline statistically significant after accounting for missing data. The scores for affect and irritability were in the expected direction but not statistically significant. This shows that with appropriate adjustment for confounding we can uncover anticipated associations between medication use and task performance.
Previous findings from TRACK-HD suggest that effects of medications on emotion recognition may need to become a relevant consideration in the pharmacological treatment of people with HD9. Similarly we showed here that neuroleptic use was associated with poorer recognition across the range of facial emotions, although only recognition of neutral and sad faces survived correction for confounding variables under Model 2, and we did not replicate the improvement seen previously in this dataset in SSRI/SNRI users. However, it is relatively well-established that emotion recognition, in particular recognition of negative emotions of disgust and anger30, are already impaired in HD so it is possible that additional deterioration in these emotions was difficult to measure in our sample after rigorous adjustment for confounding.
Previously in TRACK-HD, we have reported a consistent longitudinal increase in apathy in early HD relative to controls and have argued that this may be more easily observed than other neuropsychiatric symptoms such as depression and irritability as the latter are more treatable and therefore attenuated by pharmacological interventions2. Adjusting for baseline variables only, those taking neuroleptics had significantly worse apathy, which would be expected. However, this association was no longer present after adjustment for confounding variables. More surprisingly, we were not able to show from the current analysis that neuroleptics have any effect on irritability or aggression scores. This suggests that the number of participants in TRACK-HD with these indications may have been too few for the effect to be detectable. Interestingly, a significant decrease in the HADS score indicating an improvement in depression was observed under Model 2. Of further interest is that after adjustment for confounders using Model 2, scores for apathy and total behaviour were lower in SSRI/SNRI users, with borderline statistical significance, and scores for affect and irritability were in the expected direction but non-statistically significant after accounting for missing data.
Although, in general, associations between medication and performance of motor, cognitive and neuropsychiatric assessments were evident, the extent to which correction for confounding variables played a part in these associations varied between domains. In the case of motor performance, the direction of the association was reversed under Model 2 and became more clinically plausible, whereas the cognitive results were weaker after correction for potentially confounding variables. As discussed above this may reflect the strength of the original association as well as our sample size relative to the number of variables used in the statistical model, and the possibility of unmeasured confounding. The selection of variables for Model 2 should also be reviewed as there is some danger that the arguments become cyclic. For example, the relationship between TFC and our clinical measures is not necessarily causal. While it is conceivable, for example, that neuropsychiatric symptoms such as apathy and irritability, particularly if combined with cognitive decline, increase in response to loss of function, medication for neuropsychiatric symptoms may also directly impair functional capacity.
Despite using sophisticated statistical methods within a well-designed and controlled study, it has not been possible to establish completely clear findings regarding the impact of medication and performance in the various domains studied. Our interest was in the causal effects of medication, but medications are prescribed with the hope of improving physical and neurological manifestations of the disease so the outcomes of interest (motor scores, etc.) are in turn expected to affect medication. We used the longitudinal nature of the data to address this issue, though the potential for unmeasured confounding still remains. It would also be of interest in future investigations to consider duration of use. Ideally, the effects of medication use on performance in the domains studied in this paper would be investigated using double-blind, randomised, long-term studies assessing various treatment strategies. However, large observational data sets provide the possibility of performing such investigations, with due consideration given to the possible impact of unmeasured confounding, where randomized controlled trials have yet to be performed.
5. Supporting Information
Supplementary Table 1: Drugs whose use was reported among early-HD participants in TRACK-HD according to their classification as neuroleptics, SSRI or SNRI.
Supplementary Table 2: Summary of missing data among early-HD participants in Track-HD.
INTRODUCTION
Huntington disease (HD) is a genetic neurodegenerative disorder characterized by choreiform movements, progressive cognitive decline and inexorable progression to death 15-20 years from the time of onset. Although the genetic cause of HD, Huntingtin (Htt), is expressed not only in neural cells but also in other tissues, the primary site affected in this pathology include several brain regions. Besides the cortex, cerebellum and thalamus, one of the hallmark of the disease is the loss of neuronal cells in the striatum (caudate and putamen), with selective damage to the GABAergic medium spiny neurons1. Molecularly, HD is caused by the CAG expansion in exon 1 of the IT15 gene encoding a polyglutamine stretch (polyQ) in the amino-terminal region of the Htt2. The polyQ tract begins at the 18th amino acid of Htt and contains 11–34 glutamine residues in unaffected individuals, but expands to various lengths in HD patients. The number of the CAG repeats in the gene inversely correlates with the age of onset3: a length ranging from 40 to 50 Qs is associated with adult onset, whereas expansions exceeding 60 Qs occur in the juvenile onset. Interestingly, even if Htt is ubiquitously expressed in human tissues, its mutation is specifically harmful to striatal neurons. The reason of this selective damage is not completely understood, reflecting the incomplete knowledge of the function of Htt itself. However, the protein is known to play an essential role during development, as the deletion of its gene is embryonic lethal4, and is claimed to participate in different cell functions like axonal transport, exocytosis and Ca2+ homeostasis5,6. Thus, Htt mutations could cause dysfunctions in one or more of these processes, contributing to HD aetiology. The extended polyQ tract is cleaved off by various caspases, calpain and other proteases. The cleaved off fragments have strong tendency to polymerize forming aggregates, whose role is debated. A possible damaging role could result from the sequestration of essential factors, e.g. transcription factors or calmodulin, whereas a positive role could be the binding and hence neutralization of monomeric Htt fragments, which are likely to be the damaging species. Pathological Htt (mHtt) fragments have been found in the nucleus7, where they may damage neurons by a transcriptional mechanism. Bioinformatics analysis that compared gene expression profiles (archived in public databases) in different HD cell models has highlighted the up-or downregulation of Ca2+ related genes8. It has also been reported that changes in the expression levels and activity of components of the Ca2+ handling toolkit9,10 and of the respiratory chain (ETC) occur in some HD models11,12,13.
Defective mitochondria, which are key players in the maintenance of intracellular Ca2+ homeostasis, have also been involved in the pathogenesis of HD. In particular, the involvement of ETC defects, more specifically of complex II, is supported by the finding that administration of the specific inhibitor of complex II 3-nitropropionic acid (3-NPA) induces a degeneration of rat striatal neurons that mimics that seen in the disease14. Even if mitochondrial dysfunction is considered important in the molecular aetiology of HD15,16,17, it is still not understood whether it results from transcriptional effects or whether non-transcriptional effects could also play a role. Transcriptional effect of mHtt have been repeatedly reported18,19,20,21, however non transcriptional effects of mHtt probably mediated by interactions with other proteins have also been claimed22,23 (and see Table I).
Binding of the wt (wtHtt) and mutated (mtHtt) Htt to proteins including those of the Ca2+ handling system.
Protein name
Technique
mHtt wtHtt
Calretinin
Tandem affinity purification
mHtt
Calmodulin
Affinity chromatography
both
InsP3R
Co Immunoprecipitation assay
both
VDAC2
Yeast two-hybrid screening and mass spectrometry
wtHtt
PACSIN 1
Co Immunoprecipitation assays
both
HAP1
Yeast two-hybrid screening
both
Ca2+ dyshomeostasis is also frequently considered as a factor in the aetiology of HD. Ca2+ signaling is crucial for a number of neuronal activities and also for the development and maintenance of neuronal circuits24,25. The dysfunction of Ca2+ homeostasis associated to HD could also be due either to transcriptional or non-transcriptional defects. As an example, the increased binding of mHtt to the Inositol-1,4,5-trisphosphate receptor (InsP3R) has been related to a possible enhancement of Ca2+ release from the endoplasmic reticulum (ER)26: in principle, the increased exposure of mitochondria to Ca2+ released from the vicinal ER could exacerbate their dysfunction, even if a complex II defect would limit the functioning of the respiratory chain and consequently the ability of mitochondria to accumulate Ca2+27. However, the Htt effects on mitochondrial Ca2+ homeostasis appears to be more complicated, as increased mitochondrial Ca2+ uptake has been reported in other HD models8,9,15.
The aim of this work was to study the effects of the Htt fragments on Ca2+ homeostasis in a commonly used HD cell model, i.e. an immortalized striatal precursor cell line (Q7/7)28. Immortalization of these striatal precursors maintains most of the important processes of primary brain cells and has allowed the identification of a number of effects of the Htt fragments. We have previously shown that in these neuronal precursor cells Ca2+ transients could be generated by the stimulation with the InsP3 linked agonists, e.g. the purinergic agonist ATP, or bradykinin10. Here, we have transiently transfected the Q7/7 cells with a set of plasmids carrying the first exon of the IT15 gene, containing either 18 (wt, wtHtt) or 150 (mHtt) CAG repeats, and have monitored the changes of [Ca2+] with aequorin targeted to the mitochondrial matrix or to the cytoplasm. Ca2+ transients were induced by the InsP3-linked agonist ATP. The data have shown that the overexpression of either the 18Q or the 150Q Htt fragments enhanced mitochondrial Ca2+ transient with respect to controls, i.e. the Q7/7 cells only overexpressing the red fluorescent protein Kate and the Ca2+ probe aequorin. Consistent with the results of Fernandes and coworkers61, the expression of the fragments had no effect on the bulk cytosolic Ca2+ transients, whereas the ER Ca2+ content, evaluated by means of a probe specifically targeted to its lumen, showed a lower value in cells expressing the 150Q fragments.
A number of studies have reported transcriptional effects already occurring a few hours after the induction of mHtt expression19,29,30. Considering the long turnover times of mitochondrial proteins, e.g. the respiratory chain components31, the occurrence of transcriptional effects induced by our protocol on mitochondria was unlikely. We nevertheless decided to verify their possible occurrence. A thorough transcriptomic analysis such as that described in32 was beyond the scope of this article, thus we focused on a representative gene, subunit A of complex II (SDHA), whose expression was found altered in many HD model cells27,33. In our experimental protocol, no changes of the transcript for SDHA were detected, indicating that the overexpressed Htt fragments had no transcriptional effects and suggesting that they affected Ca2+ homeostasis by a non-transcriptional mechanism.
MATERIALS AND METHODS
Plasmids construction
Wild-type (18Q) and mutant (150Q) cDNA of human IT15 exon 1 gene, encoding the N-terminal (1-90) region of the Htt protein, have been obtained by PCR amplification using as template the plasmid pIND-HD exon 1- EGFP 150Q (Wang, 1999) and the following primers, inserting the EcoRV and BamHI at the 5’- and 3’-ends, respectively: For (5’-CTCTAGATATCATGGCGACCCTGGAAAAGCTG-3’); Rev (5’-GTGGATCCGGTCGGTGCAGCGGCTCCTCAGC¬-3’). Since the intrinsic instability of CAG repeats, a series of PCR products of different size have been obtained, and the fragments carrying 18 and 150 Qs have been specifically selected and purified after agarose gel separation. Upon EcoRV/BamHI endonuclease digestion, DNA fragments have been cloned into the Kate-pcDNA3.1 plasmid digested with the same enzymes, giving recombinant vectors able to express in mammalian cells the Htt18Q- and Htt150Q-exon1 proteins fused at their C-terminus with the red fluorescent protein Kate. All the constructs have been finally verified by sequencing.
Cell culture and transfection
Clonal striatal cell lines established from E14 striatal primordial of WT-HdhQ7 littermate mouse embryos (Q7/7) were used28. The cells were grown in Dulbecco’s modified Eagle’s medium High Glucose (DMEM, Euroclone), supplemented with 10% fetal bovine serum (FBS, Euroclone), 100 U/ml penicillin and 100 mg/ml streptomycin (Euroclone), and maintained at the permissive temperature (33°C) in a humidified incubator with 5% CO2. 24 h before transfection, cells were seeded onto 13 mm (for aequorin measurements and RT-PCR experiments) or 24 mm (for FRET analysis) glass cover slips and allowed them to grow to 70–80% confluence.
For Ca2+ measurements and RT-PCR experiments, Q7/7 cells were co-transfected with the cDNA encoding the red fluorescent protein Kate, representing our control, or with a cDNA encoding for exon 1 of the Htt gene containing 18Q or 150Q (both fused with Kate) together with the cDNA coding for the aequorin Ca2+ probe targeted to the mitochondrial matrix (mtAEQ) or to the cytoplasm (cytAEQ) in a 1:2 ratio. For FRET analysis, Q7/7 were co-transfected with the red fluorescent protein Kate or 18Q, 150Q expressing plasmids with ERD1 (R.Y. Tsien, UCSD, CA)34 in a 1:2 ratio. Transfection was performed with the calcium-phosphate procedure, as previously described in35, or by using Lipofectamine (Invitrogen) according to the manufacturer’s instruction. Experiments were performed 48h after transfection. The expression and correct cellular localization of Htt fragments were analyzed by fluorescence procedures as reported in Fig.1.
Aequorin Measurements
Mitochondrial aequorin (mtAEQ) and cytosolic aequorin (cytAEQ) were reconstituted by incubating cells with 5 µM wt coelenterazine (Invitrogen) for 1 h in Krebs Ringer modified buffer (KRB, 125 mM NaCl, 5 mM KCl, 1 mM Na3PO4, 1 mM MgCl2, 20 mM HEPES, 5,5 mM glucose, pH 7.4, 37°C)-containing 1 mM CaCl2 and then transferred to the perfusion chamber of a purpose-built luminometer. Ca2+ measurements were started in the KRB medium added with 1 mM CaCl2, and after 30 sec 100 µM ATP (Sigma) was added as indicated in the Figs. 2, 3. All the experiments were terminated by cell lysis with 100 µM digitonin (Sigma) in a hypotonic Ca2+-rich solution (10 mM CaCl2 in H2O) to discharge the remaining reconstituted active aequorin pool. The light signal was collected and calibrated off-line into Ca2+ concentration values, using a computer algorithm based on the Ca2+ response curve of wt and low affinity aequorin as previously described36.
ER Ca2+ measurement with the ERD1 Ca2+ probe
Cells expressing the fluorescent probe ERD1 were analyzed using an inverted fluorescence microscope (Olympus lX-81) with an immersion oil objective 60× UPLAN FLN (NA 1.25; Olympus, Tokyo, Japan). Excitation light at 425 nm was produced by a monochromator. The emitted light was collected through a beam splitter (Multi Spec Micro-Imager; Optical Insights; emission filters 480 ± 15 and 545 ± 20 nm) and a 505 nm dichroic mirror. Images were collected by means of the Cell R imaging software (Olympus) and analyzed with ImageJ. FRET Ratio have been calculated according to the formula: YFP (background corrected)/CFP(background corrected).
RNA isolation and reverse transcription PCR experiments
mRNA for SDHA and for the isoforms of Ryanodine receptor (RyR) were detected by the RT-PCR. Transfected and untransfected cells were washed three times with cold phosphate-buffered saline and collected using TRIzol reagent (Invitrogen). Total RNA was extracted, according to the manufacturer’s protocol, and 1 µg of total RNA was reverse-transcribed using a Superscript III reverse transcriptase (Invitrogen). An amount of cDNA corresponding to 1–10 ng of total RNA was amplified in 25 µl of a mixture containing 12.5 µl of Platinum SYBR Green qPCR SuperMix-UGD (Invitrogen), 2 µl of primers mixture (2.5 µM each). The PCR cycling parameters were: 94 °C for 7 min, 45 cycles of 94 °C for 30 s, 55 °C for 30 s, and 72 °C for 15 s. The used primers have the following sequences: SDHA forward, AGGCTTGCGAGCTGCATT; reverse, AATGCCATCTCCAGTTGTCC; RyR1 forward, CGAGAGGCAGAACAAGGCAG; reverse, GGTCCTGTGTGAACTCGTCA; RyR2 forward, GGAAGAAAATGAAGCGGAAA; reverse, AGGGGCACAGATGTTCAGTC; RyR3 forward, GGCCAAGAACATCAGAGTGACTAA; reverse, TCACTTCTGCCCTGTCAGTTTC; GAPDH forward, CAAGGTCATCCATGACAACTTTG; reverse, GGGCCATCCACAGTCTTCTG.
Statistical analysis
All of the data are representative of at least ten different experiments unless otherwise indicated. Values are expressed as mean ± SEM. Statistical significance was determined using the Student’s t test. *p < 0.05; **p < 0.001; **** p<10-5, Student’s t-test.
RESULTS
Localization of Htt fragments in Q7/7 cells
To study the effects of Htt fragments on intracellular Ca 2+ homeostasis plasmids carrying the cDNAs of exon 1 of Htt, coding for either 18Q or 150Q fused to the red fluorescent protein Kate were used. As a control we transfected cells with only the plasmid encoding the Kate fluorescent protein. Fig. 1 shows that the cells overexpressing only the Kate protein (Fig. 1A) and those overexpressing the 18Q Htt fragment (Fig. 1B) had homogeneous staining in the cytoplasm. However, aggregate-like structures with particularly high fluorescence intensity could be detected in some cells expressing either the 18Q (Fig. 1C) or the 150Q fragment (Fig. 1D,E), suggesting that the strong overexpression of wtHtt somehow favored the formation of aggregates, mimicking what occurs in case of mHtt. These aggregates were similar to those observed in other HD cell models37,38,39.
Fluorescence images of Q7/7 cells transfected with the cDNA of the fluorescent protein Kate (A) or of Htt exon 1 containing either 18Q (B,C) or 150Q (D,E). Some of the cells overexpressing 18Q fragments show the presence of aggregate like structures which are more frequently found in 150Q expressing cells (as indicated by arrows).
Fig. 1: Expression and subcellular localization of Htt fragments in Q7/7 cells
Mitochondrial Ca2+ transients in cells overexpressing Htt fragments
Impairment of various aspects of the Ca 2+ uptake/extrusion system of mitochondria has been repeatedly described in HD model cells40,41, but the issue is still controversial. We have analyzed the effects of Htt fragments on mitochondrial Ca 2+ handling by studying them in Q7/7 cells co-expressing the Ca 2+ sensitive probe aequorin targeted to the mitochondrial matrix35 along with Htt exon 1 carrying either 18Q or the 150Q repeats. The cells were then challenged with the purinergic InsP 3 -linked agonist ATP in the presence of extracellular Ca 2+ to induce Ca 2+ release from the ER as well as Ca 2+ entry from the extracellular medium. Fig. 2 shows that the Ca 2+ transients were significantly higher in the mitochondria of cells overexpressing either the 18Q (Fig. 2B) or 150Q (Fig. 2C) – containing fragments than in controls (Fig. 2A) (average of peak values, Fig. 2D: 82.98 ± 5.18 µM in control Q7/7 cells, n=40; 124.58 ± 6.71 µM in Q7/7 cells overexpressing the 18Q fragment, n=38 p<6.0410-6; 114.70 ± 6.24 in Q7/7 cells overexpressing the 150Q fragment, n=35 p<2.1*10-4). No significant difference was detected between 18Q and 150Q, suggesting that the observed effect on the mitochondrial Ca 2+ transient was unrelated to the length of the polyQ stretch.
Representative traces of Q7/7 cells challenged with ATP expressing mitochondrial aequorin and: A) the Kate protein, B) 18Q fragment, C) 150Q fragment. D) Average of mitochondrial [Ca 2+ ] peaks (20 independent experiments; **** p<10-5, Student’s t-test).
Fig. 2: Mitochondrial Ca2+ handling in Q7/7 cells overexpressing Htt fragments
The Htt fragments affect the ER Ca2+ level but not cytosolic Ca2+ transients
To understand whether the increased mitochondrial Ca2+ transients in 18Q and 150Q- overexpressing cells were linked to alterations of the global cytosolic Ca2+, the cells were transfected with cytAEQ36 and then challenged with ATP. As shown in Fig. 3 the overexpression of the Htt fragments (Fig. 3B, C) had no effect on the global cytosolic Ca2+ transients induced by the stimulation (average peak values, Fig. 3D: 1.99 ± 0.45 µM in control Q7/7 cells, n=22; 2.15 ± 0.19 µM in Q7/7 cells overexpressing the 18Q fragment, n=15; 1.95 ± 0.24 in Q7/7 cells overexpressing the 150Q fragment, n=15).
Representative traces of Q7/7 cells challenged with ATP expressing cytosolic aequorin and: A) the Kate protein, B) 18Q fragment, C) 150Q fragment. D) Average of cytosolic [Ca2+] peaks.
Fig. 3: Cytosolic Ca2+ transients are not affected by the overexpression of Htt fragments
We therefore turned our attention to the main intracellular Ca2+ store, the ER: mitochondrial Ca2+ uptake senses Ca2+ released from the ER to generate microdomains of high Ca2+ concentration in close proximity of mitochondria42,43. We decided to measure the luminal Ca2+ content of the ER in the three Q7/7 cell populations (i.e. controls, 18Q, 150Q) to correlate the observed mitochondrial Ca2+ transients to possible changes in the ER Ca2+ levels. The ER-directed FRET based Cameleon ERD134. This probe consists of two fluorescent proteins (a brighter and less pH sensitive version of YFP known as cpVenus and CFP) fused in tandem with a modified version of the Ca2+ binding protein Calmodulin. Binding of Ca2+ to the probe results in a conformational change of D1ER that brings together the two fluorophores allowing FRET to occur. Ca2+ concentration is therefore proportional to the increased FRET Ratio. Our experiments revealed that cells expressing the 150Q fragment had lower levels of Ca2+ in the ER than those expressing 18Q or the controls (Fig 4). These results are in line with the findings by Tang et al26, who had shown that mHtt interacts with the InsP3R to modulate its Ca2+ leak activity.
Panels A-D: Typical images of Q7/7 cells coexpressing Kate and the Ratiometric Ca2+ probe ERD1. Panels E-H: Typical images of Q7/7 cells coexpressing 18QKate and the Ratiometric Ca2+ probe ERD1. Panels I-L: Typical images of Q7/7 cells coexpressing 150QKate and the Ratiometric Ca2+ probe ERD1. Per each cell type, a representative image is reported for the two channels composing the FRET probe, CFP and YFP, as well as their merge. The Ratio value (proportional to the ER Ca2+ concentration) has been calculated as specified in the Material and Methods section and in34. Panel M: The histogram reports the Ratio values measured in resting conditions of Q7/7 cells coexpressing the three Kate fluorescent proteins and ERD1. The 150Q fragment displayed reduced levels of Ca2+ in the ER, with respect to 18Q or Kate. (Average of 3 independent experiments; * p<0.05, Student’s t-test).
Fig. 4: mHtt fragments affect the ER Ca2+ level
ER Ca2+ is released by InsP3R
To support the idea that in our cell model, the alteration of mitochondrial and ER Ca2+ was related to action of Htt on InsP3R rather than on other (ER) Ca2+ release channels, i.e., the Ryanodine receptor (RyR), we explored the expression levels of the three isoforms of RyR (RyR1, RyR2 and RyR3) in Q7/7 cells. Interestingly, we found that these cells do not express any isoform of RyR (Fig. 5, cerebellar granule neurons (CGN) and Hela cells were used as positive and negative controls, respectively). Thus, Ca2+ was released from the ER of Q7/7 uniquely through the InsP3R.
RT-PCR analysis of RyRs transcripts. Expression of RyRs in Q7/7 cells. Cerebellar granule neurons (CGN) and Hela cells were used as positive and negative control respectively. The results are normalized with respect to positive control.
Fig. 5: RT-PCR analysis of RyRs transcripts
Overexpression of Htt fragments does not affect the transcription of SDHA
Even if the protocol used was unlikely to produce transcriptional effects on mitochondrial membrane proteins; however others have been suggesting the possibility of early transcriptional defect in HD cell models62. To rule out the possibility of transcriptional effects we decided to verify if this was indeed so in the Q7/7 overexpressing the 18Q and 150Q fragments in our transient expression experiments. We focused on SDHA since its expression is commonly down regulated in HD model cells12,13,44. RT-PCR analysis (Fig. 6) revealed that the overexpression of the Htt fragments failed to alter the levels of SDHA transcripts. As mentioned above, this was not surprising, as most of the mitochondrial proteins have a low turnover rate31. Therefore, the effects of the Htt fragments on Ca2+ homeostasis in the mitochondria here described are likely due to a non transcriptional mechanism.
RT-PCR analysis of the subunit A of the mitochondrial respiratory chain (SDHA) transcript . Expression of SDHA in Q7/7 untransfected (Q7/7) or transfected with the protein Kate, and the 18Q or 150Q fragments. These experiments have been performed after checking the quality of the retro-transcribed cDNA on agarose gel (not shown). The results are normalized respect to the housekeeping gene GAPDH.
Fig. 6: RT-PCR analysis of the subunit A of the mitochondrial respiratory chain (SDHA) transcript
DISCUSSION
The involvement of mitochondrial defects in the molecular aetiology of HD was suggested for the first time more than ten years ago, based on the evidence that 3-NPA, an inhibitor of complex II of the respiratory chain, was per se able to induce Htt-like symptoms14,45,46. A number of reports have then described defects in the morphology of mitochondria in HD model cells15,19,47,48,49. Impaired respiratory chain activity50,51 and abnormalities of mitochondrial Ca2+ handling have been described in most of the experimental HD models currently in use9,41,52, reinforcing the idea of a role for mitochondrial defects and Ca2+ dyshomeostasis in the development of the disease.
Opinions on the topic are divergent: some studies have claimed that mitochondria from HD model cells have increased propensity to depolarize and are more susceptible to Ca2+ overload, i.e. to the induction of the permeability transition (PTP)33,53,54. Other studies have reported opposite results, concluding that mHtt would instead lower the probability of PTP opening55,56. These discrepancies could be due to the use of isolated mitochondria, removed from the influence of the physiological context of intact cells, or to the use of stable cell lines which could develop adaptive mechanisms to compensate for the derangement of specific intracellular processes17,41. However, experimental outcomes obtained in primary striatal neurons carrying a pathogenic mHtt with 128Q show that PTP inhibitors significantly reduced NMDA-induced PTP opening61.
In previous work on stable clones of Q7/7 cells10, we had found that cells stably expressing a Htt stretch of 111Q were characterized by higher sensitivity of mitochondria to Ca2+ overload, and were more susceptible to the mitochondrial permeability transition, as also found by other groups9,33. Notably, the cell lines used in our previous work displayed extensive transcriptional changes, especially in the levels of InsP3-controlling enzymes which were mostly downregulated10. Thus, the alterations of Ca2+ homeostasis in the Q cell experimental model could be explained in two alternative ways: either by transcriptional effects of the stably expressed mHtt, or by a compensatory process that counterbalanced the enhanced response to stress of the mitochondria by altering the levels of intracellular Ca2+ pools. Accordingly, we and others had found that the amount of Ca2+ released upon stimulation of the cells with a cell permeable derivative of InsP310 or with the inhibitor of the ER SERCA pump cyclopiazionic acid15 was higher in cells expressing the mutated than in the wt counterparts.
This work has explored the direct effects of mHtt on Ca2+ homeostasis by using the wt neuronal striatal precursors Q7/7 transiently expressing the N terminal portion of Htt, either in a wt form (18Q) or carrying a pathologically extended polyQ stretch (150Q)). It had been shown by others that the expression of the N terminal portion of Htt is sufficient to cause acute neuronal toxicity57. The overexpression of the N terminal Htt fragments has allowed us to specifically explore the contribution of this portion of the protein to the production of Ca2+ handling defects observed in the presence of the pathogenic Htt forms.
Consistently with our previous published results comparing Q7/Q7 and Q111/Q111 immortalized striatal cell lines10, and also with a study of cytosolic Ca2+ handling in primary striatal neurons from a murine model of HD61 we have found no changes in the bulk cytosolic Ca2+ transients.
Further, in agreement with reports on isolated mitochondria41,55,56, we have detected higher Ca2+ peaks in these organells upon stimulation of cells expressing either the 150Q or 18Q exon 1 of Htt. Since cytosolic Ca2+ was not affected, the results were likely due to a direct action of the Htt fragments on the mitochondrial Ca2+ handling machinery or on the Ca2+ toolkit of the ER, that is responsible for the generation of Ca2+ hotspots in the proximity of mitochondria. The evidence that in our experiments both wtHtt and mHtt increased mitochondrial Ca2+ uptake, may suggest that the control of the mitochondrial functions involved in the sensing of the ER linked Ca2+ hotspots could be a physiological function of Htt per se, not specifically of mHtt. In this context, it is interesting that Htt has been found associated to the outer mitochondria membrane (OMM) by means of its N terminus33,58. Alternatively, the effects observed with wtHtt could be due to the fact that the presence of large amounts of it in the cells due to its overexpression could mimic the effects of mHtt, as suggested by the finding that some cells with large expression of wtHtt displayed aggregates (Fig.1C).
As to the ER Ca2+ handling, we have found decreased ER Ca2+ levels specifically in the case of mtHtt. As previously claimed, Htt interacts with the Htt associated protein (HAP1A) to form a complex with the InsP3R, promoting its opening26: i.e., the mutated form of Htt enhances the Ca2+ release through InsP3R. Recent evidence underlines the importance of the specific transfer of Ca2+ to mitochondria by InsP3R for cell bioenergetics59. The Insp3R generates mitochondrial Ca2+ hotspots on the OMM surface, that drive Ca2+ uptake in the mitochondrial matrix43,60. No studies have so far performed on the role of the mutated form of Htt on the transfer of Ca2+ between ER and mitochondria. Further studies on this aspect would be necessary to shed light on the mechanisms underlying Ca2+ dyshomeostasis in HD.
Competing Interests
The authors declare that there are no conflicts of interest.