Abstract
Red algae comprise an anciently diverged, species-rich phylum with morphologies that span unicells to large seaweeds. Here, leveraging a rich red algal genome and transcriptome dataset, we used 298 single-copy orthologous nuclear genes from 15 red algal species to erect a robust multi-gene phylogeny of Rhodophyta. This tree places red seaweeds (Bangiophyceae and Florideophyceae) at the base of the mesophilic red algae with the remaining non-seaweed mesophilic lineages forming a well-supported sister group. The early divergence of seaweeds contrasts with the evolution of multicellular land plants and brown algae that are nested among multiple, unicellular or filamentous sister lineages. Using this novel perspective on red algal evolution, we studied the evolution of the pathways for isoprenoid biosynthesis. This analysis revealed losses of the mevalonate pathway on at least three separate occasions in lineages that contain Cyanidioschyzon, Porphyridium, and Chondrus. Our results establish a framework for in-depth studies of the origin and evolution of genes and metabolic pathways in Rhodophyta.
Funding Statement
HQ would like to thank the National Science Foundation of the United States (https://www.nsf.gov/) for funding and support (EF-1416785). HSY and DB acknowledge the Marine Biotechnology Program (PJT200620) that is funded by Ministry of Oceans and Fisheries of Korea (http://www.mof.go.kr/). HSY wishes to thank the National Research Foundation of Korea (http://www.nrf.re.kr/) for funding and support (MEST: 2014R1A2A2A01003588). The funders had no role in study design, data collection and analysis, decision to publish, or preparation of the manuscript.Introduction
Red algae (Rhodophyta) form a monophyletic lineage containing ~7,000 described species1 that exhibit a wide variety of morphological and ultra-structural forms and have complex reproductive strategies. The Cyanidiophytina (e.g., Galdieria and Cyanidioschyzon) include extremophiles that thrive in volcanic areas surrounding hot springs. In contrast, their mesophilic sisters (Rhodophytina) are globally distributed from freshwater environments to open oceans and deep oceans (>200 m) to the intertidal zone. Despite a highly reduced core gene inventory that resulted from an ancient phase of genome reduction2, red algae represent one of the few eukaryotic lineages that have evolved complex multicellularity3, typified by red seaweeds such as Porphyra and Gracilaria. Red seaweeds account for ~95% of known red algal taxa and are important sources of agricultural (e.g., nori) and industrial products (e.g., agar and carrageenan).
Studies of red algal systematics have largely relied on a handful of plastid and nuclear genes4,5,6,7,8 and focused on a broad diversity of lineages within the Florideophyceae9,10. One of the major findings of these analyses is the separation of Cyanidiophytina from the Rhodophytina4,8. Whereas Cyanidiophytina contain only two known families (Cyanidiaceae and Galdieraceae), Rhodophytina encompass six classes: Bangiophyceae, Florideophyceae, Compsopogonophyceae, Porphyridiophyceae, Rhodellophyceae, and Stylonematophyceae4. Excluding the well-supported monophyly of Bangiophyceae and Florideophyceae (hereafter, collectively referred to as red seaweeds), relationships among the remaining classes remain controversial4,5,6,7,8.
In this study, we applied phylogenomics to a rich genomic dataset to erect a robust red algal tree of life. The dataset encompassed 298 orthologous nuclear-encoded genes from all major red algal lineages. In contrast to previous phylogenies built using smaller datasets4,5,6,7,8, our results support a fundamental, ancient split between red seaweeds and non-seaweed lineages among mesophiles. We discuss the implication of this new perspective on red algal phylogeny to understanding the evolution of multicellularity in red algae, and demonstrate the utility of this phylogenetic framework to infer the evolution of the mevalonate (MVA) pathway of isoprenoid biosynthesis in Rhodophyta.
Methods
Construction of single-copy orthologous gene alignments
We created a local database that includes protein sequences (translated from EST or predicted from genome sequences) from 15 red algal taxa2,11,12,13,14,15,16 (Fig. 1A) and 3 green algae17,18,19 (Table 1, Appendix 1). This database, after removing short sequences with length <100 amino acids, was used in a self-query using BLASTp (e-value cutoff = 1e-5). The BLASTp search output was used as input for OrthoMCL20 with parameters (evalueExponentCutoff = -10, percentMatchCutoff = 40, inflation = 1.5) to construct orthologous gene families. Among these families, we searched for single-copy orthologous genes with one gene copy per species (allowing missing data in up to three red algae and in no more than one green alga). For each orthologous gene family, the corresponding sequences were retrieved and aligned using MUSCLE (version 3.8.31) under the default settings21. The alignments were then trimmed using TrimAl (version 1.4)22 in automated mode (-automated) and then ‘polished’ with T-COFFEE (version 9.03)23 to removed poorly aligned residues (conservation score ≤ 5) among the aligned blocks. A total of 298 single-gene alignments (length >150 amino acids and with ≥15 sequences) were retained for downstream analysis.
Construction of the multi-protein phylogeny
The 298 single-copy gene alignments were concatenated into a super-protein alignment. A phylogenetic tree was inferred using Phylobayes (version 3.3)24 under the CAT model25. This is a mixture model that takes into consideration site-specific evolutionary properties (such as rate and profile) within the alignment25. The CAT model generally fits data significantly better than one-matrix models such as LG and WAG. We set up two chains that ran in parallel and assessed convergence periodically using ‘bpcomp’ and ‘tracecomp’ functions. Convergence assessments were done based on sampled trees (taking one from every 10 trees) following burnin equal to 20% of the entire length of the chain. The two chains were stopped when they converged to an acceptable level that allows good qualitative measurement of the posterior consensus. According to the user instructions (www.phylobayes.org/), an acceptable run corresponds to a maximum discrepancy across all bipartitions (maxdiff <0.3) when monitored with the ‘bpcomp’ function, and statistical discrepancies <0.3 and effective sizes >50 for all parameters when monitored with the ‘tracecomp’ function.
Construction of coalescence model-based species trees
We built a coalescence model-based red algal phylogeny with 100 replicates following Seo’s method26. For each replicate, we randomly sampled 298 genes with replacement. For each sampled alignment, a pseudo-alignment was generated by random sampling of amino acid site from the original alignment with replacement. Only one green algal sequence (as outgroup) was retained with the priority given to Chlamydomonas reinhardtii, Chlorella variabilis, and Micromonas RCC299 in order. A ML tree was built for each pseudo-alignment using IQtree (version 0.9.6)27 under the best-fit amino acid evolutionary model selected on the fly (-m TEST). The resulting 298 ML trees, rooted with outgroup sequences, were then used for maximum pseudo-likelihood tree construction using MP-EST (version 1.4) under the default settings28. This procedure was repeated 100 times and the resulting 100 maximum pseudo-likelihood trees were summarized under majority rule using the ‘consense’ function in Phylip (http://evolution.genetics.washington.edu/phylip.html).
Phylogenetic analyses of mevalonate pathway genes
Galdieria sulphuraria proteins in the MVA pathway (module identifier: M00095) and the methylerythritol phosphate (MEP) pathway (module identifier: M00096) were retrieved from the KEGG database29 and used as queries against NCBI (nr) using BLASTp (e-value cutoff = 1e-5) (http://blast.ncbi.nlm.nih.gov/Blast.cgi). The representative sequences (e.g., from Metazoa and land plants) were retrieved from Genbank. Local BLASTp searches (e-value cutoff = 1e-5) were done against our red algal database aforementioned followed by retrieval of the significant hits. Galdieria phlegrea sequences were retrieved from the previous study30. Each G. sulphuraria query, together with the homologs (from Genbank and our local database), were aligned using MUSCLE (version 3.8.31)21 under the default settings. The alignment was trimmed using trimAl (version 1.4)22 in the automated mode (-automated). ML trees were built using IQtree (version 0.9.6)27 under the best amino acid evolutionary model selected using (-m TEST) with branch support values estimated using 1,500 ultrafast bootstrap replicates (-bb 1500). The resulting trees were manually inspected. Distantly related paralogs (if any) were removed manually and the trees were rebuilt following the procedure described above.
Validation of gene losses in red algae
We searched for the G. sulphuraria MVA and MEP proteins in a red algal nucleotide database (genome and transcriptome) using tBLASTn (e-value cutoff = 1e-5). The homologous protein sequences translated from the hit nucleotide sequences were collected using an in-house script. For each query sequence, the translated proteins corresponding to the three top bit-score hits and the three top-identity (query-hit identity) hits were incorporated into the single-gene ML tree building procedure described above. Distantly related homologs were manually identified and removed. Red algal sequences that were monophyletic with G. sulphuraria were considered to be orthologs.
Results and Discussion
Red algal tree of life
We constructed single-gene alignments for a total of 298 one-to-one orthologous genes (98,494 amino acid positions in total) that are conserved in 15 red algal and 3 green algal taxa (see Methods). Analysis of the concatenated super-protein alignment under the CAT model led to a highly supported phylogenetic tree that received 1.00 posterior probability for all interior nodes (Fig. 1A). This tree confirmed the early split between Cyanidiophytina and Rhodophytina4,8 and monophyletic relationship between Bangiophyceae and Florideophyceae4,8. The relationships within Florideophyceae are consistent with previous analyses10,31 with Hildenbrandiophycidae (Hildenbrandia) in the basal position. Nemaliophycidae (Palmaria) is sister to the monophyletic group containing Corallinophycidae (Calliarthron) and Rhodymeniophycidae (Chondrus)10,31. The remaining non-seaweed mesophilic lineages formed a robust monophyletic group, with Stylonematophyceae in the basal position. Compsopogonophyceae formed a sister group to the monophyletic Porphyridiophyceae and Rhodellophyceae.
Concatenation-based analysis has previously been shown in some instances to result in inflated statistical support for incorrect topologies32 due to heterogeneity across genes and gene-specific evolution, such as gene duplication33. To minimize this problem, we used a tree summarization approach that does not rely on the concatenation of multiple single-gene alignments. This method takes a population of single-gene trees as input and estimates the species tree using a coalescence model28. This analysis led to the same tree topology (Fig. 1A) to the concatenation-based analysis with high bootstrap support for the monophyletic group comprising red seaweeds (bootstrap support = 100%) and non-seaweed mesophilic red algae (bootstrap support = 90%). The relationships among non-seaweed red algal lineages are however weakly supported (bootstrap support = 49-51%). Taken together, our phylogenomic analyses strongly support a separation between seaweeds and non-seaweed lineages at the base of mesophilic red algae (Fig. 1A).
(A) A phylogenetic tree inferred from a concatenated 298-protein alignment. The outgroup species are not shown. Statistical supports (separated by a back slash) for each branch are derived from the super-protein analysis (posterior probability) and from the coalescence model-based analysis (bootstrap support). (B) Schematic representation of the positions of red seaweeds and land plants (thick branches) in red algae and Viridiplantae, respectively. The phylogenies are derived from this study (panel I), Scott et al (Ref. 6, panel II) and Leliaert et al. (Ref. 35, panel III). The arrows indicate genome reduction (GR). Bangiophyceae (Bangio.), Compsopogonophyceae (Compsopogo.), Cyanidiophyceae (Cyanidio.), Florideophyceae (Florideo.), Porphyridiophyceae (Porphyridio.), Stylonematophyceae (Stylonemato.), Coleochaetophyceae (Coleochaeto.), Chlorokybophyceae (Chlorokybo.), Klebsormidiophyceae (Klebsormidio.), Mesostigmatophyceae (Mesostigmato.), Zygnematophyceae (Zygnemato.). A phylogenetic tree inferred from a concatenated alignment of 298-proteins. The outgroup species are not shown. Statistical supports (separated by a back slash) for each branch are derived from the super-protein analysis (posterior probability) and from the coalescence model-based analysis (bootstrap support). (B) Schematic representation of the positions of red seaweeds and land plants (thick branches) in red algae and Viridiplantae, respectively. The phylogenies are derived from this study (panel I), Scott et al (Ref. 6, panel II) and Leliaert et al. (Ref. 35, panel III). The arrows indicate genome reduction (GR). Bangiophyceae (Bangio.), Compsopogonophyceae (Compsopogo.), Cyanidiophyceae (Cyanidio.), Florideophyceae (Florideo.), Porphyridiophyceae (Porphyridio.), Stylonematophyceae (Stylonemato.), Coleochaetophyceae (Coleochaeto.), Chlorokybophyceae (Chlorokybo.), Klebsormidiophyceae (Klebsormidio.), Mesostigmatophyceae (Mesostigmato.), Zygnematophyceae (Zygnemato.).")
Fig. 1: Red algal phylogenomics
The early divergence of red seaweeds within mesophilic red algae is consistent with the antiquity of the Bangiophyceae. A putative bangiophyte (Bangiomorpha pubescens) has been found in rocks dated at ca. 1.2 billion years old34. This result suggests the existence of distinct fates for the two lineages that split from the common ancestor of mesophilic red algae. One lineage remained unicellular with the development of filaments in some species (e.g., Rhodochaete and Purpureofilum), whereas the other developed complex filamentous plant bodies leading to red seaweeds with bi- and tri-phasic life cycles. The basal position of red seaweeds among mesophiles (Fig. 1B, scenario I) contrasts with previous analyses4,5,6,8,10,34 (Fig. 1B, scenario II) and to the highly derived position of land plants in Viridiplantae35. Land plants evolved within streptophyte green algae that have simpler morphological forms (Fig. 1B, scenario III)35. Likewise, kelps (phaeophytes) are also nested among multiple unicellular stramenopile lineages36. Among mesophilic red algae, red seaweeds appear to have ‘recovered’ from the extensive genome reduction they shared with the red algal ancestor2 and that was further exacerbated in Cyanidiophytina due to their extremophilic lifestyles30. The early (>1 billion year old) emergence of the multicellular lineage is all the more remarkable when placed in context to the early evolution of red algae. Alternatively, the lack of simpler lineages (in terms of morphology) in the red seaweed clade may suggest their high rate of extinction or the existence of yet unknown species that remain to be discovered in this clade. An early emergence of a peculiar type of multicellularity (green seaweed Palmophyllophyceae) was also discovered recently in the basal position of Chlorophyta37.
Parallel losses of MVA pathway
To demonstrate the usefulness of this novel perspective on red algal phylogeny, we used the reference tree to elucidate the evolution of the isopentenyl pyrophosphate (IPP) biosynthetic pathway. IPP is the building block of isoprenoids that comprises a large diversity of lipids found in all three domains of life. In photosynthetic eukaryotes, two independent pathways exist to produce IPP, the cytosolic and peroxisome localized MVA pathway and the plastid MEP pathway38. Whereas the MEP pathway is conserved across many species, the MVA pathway has been lost in green algae (Chlorophyta)38 and in some red algal lineages such as C. merolae16 and P. purpureum12. Our analysis of red algal sequence data (see Methods) showed that the MEP pathway is present in all examined lineages. The minor gene losses that were found are most likely to be explained by missing data commonly associated with transcriptome datasets (Fig. 3, Appendix 2). In contrast, the MVA pathway is largely absent (3rd to 6th enzymes in the pathway, Fig. 2A) in most red algal lineages except the Stylonematophyceae (Rhodosorus marinus and Purpureofilum apyrenoidigerum) and G. sulphuraria. Presence of the MVA pathway in G. sulphuraria39 and Cyanidium caldarium40 is supported with genetic and biochemical evidence39,40. This result suggests that loss of MVA pathway is more widespread than previously thought. The red algal origin of the MVA genes in Stylonematophyceae is supported with phylogenetic data (see Methods). For example, in the phylogeny of HMG-CoA reductase (HMGR, Fig. 2B), R. marinus and P. apyrenoidigerum form a monophyletic group with and Galdieria species, whereas no other red algae were present in this clade. A similar pattern is found for other MVA pathway genes that were lost in most red algal species (Fig. 4, Appendix 3).
(A) The distribution of MVA pathway genes across red algal species. Black and open circles denote the presence and absence of the genes, respectively. For each gene, the gray boxes indicate gene presence for the corresponding classes. Arrows indicate genome reduction. Red vertical bars indicate gene losses. ACAT (acetyl-CoA acetyltransferase), HMGS (hydroxymethylglutaryl-CoA synthase), HMGR (3-hydroxy-3-methylglutaryl-CoA reductase), MVK (mevalonate kinase), PMK (phosphomevalonate kinase), MVD (mevalonate decarboxylase), IDI (isopentenyl-diphosphate delta-isomerase). (B) A ML tree of HMGR. The taxa in red color: red algae, green: Viridiplantae, orange: chromalveolates, brown: Opisthokonta.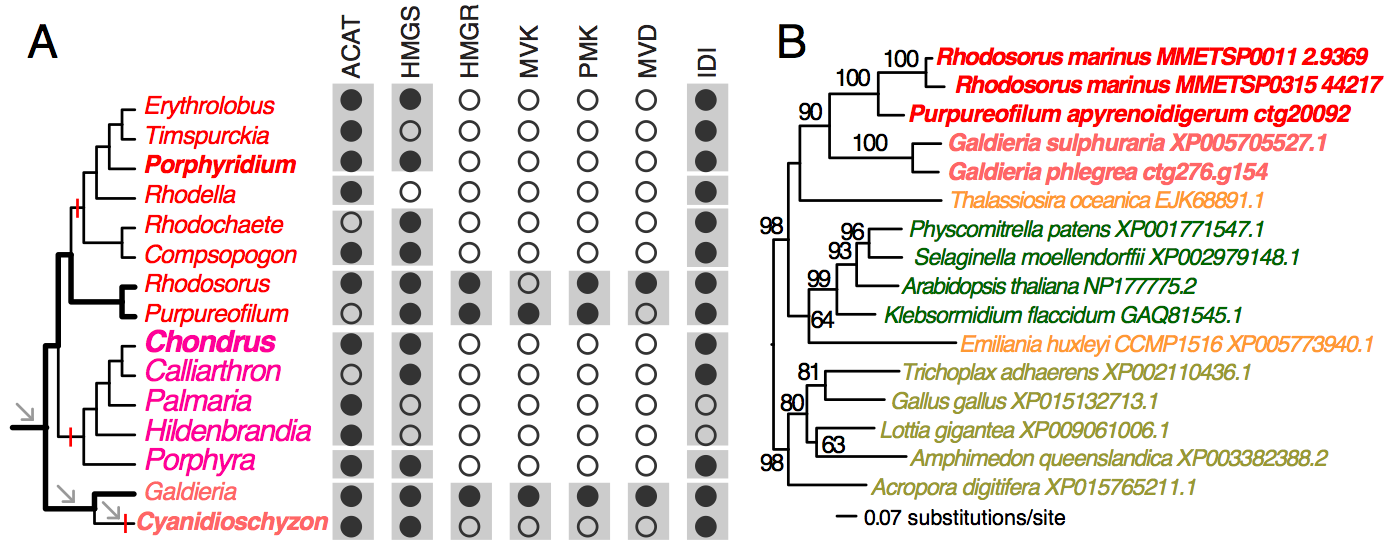
Fig. 2: MVA pathway in red algae
Absence of the MVA pathway in all five sampled red seaweeds suggests it was most likely lost in their common ancestor. BLASTp searches (e-value cutoff = 10) against nucleotide databases (expressed sequence tag and transcriptome shotgun assembly) in NCBI did not return any significant hits to MVA pathway genes from Bangiophyceae and Florideophyceae. In addition, their losses in C. merolae, P. purpureum, and C. crispus that have both transcriptome and genome data available are well supported. Given the red algal phylogeny (Fig. 1A), these losses were unambiguously resulted from three parallel events (Fig. 2A). Under this scenario, the MVA pathway survived the ancient phases of genome reduction (arrows, Fig. 2A) and underwent gene loss more recently after the split of the seaweed and non-seaweed lineages. MVA pathway loss in C. merolae likely resulted from an additional phase of genome reduction specific to this lineage30 (Fig. 2A). The selective forces that led to the retention or loss of the MVA pathway across the mesophilic red algal lineages are presently unknown. Nonetheless, MVA pathway loss suggests that IPP biosynthesis is dependent on the plastid MEP pathway and requires transporters for the export of IPP from the plastid to the cytosol38. The MVA pathway was also lost in Chlorophyta (including most unicellular green algae)38 and G. sulphuraria is physiologically distinct from mesophilic species. For this reason, the discovery of possible MVA pathway-containing and -absent lineages among mesophilic red algae provides an algal model for studying the evolution of isoprenoid biosynthesis and intracellular trafficking among compartments.
Conclusion
Our phylogenomic analyses resulted in a well-supported red algal phylogeny that provides new insights into the evolution of red seaweeds. Our results will allow more accurate reconstruction of evolutionary events (e.g., gene family evolution2 and molecular calibration10) and provide a framework to map the distribution of red algal functions and traits. Further efforts are needed to substantiate the relationships among non-seaweed mesophilic red algae with high quality genome data from these taxa41.
Data Availability
The multi-protein alignment is available for download (ID: 20087) from TreeBASE (https://treebase.org).
Competing Interests
The authors have declared that no competing interests exist.
Corresponding Author
Huan Qiu, Department of Ecology, Evolution and Natural Resources, Rutgers University, New Brunswick, NJ 08901, USA.
E-mail: [email protected]
Appendix 1
Algal genome and transcriptome data used for the phylogenomic analysis
Classification
Species
Source
Data type
MMETSP ID
Seaweed
Hildenbrandia rubra
Ref. 2
Transcriptome
–
Seaweed
Palmaria palmata
Ref. 2
Transcriptome
–
Seaweed
Calliarthron tuberculosum
Ref. 14
Partial genome
–
Seaweed
Chondrus crispus
Ref. 13
Whole genome
–
Seaweed
Porphyra umbilicalis
Ref. 14
Transcriptome
–
Mesophiles
Purpureofilum apyrenoidigerum
Ref. 2
Transcriptome
–
Mesophiles
Rhodochaete pulchella
Ref. 2
Transcriptome
–
Mesophiles
Rhodosorus marinus
Ref. 11
Transcriptome
MMETSP0315
Mesophiles
Rhodella maculata
Ref. 11
Transcriptome
MMETSP0167
Mesophiles
Compsopogon coeruleus
Ref. 11
Transcriptome
MMETSP0312
Mesophiles
Erythrolobus australicus
Ref. 11
Transcriptome
MMETSP1353
Mesophiles
Timspurckia oligopyrenoides
Ref. 11
Transcriptome
MMETSP1172
Mesophiles
Porphyridium purpureum
Ref. 12
Transcriptome
–
Extremophiles
Galdieria sulphuraria
Ref. 15
Transcriptome
–
Extremophiles
Cyanidioschyzon merolae
Ref. 16
Whole genome
–
Green algae
Chlorella variabilis
Ref. 17
Whole genome
–
Green algae
Chlamydomonas reinhardtii
Ref. 18
Whole genome
–
Green algae
Micromonas pusilla
Ref. 19
Whole genome
–
Appendix 2
Black and open circles denote the presence and absence of the genes, respectively. For each gene, the gray boxes indicate the gene presence for the corresponding classes. DXS (1-deoxy-d-xylulose 5-phosphate synthase), DXR (1-deoxy-d-xylulose 5-phosphate reductoisomerase), MCT (2-C-methyl-d-erythritol 4-phosphate cytidylyltransferase), CMK (C-methyl-d-erythritol kinase), MDS (2-C-methyl-d-erythritol 2,4-cyclodiphosphate synthase), HDS (4-hydroxy-3-methylbut-2-en-1-yl diphosphate synthase), HDR (4-hydroxy-3-methylbut-2-en-1-yl diphosphate reductase), IDI (isopentenyl-diphosphate isomerase).
Fig. 3: Distribution of the MEP pathway across red algal lineages
Appendix 3
The taxa in red color: red algae, green: Viridiplantae, orange: chromalveolates, brown: Opisthokonta.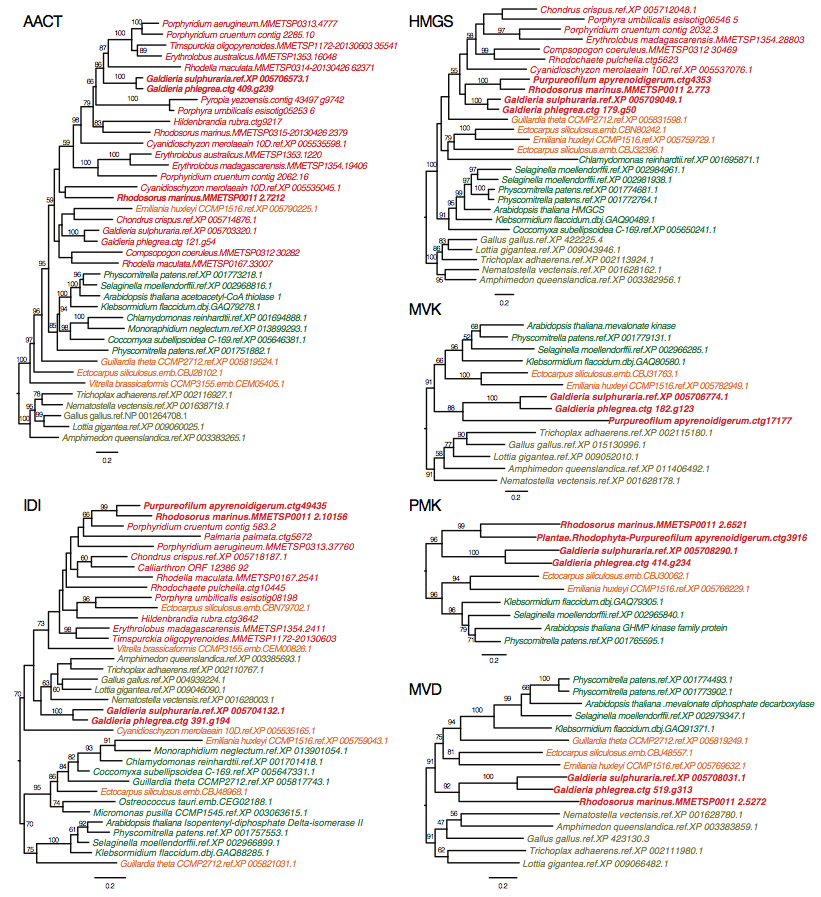
Fig. 4: ML trees for six MVA pathway genes
Acknowledgements
The authors would like to thank the editor and reviewer for their valuable comments and suggestions to improve the manuscript.References
- Guiry MD. How many species of algae are there? J Phycol. 2012 48:1057-63.
- Qiu H, Price DC, Yang EC, Yoon HS, Bhattacharya D. Evidence of ancient genome reduction in red algae (Rhodophyta). J Phycol. 2015 51:624-36.
- Knoll AH. The multiple origins of complex multicellularity. Annu Rev Earth Planet Sci. 2011 39:217-239.
- Yoon HS, Müller KM, Sheath RG, Ott FD, Bhattacharya D. Defining the major lineages of red algae (Rhodophyta). J Phycol. 2006 42: 482-492.
- Yang EC, Scott J, West JA, Orlova E, Gauthier D, Küpper FC, Yoon HS, Karsten U. New taxa of the Porphyridiophyceae (Rhodophyta): Timspurckia oligopyrenoides gen. et sp. nov. and Erythrolobus madagascarensis sp. nov. Phycologia 2010 49:604-616.
- Scott J, Yang EC, West JA, Yokoyama A, Kim HJ, Susan Loiseaux de Goër, O’Kelly CJ, Orlova E, Kim SY, Park JK, Yoon HS. On the genus Rhodella, the emended orders Dixoniellales and Rhodellales with a new order Glaucosphaerales (Rhodellophyceae, Rhodophyta). Algae 2011 26:277-288.
- Müller KM, Oliveira MC, Sheath RG, Bhattacharya D. Ribosomal DNA phylogeny of the Bangiophycidae (Rhodophyta) and the origin of secondary plastids. Am J Bot. 2001 88:1390-400.
- Yoon HS, Zuccarello G, Bhattacharya D. Evolutionary history and taxonomy of red algae. In: Seckbach J, Chapman DJ, editors. Red algae in the genomic age. Dordrecht (The Netherlands). Springer 2010 25-42.
- Popolizio TR, Schneider CW, Lane CE. A molecular evaluation of the Liagoraceae sensu lato (Nemaliales, Rhodophyta) in Bermuda including Liagora nesophila sp. nov. and Yamadaella grassyi sp. nov. J Phycol. 2015 51:637-58.
- Yang EC, Boo SM, Bhattacharya D, Saunders GW, Knoll AH, Fredericq S, Graf L, Yoon HS. Divergence time estimates and the evolution of major lineages in the florideophyte red algae. Sci Rep. 2016 6:21361.
- Keeling PJ, Burki F, Wilcox HM, Allam B, Allen EE, Amaral-Zettler LA, Armbrust EV, Archibald JM, Bharti AK, Bell CJ, Beszteri B, Bidle KD, Cameron CT, Campbell L, Caron DA, Cattolico RA, Collier JL, Coyne K, Davy SK, Deschamps P, et al. The Marine Microbial Eukaryote Transcriptome Sequencing Project (MMETSP): illuminating the functional diversity of eukaryotic life in the oceans through transcriptome sequencing. PLoS Biol. 2014 12:e1001889.
- Bhattacharya D, Price DC, Chan CX, Qiu H, Rose N, Ball S, Weber AP, Arias MC, Henrissat B, Coutinho PM, Krishnan A, Zäuner S, Morath S, Hilliou F, Egizi A, Perrineau MM, Yoon HS. Genome of the red alga Porphyridium purpureum. Nat Commun. 2013 4:1941.
- Collén J, Porcel B, Carré W, Ball SG, Chaparro C, Tonon T, Barbeyron T, Michel G, Noel B, Valentin K, Elias M, Artiguenave F, Arun A, Aury JM, Barbosa-Neto JF, Bothwell JH, Bouget FY, Brillet L, Cabello-Hurtado F, Capella-Gutiérrez S, et al. Genome structure and metabolic features in the red seaweed Chondrus crispus shed light on evolution of the Archaeplastida. Proc Natl Acad Sci U S A. 2013 110:5247-52.
- Chan CX, Yang EC, Banerjee T, Yoon HS, Martone PT, Estevez JM, Bhattacharya D. Red and green algal monophyly and extensive gene sharing found in a rich repertoire of red algal genes. Curr Biol. 2011 21:328-33.
- Schönknecht G, Chen WH, Ternes CM, Barbier GG, Shrestha RP, Stanke M, Bräutigam A, Baker BJ, Banfield JF, Garavito RM, Carr K, Wilkerson C, Rensing SA, Gagneul D, Dickenson NE, Oesterhelt C, Lercher MJ, Weber AP. Gene transfer from bacteria and archaea facilitated evolution of an extremophilic eukaryote. Science. 2013 339:1207-10.
- Matsuzaki M, Misumi O, Shin-I T, Maruyama S, Takahara M, Miyagishima SY, Mori T, Nishida K, Yagisawa F, Nishida K, Yoshida Y, Nishimura Y, Nakao S, Kobayashi T, Momoyama Y, Higashiyama T, Minoda A, Sano M, Nomoto H, Oishi K, et al. Genome sequence of the ultrasmall unicellular red alga Cyanidioschyzon merolae 10D. Nature. 2004 428:653-7.
- Merchant SS, Prochnik SE, Vallon O, Harris EH, Karpowicz SJ, Witman GB, Terry A, Salamov A, Fritz-Laylin LK, Maréchal-Drouard L, Marshall WF, Qu LH, Nelson DR, Sanderfoot AA, Spalding MH, Kapitonov VV, Ren Q, Ferris P, Lindquist E, Shapiro H, et al. The Chlamydomonas genome reveals the evolution of key animal and plant functions. Science. 2007 318:245-50.
- Blanc G, Duncan G, Agarkova I, Borodovsky M, Gurnon J, Kuo A, Lindquist E, Lucas S, Pangilinan J, Polle J, Salamov A, Terry A, Yamada T, Dunigan DD, Grigoriev IV, Claverie JM, Van Etten JL. The Chlorella variabilis NC64A genome reveals adaptation to photosymbiosis, coevolution with viruses, and cryptic sex. Plant Cell. 2010 22:2943-55.
- Worden AZ, Lee JH, Mock T, Rouzé P, Simmons MP, Aerts AL, Allen AE, Cuvelier ML, Derelle E, Everett MV, Foulon E, Grimwood J, Gundlach H, Henrissat B, Napoli C, McDonald SM, Parker MS, Rombauts S, Salamov A, Von Dassow P, et al. Green evolution and dynamic adaptations revealed by genomes of the marine picoeukaryotes Micromonas. Science. 2009 324:268-72.
- Li L, Stoeckert CJ Jr, Roos DS. OrthoMCL: identification of ortholog groups for eukaryotic genomes. Genome Res. 2003 13:2178-89.
- Edgar RC. MUSCLE: multiple sequence alignment with high accuracy and high throughput. Nucleic Acids Res. 2004 32:1792-7.
- Capella-Gutiérrez S, Silla-Martínez JM, Gabaldón T. trimAl: a tool for automated alignment trimming in large-scale phylogenetic analyses. Bioinformatics. 2009 25:1972-3.
- Notredame C, Higgins DG, Heringa J. T-Coffee: A novel method for fast and accurate multiple sequence alignment. J Mol Biol. 2000 302:205-17.
- Darriba D, Taboada GL, Doallo R, Posada D. ProtTest 3: fast selection of best-fit models of protein evolution. Bioinformatics. 2011 27:1164-5.
- Stamatakis A. RAxML-VI-HPC: maximum likelihood-based phylogenetic analyses with thousands of taxa and mixed models. Bioinformatics. 2006 Nov 22:2688-90.
- Seo TK. Calculating bootstrap probabilities of phylogeny using multilocus sequence data. Mol Biol Evol. 2008 25:960-71.
- Nguyen LT, Schmidt HA, von Haeseler A, Minh BQ. IQ-TREE: a fast and effective stochastic algorithm for estimating maximum-likelihood phylogenies. Mol Biol Evol. 2015 32:268-74.
- Liu L, Yu L, Edwards SV. A maximum pseudo-likelihood approach for estimating species trees under the coalescent model. BMC Evol Biol. 2010 10:302.
- Kanehisa M, Goto S. KEGG: kyoto encyclopedia of genes and genomes. Nucleic Acids Res. 2000 28:27-30.
- Qiu H, Price DC, Weber AP, Reeb V, Yang EC, Lee JM, Kim SY, Yoon HS, Bhattacharya D. Adaptation through horizontal gene transfer in the cryptoendolithic red alga Galdieria phlegrea. Curr Biol. 2013 23:R865-6.
- Yang EC, Kim KM, Kim SY, Lee J, Boo GH, Lee JH, Nelson WA, Yi G, Schmidt WE, Fredericq S, Boo SM, Bhattacharya D, Yoon HS. Highly conserved mitochondrial genomes among multicellular red algae of the Florideophyceae. Genome Biol Evol. 2015 7:2394-406.
- Song S, Liu L, Edwards SV, Wu S. Resolving conflict in eutherian mammal phylogeny using phylogenomics and the multispecies coalescent model. Proc Natl Acad Sci U S A. 2012 109:14942-7.
- Qiu H, Yang EC, Bhattacharya D, Yoon HS. Ancient gene paralogy may mislead inference of plastid phylogeny. Mol Biol Evol. 2012 29:3333-43.
- Saunders GW, Hommersand MH. Assessing red algal supraordinal diversity and taxonomy in the context of contemporary systematic data. Am J Bot. 2004 91:1494-507.
- Leliaert F, Smith DR, Moreau H, Herron MD, Verbruggen H, Delwiche CF, Clerck OD. Phylogeny and molecular evolution of the green algae. CRC Crit Rev Plant Sci. 2012 31:1-46.
- Brown JW, Sorhannus U. A molecular genetic timescale for the diversification of autotrophic stramenopiles (Ochrophyta): substantive underestimation of putative fossil ages. PLoS One. 2010 5. pii: e12759.
- Leliaert F, Tronholm A, Lemieux C, Turmel M, DePriest MS, Bhattacharya D, Karol KG, Fredericq S, Zechman FW, Lopez-Bautista JM. Chloroplast phylogenomic analyses reveal the deepest-branching lineage of the Chlorophyta, Palmophyllophyceae class. nov. Sci Rep. 2016 6:25367.
- Lohr M, Schwender J, Polle JE. Isoprenoid biosynthesis in eukaryotic phototrophs: a spotlight on algae. Plant Sci. 2012 185-186:9-22.
- Grauvogel C, Petersen J. Isoprenoid biosynthesis authenticates the classification of the green alga Mesostigma viride as an ancient streptophyte. Gene. 2007 396:125-33.
- Disch A, Schwender J, Müller C, Lichtenthaler HK, Rohmer M. Distribution of the mevalonate and glyceraldehyde phosphate/pyruvate pathways for isoprenoid biosynthesis in unicellular algae and the cyanobacterium Synechocystis PCC 6714. Biochem J. 1998 333:381-8.
- Bhattacharya D, Qiu H, Price DC, Yoon HS. Why we need more algal genomes. J Phycol. 2015 51:1-5.
Leave a Comment
You must be logged in to post a comment.