Abstract
Background.
Cyclones have significantly affected populations in Southeast Asia, the Western Pacific, and the Americas over the past quarter of a century. Future vulnerability to cyclones will increase due to factors including population growth, urbanization, increasing coastal settlement, and global warming. The objectives of this review were to describe the impact of cyclones on human populations in terms of mortality, injury, and displacement and, to the extent possible, identify risk factors associated with these outcomes. This is one of five reviews on the human impact of natural disasters.
Methods.
Data on the impact of cyclones were compiled using two methods, a historical review from 1980 to 2009 of cyclone events from multiple databases and a systematic literature review of publications ending in October 2012. Analysis included descriptive statistics and bivariate tests for associations between cyclone characteristics and mortality using Stata 11.0.
Findings.
There were 412,644 deaths, 290,654 injured, and 466.1 million people affected by cyclones between 1980 and 2009, and the mortality and injury burden was concentrated in less developed nations of Southeast Asia and the Western Pacific. Inconsistent reporting suggests this is an underestimate, particularly in terms of the injured and affected populations. The primary cause of cyclone-related mortality is drowning; in developed countries male gender was associated with increased mortality risk, whereas females experienced higher mortality in less developed countries.
Conclusions.
Additional attention to preparedness and early warning, particularly in Asia, can lessen the impact of future cyclones.
Funding Statement
This research was supported by the National Science Foundation’s Human and Social Dynamics Program (grant #0624106). The funding body played no role in the design, writing or decision to publish this manuscript.Introduction
Tropical cyclones, also known as typhoons and hurricanes, have caused an estimated 1.33 million deaths since the beginning of the 20th century and affected more than 629 million people in this timeframe. A tropical cyclone is a non-frontal storm system that is characterized by a low pressure center, spiral rain bands and strong winds. Usually it originates over tropical or sub-tropical waters and rotates clockwise in the southern hemisphere and counter-clockwise in the northern hemisphere. Depending on their location and strength, tropical cyclones are referred to as hurricanes (western Atlantic/eastern Pacific), typhoons (western Pacific), and cyclones (southern Pacific/Indian Ocean) 1. Approximately half of tropical cyclones recorded and more than 90% of cyclone-related deaths originate in Asian waters 1. Cyclones are large organized storms with well-defined cores that begin over tropical or subtropical waters, often as a result of monsoon troughs and easterly waves 2. An average of 37 tropical storms occur each season and they range in size from 100 to more than 1,000km in diameter and are known for strong winds and bands of torrential rain that revolve around the center or eye of the storm 3. In the Eastern Pacific basin the season begins two weeks early on May 15th. The levels of intensity of these storms range from tropical depression (winds <17 meters per second), to tropical storm (winds 18-32 m/s), and cyclone (>33 m/s) 4. Once formed, cyclones maintain strength by pulling heat and moisture from warm ocean waters 3. The damage and deaths related to cyclones are the result of three major forces: winds in excess of 155 miles per hour; storm surge where the level of the sea rises as much as 10 meters and move ashore; and secondarily due to floods resulting from torrential rains. Storm surges and floods are the primary causes of death in cyclones 5.
The impacts from cyclones are concentrated in coastal areas of South and East Asia, Madagascar, the east coast of North and Central America and the Caribbean. Mortality is concentrated in Asia, economic losses follow a similar pattern; however, total economic losses are greatest in affluent countries with developed infrastructure 6. Future vulnerability to cyclones will increase due to factors including population growth, urbanization, increasing coastal settlement and changing weather patterns. The objectives of this review are to describe the impact of cyclones in terms of mortality, injury, and displacement and, to the extent possible, identify risk factors for associated with these outcomes. This is one of five reviews on the human impact of natural disasters, the others being volcanoes, floods, tsunamis, and earthquakes.
Methods
Data on the impact of cyclones were compiled using two methods, a historical review of cyclone events and a systematic literature review of publications relating to the human impacts of cyclones.
Historical Event Review
A historical database of significant cyclones from 1980 to mid-2009 was created from publicly available data. Multiple data sources were sought to ensure a complete listing of events and to allow for cross checking. The two primary data sources were the Centre for Research on the Epidemiology of Disasters (CRED) International Disaster Database (EM-DAT) 7 and the National Hurricane Center (NHC)8 because they included information on human impacts. The events in the EM-DAT database include one or more of the following criteria: 10 or more people killed or injured; 100 people affected; declaration of a state of emergency; or a call for international assistance. The NHC database included information on all cyclones in the Atlantic, Caribbean and Gulf of Mexico.
The EM-DAT event list was downloaded in August 2009 and NHC data downloaded in February 2010. Event lists were reconciled to create a combined list of events from both data sources which were then tabulated and summarized for 1980 through 2009. See https://www.jhsph.edu/refugee/natural_disasters/_Historical_Event_Review_Overview.html for the database of tropical cyclone events. A total of 948 events were retained from EM-DAT and 331 from the NHC. For cyclone impacts reported by EM-DAT, zeroes were treated as missing values because they were used as placeholders and their inclusion in the analysis could contribute to the under estimation of tsunami impacts.
To assess risk factors for cyclone-related mortality the following categories were used: none (0 deaths), low (1-9 deaths), medium (10-99 deaths) and high (≥100 deaths). Bivariate tests for association were performed using chi-square for categorical and ANOVA for continuous measures. All covariates, with the exception of World Bank developmental level which was highly correlated with per capita GDP were subsequently included in a multinomial logistic regression model to assess relative risk of mortality at a given level as compared to events with no deaths. Analyses were performed using Stata Statistical Software, Version 11.0 9.
Systematic Literature Review
Key word searches in MEDLINE (Ovid Technologies, humans), EMBASE (Elsevier, B.V., humans), SCOPUS (Elsevier B.V., humans), and Web of Knowledge/Web of Science (Thomson Reuters) were performed to identify articles published in July 2007 or earlier that described natural hazards and their impact on human populations. Following the systematic review, a further search was conducted to identify relevant articles published through October 2012. One search was done for all the five natural hazards described in this set of papers. This paper describes the results for cyclones. The systematic review is reported according to the PRISMA guidelines. Key words used included natural hazard(s), natural disaster(s), volcano(es), volcanic, volcanic eruption, seismic event, earthquake(s), cyclone(s), typhoon(s), hurricane(s), tropical storm(s), flood(s), flooding, mudslide(s), tsunami(s), and tidal wave(s). Key words included for impact on humans were affected, damage(d), injury, injuries, injured, displaced, displacement, refugees, homeless, wounded, wound(s), death(s), mortality, casualty, casualties, killed, died, fatality, fatalities and had to be used in either the title, abstract or as a subject heading/key word. The search resulted in 2,747 articles from MEDLINE, 3,763 articles from EMBASE, 5,219 articles from SCOPUS, and 2,285 articles from ISI Web of Knowledge. Results from the four databases were combined and duplicates were excluded to yield a total of 9,958 articles.
Title screening was performed to identify articles that were unrelated to natural disasters or human populations. Each title was screened by two independent reviewers and was retained if either or both reviewers established that inclusion criteria were met. To ensure consistent interpretation of inclusion criteria, percent agreement was assessed across reviewers for a small sample of articles, and title screening began after 80% agreement on inclusion was achieved. A total of 4,873 articles were retained for abstract review. Articles were excluded if they met one or more of the following criteria: language other than English; editorial or opinion letter without research; not related to human populations; individual case report/study; focus on responders; and not related to human or environmental vulnerabilities or impacts of hazards. Each abstract was then screened by two reviewers and retained if either or both established that inclusion criteria were met. Included abstracts were coded for event type, timeframe, region, subject of focus, and vulnerable population focus. A total of 558 cyclone articles were retained for article review; 193 articles focusing on the impacts of cyclones on human populations in terms of mortality, injury, and displacement were prioritized for abstraction. Upon full review, 49 articles were retained including 48 that underwent dual review, standard data abstraction and one that was identified as a review article (Figure 1). The additional review then identified eleven articles through October 2012 that met the inclusion criteria for abstraction in the mortality and injury review. A summary of the final 58 abstracted articles is presented in Table 1.
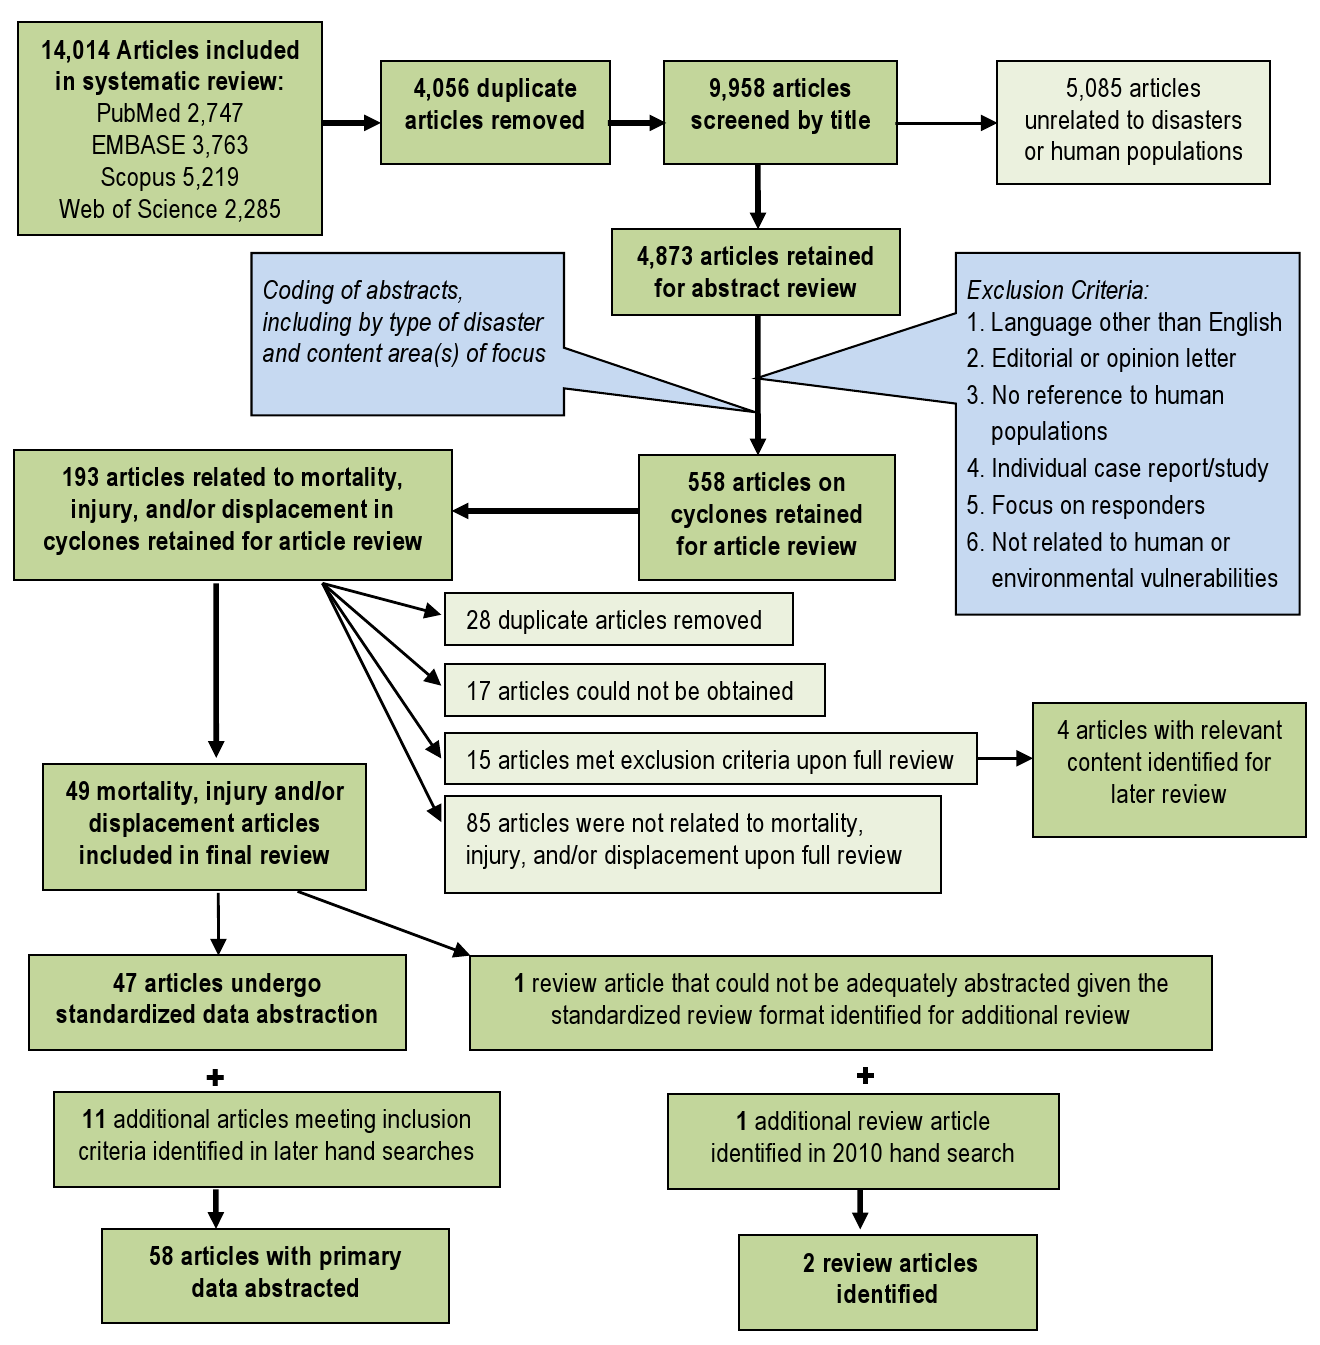
Fig. 1: Overview of the systematic literature review process for cyclones
Publication
Event(s)
Study Summary
Mortality (n=35)
Injury (n=27)
Displacement (n=6)
Mahajani, 197511
Cyclone Tracy, 1974
Post-cyclone Injury management
NR
x
NR
Longmire, 198412
Hurricane Frederic, 1979
Review of injury frequency before and after the hurricane
NR
x
NR
MMWR, 198613
1985Hurricanes Elena & Gloria,
Analysis of hurricane-related emergency room visits resulting in Mississippi, Rhode Island, and Connecticut
x
x
NR
Siddique, 198714
Bangladesh Cyclone, 1985
Examines of risk factors for mortality among island populations
x
NR
x
Longmire, 198815
Hurricane Elena, 1985
Review of injury type and severity
NR
x
NR
MMWR, 198916
Hurricane Hugo, 1989
Assesses cause of death and factors associated with mortality in Puerto Rico.
x
NR
NR
MMWR, 198917
Hurricane Hugo, 1989
Assesses causes of death and factors associated with mortality in South Carolina.
x
NR
NR
Philen, 199018
Hurricane Hugo, 1989
Assesses mortality factors from deaths related to Hurricane Hugo.
x
NR
NR
MMWR, 199219
Hurricane Andrew, 1992
Examines mortality factors in deaths reported by medical examiners in southern Florida
x
NR
NR
Rahman, 199320
Bangladesh Cyclone, 1991
Evaluation of the health effects of the cyclone and tidal wave in Bangladesh.
x
NR
NR
Bern, 199221
Bangladesh Cyclone, 1991
Characterizes factors associated with cyclone-related mortality and identifies prevention strategies
x
NR
NR
Chowdhury, 199322
Bangladesh Cyclone, 1991
Examines mortality following 1991 cyclone and effects of cyclone preparedness
x
NR
NR
Lee, 199323
Hurricane Andrew, 1992
Assesses injuries and illnesses among care seekers at health care facilities
NR
x
NR
Brewer, 199424
Hurricane Hugo, 1989
Describes public health impact on inland areas of North Carolina
x
x
NR
McNabb, 199525
Hurricane Andrew, 1992
Characterizes hurricane related injury and morbidity in Louisiana
x
x
NR
Combs, 199626
Hurricane Andrew, 1992
Describes hurricane related population-based mortality rates
x
NR
NR
Hendrickson, 199627
Hurricane Iniki, 1992
Examines hurricane-related mortality risk
x
NR
NR
Lew, 199628
Hurricane Andrew, 1992
Examines damage, mortality, and displacement in Dade County, Florida
x
NR
NR
MMWR, 199629
Marilyn & Opal, 1995
Injuries and health needs of affected communities in Virgin Islands, Florida, Louisiana and Georgia
NR
x
NR
MMWR, 199630
Marilyn & Opal, 1995
Summarizes and characterizes hurricane-attributed deaths in Florida and US Virgin Islands
x
NR
NR
Smith, 199631
Hurricane Andrew, 1992
Examines demographics effects in Dade County Florida
NR
NR
x
Hendrickson, 199732
Hurricane Iniki, 1992
Uses medical chart data to characterize hurricane related increases in injuries and morbidity
NR
x
NR
MMWR, 199833
Hurricane Georges, 1998
Describe deaths indirectly caused by the hurricane
x
NR
NR
MMWR, 200034
Hurricane Floyd, 1999
Monitoring of illness, injury and death related to the hurricane and subsequent flooding
x
x
NR
Guill, 200135
Hurricane Mitch, 1998
Assesses the impact of Hurricane Mitch on a small Honduran community
x
NR
NR
O’Hare, 200136
Hurricane 07B, India, 1996
Spatial analysis of destruction caused by Hurricane 07B
x
NR
NR
Waring, 200237
Tropical Storm Allison, 2001
Assesses health and medical needs of the affected population
NR
x
NR
Keenan, 200438
Hurricane Hugo, 1999
Assessment of the post-hurricane incidence of traumatic brain injury in children
NR
x
NR
MMWR, 200439
Hurricane Charley, 2004
Assesses causes of and factors with associated with mortality
x
NR
NR
Gagnon, 200540
Hurricane Isabel, 2003
Assesses post-event injuries and injury prevention strategies
NR
x
NR
MMWR, 200541
Hurricane Katrina, 2005
Documents facility-based surveillance efforts of post-hurricane effects
NR
x
NR
MMWR, 200542
2004 Florida hurricanes (4)
Examines demographic and epidemiologic risk factors for hurricane outcomes
NR
x
NR
Smith, 200543
Hurricane Isabel, 2003
Hurricane-related emergency department visits and storm impact on hospital admission rates
NR
x
NR
Waring, 200544
Tropical Storm Allison, 2001
Utility of geographic information systems (GIS) in rapid epidemiological assessments
NR
x
NR
Brodie, 200645
Hurricane Katrina, 2005
Examines demographics and health needs of evacuees in Houston area shelters
NR
x
NR
Jani, 200646
Hurricane Isabel, 2003
Analysis of mortality to identify modifiable risk factors and injury prevention measures.
x
NR
NR
MMWR, 200647
2004-5 Florida hurricanes (8)
Assessment of carbon monoxide poisonings reported to Florida Poison Control
NR
x
NR
MMWR, 200648
Hurricane Katrina, 2005
Review county level mortality data to characterize causes of death and storm impact.
x
NR
NR
MMWR, 200649
Hurricane Katrina, 2005
Describes carbon monoxide incidents and risk factors
x
NR
NR
MMWR, 200650
Hurricane Katrina, 2005
Describes effectiveness of post-hurricane surveillance activities in three counties of Mississippi
x
x
NR
MMWR, 200651
Hurricane Katrina, 2005
Post-hurricane surveillance of patient-specific data on injury and morbidity in greater New Orleans
x
x
NR
MMWR, 200652
Hurricane Katrina, 2005
Rapid assessment of clinical care needs, public health services, and housing assistance for San Antonio evacuees
NR
NR
x
Sullivent, 200653
Hurricane Katrina, 2005
Documents hurricane-related causes of injury using an active surveillance system
NR
x
NR
Vest, 200654
Hurricane Katrina, 2005
Describes the prevalence of acute signs and symptoms, chronic conditions, and risk factors those in shelters
NR
NR
x
DeSalvo, 200755
Hurricane Katrina, 2005
Examine post-Katrina rates and predictors of PTSD symptoms in New Orleans residents
NR
NR
x
Ghosh, 200756
Hurricane Katrina, 2005
Needs assessment of the Katrina-displaced population arriving in Denver
NR
NR
x
Sharkey, 200757
Hurricane Katrina, 2005
Epidemiologic review for risk factors for mortality in Hurricane Katrina
x
NR
NR
Brunkard, 200858
Hurricane Katrina, 2005
Review of Hurricane Katrina deaths and risk factors in Louisiana
x
NR
NR
Eavey, 200859
Hurricane Katrina, 2005
Comparison of pre- and post- Katrina mortality rates and causes
x
NR
NR
Ragan, 200860
Florida, 2004-05
Mortality surveillance for eight Florida hurricanes occurring in 2004 and 2005
x
NR
NR
Das, 200961
1999 cyclone in Orissa, India
Mangrove ecosystems and mortality reduction in cyclones
x
NR
NR
Shen, 200962
China, 2006
Risk factors for injury during Typhoon Saomei
NR
x
NR
Uscher-Pines, 200963
Hurricane Katrina, 2005
Injury and displacement among older adults following Hurricane Katrina
NR
x
x
Kanter, 201064
Hurricane Katrina, 2005
Child mortality following Hurricane Katrina
x
NR
NR
Kim, 201065
Cyclone Nargis, 2008
Injury and illness among Burmese patients presenting for care following Cyclone Nargis
NR
x
NR
Norris, 201066
Hurricane Ike, 2008
Prevalence of disaster related illness and injury related to Hurricane Ike
NR
x
NR
Faul, 201179
Hurricane Katrina 2005
Review of injuries that presented at the Houstan, Texas, Reliant Park clinic.
NR
x
NR
Zane, 201180
Hurricane Ike,Texas, 2008
CDC Surveillance data on mortality in hurricane Ike
x
NR
NR
Results
Historical Event Review
During the 30-year observation period (1980-2009), 1,080 cyclones were recorded with an average of 32 (range 16-66) annually. The number of events reported annually by NHC and EM-DAT increased over time as did the total number of events; NHC reported a lower number of events because their focus area is the Americas (Figure 2). Both the frequency of cyclones and affected population size increased over time; cyclone related mortality did not follow a similar trend and mortality peaks were associated with infrequent high-impact events such as cyclone Gorky (Bangladesh, 1991) and cyclone Nargis (Myanmar, 2008) (Figure 3).
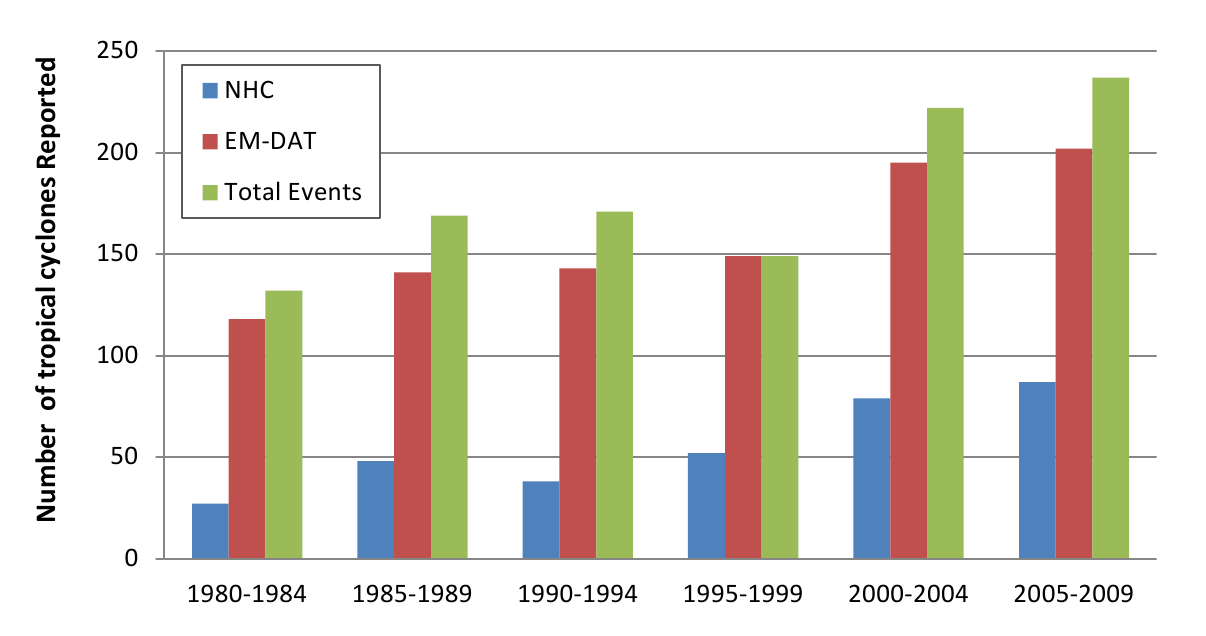
Fig. 2: Tropical cyclone reporting frequency, 1980 -2009 (n=1080)
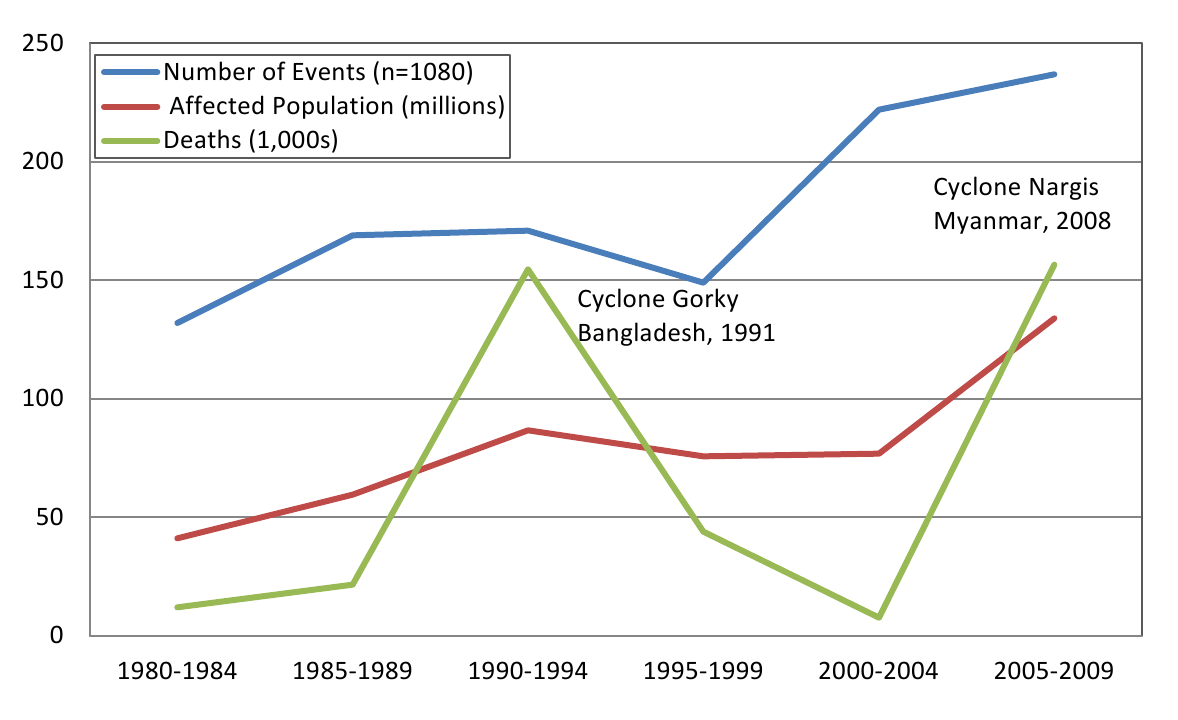
Fig. 3: Tropical cyclones and their affects on human populations
By decade, 42,5% (n=459) of events occurred in the 2000s, 29.6% (n=320) in the 1990s, and 27.9% (n=301) in the 1980s. The impact of cyclone events across regions is summarized in Figure 4. The World Health Organization regions of the Western Pacific (WPRO) and the Americas (AMRO) accounted for more than 80% of all reported events. The mortality was greatest in the SEARO regions while only 8% of deaths occurred in the AMRO region despite accounting for 37% of all events occurring there. Although the SEARO region accounted for only 9% of all events, it had 53% of the affected population and 80% of all deaths.

Fig. 4: Cyclones and their impact on human populations by region, 1980-2009*
*Regions as defined by the World Health Organization
The overall impact of cyclones on human populations is summarized in Table 2. An estimated 466.1 million people were reported to be affected by cyclones between 1980 and 2009, including 20.1 million that were rendered homeless. These figures likely substantially underestimate the true impact because estimates of the total affected population and the homeless population were reported in 78.7% (n=799) and 26.2% (n=283) of events, respectively. The distribution of the affected population was highly skewed: when reported on average 592,830 people affected per storm, but the calculated median was only 20,000 per event. Monetary damages were reported by EM-DAT in 15.4% of events and evacuation was reported by NHC in only 2.3% events so these outcomes were not assessed because of insufficient reporting.
*Best estimate figures are based on the highest reported number of deaths or injuries in an event from either EM-DAT or NHC; homeless and total affected populations are reported only by EM-DAT.
Cumulative Impact of Tropical Cyclones, 1980-2009
Human Consequence
# of Events w/ information reported(%)
Best Estimate *
Deaths
1049** (97.1%)
412,644
Injuries
340 (31.56%)
290,654
Homeless
267 (24.7%)
20,160,878
Total Affected
801 (74.2%)
466,098,192
Reporting by Source and Average Outcomes per Cyclone, 1980-2009
Human Consequence
# of Events** (%)
Median
Mean
Range
Deaths, all events
1049
97.10%
8
346
0-138,866
Reported by EM-DAT
925
85.60%
11
433
0-138,866
Reported by NHC
292
-27.30%
3
69
0-5,677
Events with deaths
965
89.40%
14
430
1-138,866
Reported by EM-DAT
860
79.60%
15
483
1-138,866
Reported by NHC
181
16.80%
5
87
1-5,677
Events with Injuries
397
36.80%
46
775
1-138,849
Reported by EM-DAT
338
33.90%
56
834
1-138,849
Reported by NHC
30
32.40%
3
309
1-7,242
Homeless, all events
283
26.20%
5,000
77,907
25-5,432,375
Total Affected, all events
799
78.70%
20,000
592,830
2-29,622,000
Mortality and Injury. Mortality data had the most complete reporting. When the two sources were combined, information on deaths was reported in 97.1% of events and deaths occurred in 89.4% of cyclones between 1980 and 2009. Overall, 412,644 deaths were reported in the historical event review, the vast majority from EM-DAT. For cyclones where mortality was reported, there was a median of 14 deaths per event (mean = 430, 5% trimmed mean= 41, range 1-138,849) when using the highest reported death toll. The two deadliest storms, Cyclone Gorky (Bangladesh, 1991; 138,866 deaths) and Cyclone Nargis (Myanmar, 2008; 138,366 deaths) accounted for two-thirds of cyclone deaths between 1980 and 2009. The next order of high mortality events with 10,000-15,000 deaths included Hurricane Mitch (Honduras, 1998) and a cyclone in Bangladesh (1985) and there were 16 events with 1,000-9,999 deaths over the 30 years. In total, the 1.9% (n=20) of events with mortality >1000 accounted for 83.9% of all cyclone deaths, suggesting that cyclone mortality is concentrated in infrequent and extreme events.
Injury data were available in 397 (36.8%) events, with a total of 290,654 cyclone-related injuries documented. When reported, there was a median of 46 injuries per storm (mean=775, 5% trimmed mean=200, range 1-138,849) when the highest reported figure was used. To estimate the total number of injuries, it was presumed that injuries occurred in events with reported deaths. There were 965 cyclones with reported fatalities. When the median and 5% trimmed mean for injuries were applied to the remaining 568 events with fatalities but no injury reporting, it was estimated that between 28,400 and 113,600 unreported cyclone related injuries may have occurred between 1980 and 2009.
Ordinal logistic regression was used to assess country-level characteristics associated with storm mortality categories (Table 3). All country-level variables were found to be significantly associated with mortality. The mean GDP per capita was $13,191 (SD 17,709, range 1433-99,383) and the mean Gini index score 10, which is a measure of equality, was 41.3 (SD 7.3, range 24.9-64.3). When assessed by mortality category, the highest per capita GDP occurred in the no deaths category while the lowest was observed in the ≥100 death category (p<.001), suggesting that the cyclone mortality risk is concentrated in lower income countries.
Characteristic
0 deaths (n = 172)
1-9 deaths (n = 383)
10-99 deaths (n = 370)
≥100 deaths (n = 155)
Decade, n (%)
1980
43 (25.0%)
85 (22.2%)
109 (29.5%)
64 (41.3%)
1990
48 (27.9%)
99 (25.8%)
117 (31.6%)
56 (36.1%)
2000
81 (47.1%)
199 (51.9%)
144 (38.9%)
35 (22.6%)
WHO Region, n (%)
Africa
7 (4.1%)
23 (8.2%)
28 (7.6%)
8 (5.2%)
Americas
105 (61.0%)
198 (51.7%)
95 (25.7%)
26 (16.8%)
Europe / E. Mediterranean
6 (3.5%)
10 (2.6%)
6 (1.6%)
4 (2.6%)
South East Asian
8 (4.7%)
13 (4.6%)
46 (12.4%)
34 (21.9%)
Western Pacific
57 (33.1%)
147 (38.4%)
198 (53.5%)
83 (53.5%)
GINI Index, mean (SD)
0 (0)
41.6 (7.7)
40.4 (7.6)
41.2 (6.7)
GDP per capita, mean (SD)
0 (0)
14,612 (16,653)
9,532 (15,012)
15,199 (20,057)
Relative risk ratios for cyclone mortality from the final multinomial logistic regression model, using events with no deaths as the reference category, are presented in Table 4. Per capita GDP, WHO region and event decade were significantly associated with excess mortality, in particular for the mid- and high level mortality categories (10-99 deaths and ≥100 deaths, respectively). The proportion of events with mid- to high mortality levels decreased in the 1980s and 1990s, but during the 2000s, the relative risk ratios of mid- and high level mortality events were statistically similar to the 1970s. The Western Pacific region, where the highest proportion of mid- and high level mortality events occur, was used as the reference category for regional comparisons. Relative risk ratios for mid-level mortality events were significantly lower in the European/Eastern Mediterranean, Americas, and Southeast Asia regions as compared to the Western Pacific. Relative risk ratios for high level mortality events were statistically similar to the Western Pacific for all regions except the Americas with significantly lower risk. No significant relationship between GINI index and mortality risk was observed whereas GDP was inversely associated with risk of high mortality events.
*Model Statistics: N=953, chi-square p-value
1-9 deaths vs. no deaths
10-99 deaths vs. no deaths
≥100 deaths vs. no deaths
RRR (95%CI)
p-value
RRR (95%CI)
p-value
RRR (95% CI)
p-value
Decade
1980
Reference
Reference
Reference
1990
2.15 (0.89-5.18)
0.087
2.89 (1.18-7.03)
0.019
6.06 (1.95-18.72)
0.002
2000
1.93 (0.92-4.27)
0.098
1.31 (0.54-2.66)
0.597
1.03 (0.34-.3.06)
0.937
WHO Region
Western Pacific
Reference
Reference
Reference
Africa
1.04 (.11-1.97))
0.029
0.68 (0.32-1.44)
0.317
1.93 (0.73-5.09)
0.182
Americas
0.59 (.25-1.13)
0.054
0.38 (0.18-.82)
0.991
1.02 (0-1.09)
0.989
Europe / E. Mediterranean
0.67 (.14-1.26)
0.025
.25 (0.05-1.13)
0.073
1.79 (0.41-7.84)
0.437
South East Asia
0.75 (.16-1.19)
0.006
1.41 (0.49-4.04)
0.519
2.13 (0.80-5.66)
0.003
Gini Index
1.01 (.97-1.06)
0.203
0.97 (0.92-1.02)
0.21
0.97 (0.91-1.04)
0.382
GDP per capita
0.999 (.999-1.0)
0.936
0.999 (.999-.999)
<.001
0.999 (.999-.999)
<.001
Systematic Literature Review
Mortality. Among articles meeting inclusion criteria for full review (n=56), 34 reported mortality data including 16 that provided information on direct or indirect causes of death (Table 5) and 10 that reported sex-specific mortality counts or risk (Table 6) 11–66,80. Most articles provided some information about the distribution of deaths across population subgroups or an individual’s location at the time of the event; with one exception, all articles reported on hurricane impact in the United States. When aggregated, 54% of US hurricane deaths were classified as direct deaths and 43% as indirect deaths. Among direct deaths, drowning was the most common cause of death, accounting for 59% of direct deaths followed by trauma, which accounted for 39% of direct deaths. Among indirect deaths cause of death was less frequently reported however trauma was the most common cause of indirect death followed by motor vehicle accidents, carbon monoxide poisoning, fires or burns, and electrocution. When examined by sex, an increased mortality risk among men was observed in the eight of the ten studies that reported deaths by sex; males accounted for 59.4% of US hurricane deaths reported (Table 6). Studies that reported sex-specific mortality in the 1991 Bangladesh cyclone observed a higher mortality rates among females (71/1000) compared to males (15/1000) 20,21,22. Age was associated with increased mortality risk in numerous studies where both children 20,21,22, and older adults 22,57,58,60, experienced disproportionate mortality. Other risk factors for mortality included residence type 22,35, not reaching shelter 14,21, geographic location 20,36, race 57,58, flood level 57, and deforestation 28,61.
*direct deaths were assumed to have occurred during the event; **trauma includes blunt and penetrating trauma, crush injuries, and deaths from falling objects/debris; ***excluded from mortality totals to avoid double counting of deaths report in other sources
Event and Reporting Information
Total Deaths
Direct Deaths
Indirect Deaths
Mortality Timeframe
Publication
Storm
Data Source(s)
N
By Cause
N
By Cause
Pre-
During
Post
NR
MMWR, 198513
Elena, 1985
ER Depts, Mississippi
3
0
3
2 motor vehicle accidents, 1 electrocution
0
0
0
3
MMWR, 198916
Hugo, 1989
Medical Examiner, Puerto Rico
9
2
2 drownings
7
7 electrocutions
0
3
6
0
MMWR, 198917
Hugo, 1989
Medical Examiners and Coroners, S Carolina
35
13
6 drownings, 7 blunt trauma
16
3 trauma, 13 no cause reported
0
13
16
6
Philen, 1990***18
Hugo, 1989
Puerto Rico and S Carolina Medical Examiners & MMWRs
38
15
Not reported
23
Not reported
1
15
22
0
MMWR, 199219
Andrew, 1992
Florida Medical Examiner Offices
19
14
9 trauma, 4 asphyxia, 1 drowning
5
3 blunt trauma, 2 fire
0
14
3
2
Brewer, 1994***24
Hugo, 1989
ER Depts, S Carolina
4
1
1 blunt trauma
3
2 vehicle accidents, 1 intracranial hemorrhage
0
0
0
4
McNabb, 199525
Andrew, 1992
ER Depts and Coroner’s, Louisiana
14
6
6 drownings
8
1 motor vehicle accident, 7 no cause reported
8
6*
0
0
Combs, 199626
Andrew, 1992
Medical examiners and coroners, Florida and Louisiana
36
17
11 blunt trauma, 4 asphyxia, 2 drowning
19
3 falls, 3 fire, 3 vehicle accidents, 3 electrocutions, 2 plane crash, 2 trauma, 1 lightening strike, 1 asphyxia, 1 clean-up
2
17*
1
16
Lew, 1996***28
Andrew, 1992
Medical Examiner, Dade County, Florida
17
15
8 blunt trauma, 4 asphyxiation, 2 drownings, 1 decapitation
2
2 individuals could not be reached by EMS
0
17*
0
0
MMWR, 199648
Marilyn & Opal, 1995
Medical Examiners and Coroner’s, US Virgin Islands & Puerto Rico
34
18
9 blunt trauma, 8 drownings, 1 head trauma
16
7 motor vehicle accidents, 4 falling objects, 3 fires, 1 CO poisoning, 1 fall.
1
18*
7
8
MMWR, 200034
Floyd, 1999
ER Depts, N Carolina
48
36
36 drownings
12
7 motor vehicle accidents, 2 fire, 1 hypothermia, 1 fall, 1 unreported
0
36*
0
12
MMWR, 200439
Charley, 2004
Florida Medical Examiner Offices
25
9
Not reported
16
12 cause unreported, 3 CO poisoning, 1 electrocution
0
9*
0
16
Jani, 200646
Isabel, 2003
Virginia Medical Examiner’s and Health Statistics
30
12
7 drowning, 5 head injuries
18
6 motor vehicle crashes, 3 head/ neck injuries, 1 trauma, 1 heart attack, 7 in power outages
0
12*
0
18
MMWR, 200648
Katrina, 2005
Florida Medical Examiner and Dept. of Forensic Science (Alabama)
19
5
3 drowning, 2 blunt trauma
14
4 vehicle accidents, 2 falling tree, 2 CO poisoning, 1 fall, 1 drowning, 1 sepsis, 1 seizure, 1 traumatic brain injury, 1 asphyxia
0
5*
0
14
Brunkard, 200858
Katrina, 2005
Federal Disaster Mortuary Op. Response Team and Louisiana coroners
986
633
387 drowning, 246 trauma or injury
338
107 heart disease, 46 other illnesses, 185 unspecified Katrina related
7
650
4
325
Ragan, 200860
Florida, 2004-05
Florida Medical Examiners Comm. and Dept. of Health
213
41
27 trauma or injury, 14 drowning
172
86 trauma or injury, 45 non-accidental, 15 CO poisoning, 9 drowning, 7 burns/inhalation
20
66
127
213
Zane, 201180
Texas, 2008
CDC Surveillence data
74
10
8 drowning, 2 Hit by falling tree limb
49
13 carbon monoxide exposure, 8 cardiovascular failure, 28 multiple causes
7
0
67
0
Total Number (Percent)
1545
816
52.8%
693
44.8%
45
746
231
633
Summarized By Cause
Drownings, n=480, 58.8%; Trauma/injury,** n=313, 38.6%; Asphyxia, n=8, 1.0%; Head/ neck injuries, n=6, 0.7%; Other/not reported, n=9, 1.1%.
Trauma/injury,** n=101, 14.6%; Vehicle accidents, n=30, 4.3%; CO poisoning, n=34, 4.9%; Fire/burns, n=17, 2.6%; Electrocution, n=12, 1.7%; Drowning, n=9, 1.3%; Head/neck injuries, n=4, 0.6%; Other, n=250, 36.1%; and Not reported, n=206, 32.0%
2.9%
45.0%
13.9%
38.2%
Source
Storm
Location(s)
Gender most at risk
Deaths by Sex
Summary of gender-related mortality findings
Males
Females
Bern, 199221
Bangladesh, 1991
Bangladesh
Female
Mortality among females was higher than males for all age groups; for females, mortality increased with age.
Chowdury, 199322
Bangladesh, 1991
Bangladesh
Female
The female mortality rate was 71/1000 as compared to 15/1000 among males ages 20-44. Death rates were higher among females, and this was more pronounced in the young and old.
Combs, 199626
Andrew, 1992
Florida and Louisiana
Male
40
15
73% (40/55) of deaths were among males. Male and female mortality rates in Florida were 18.8 and 7.3 per 1,000,000, respectively. Male and female mortality rates in Louisiana were 5.8 and 1.2 per 1,000,000, respectively.
MMWR, 199630
Marilyn and Opal, 1995
Puerto Rico, Florida, N Carolina, Alabama, Georgia
Male
21
6
78% (21/27) of the deceased were male.
MMWR, 200034
Floyd, 1999
North Carolina
Male
38
14
73% (38/52) of the deceased were male.
MMWR, 200439
Charley, 2004
Florida
Male
24
7
77% (24/31) of the deceased were male.
Jani, 200646
Isabel, 2003
Virginia
Male
24
8
77% (24/32) of the deceased were male.
Sharkey, 200757
Katrina, 2005
Louisiana
Male
Males accounted for 65% of non-elderly deaths and 48% of the nonelderly population; 47% of elderly deaths were among males who accounted for 38% of the elderly population
Brunkard, 200858
Katrina, 2005
Louisiana
Male
512
459
53% (512/971) of the deceased were male.
Ragan, 200860
2004 & 2005 hurricanes
Florida
Male
162
51
76% (162/213) of deceased were male.
Zane, 201180
Ike, 2008
Texas
Male
52
22
70% were male.
Total
873
582
60%
40%
Injury. Injury data were reported in 28 of the 58 articles, 15 of which provided information on injury type (Table 7). Most articles reported that the majority of injuries were minor but it was not possible to aggregate injury data due to the different study designs, reporting methods, and data sources. Lacerations, wounds, contusions, blunt trauma, animal/insect bites, and motor vehicle injuries were among the most frequent types of injuries reported. The three population based surveys estimated injury rates between 3.8 and 4.5% 37,62,66. When assessed by age, injury rates were highest among middle age adults in numerous studies 13,25,32,40,53. Males were at higher risk for injury 13,24,25,54; in all studies but one in the studies that reported gender 22. Location was a risk factor for injury in many reports, including administrative unit or location relative to storm path 42, within a city 24,25,44, and being outdoors 25. Race was associated with increased injury risk in several studies, however, the race most at risk for injury varied 24,25,26,56. Only three articles presented injury data on storms outside the United States 11,62,65, reflecting the paucity of information from less developed countries and a need for additional research in cyclone injury epidemiology in these regions.
Publication
Event(s)
Study Type
Injuries Reported
Types of Injuries Reported
Additional Injury Findings
Mahajani, 197511
Cyclone Tracy, 1974
Facility, inpatient only
145
60 lacerations (41%), 50 blunt trauma (34%), 14 spinal cord injuries/ paraplegia (10%), 6 pelvis fractures (4%), 3 penetrating wounds (2%), 3 closed abdominal injuries (2%), 2 head injuries (1%), 1 amputation (<1%).
None
Longmire, 198412
Hurricane Frederic, 1979
Facility, ER visits
Not reported
Not reported
Lacerations, puncture wounds, chain saw injuries, burns, gasoline aspiration, gastrointestinal complaints, stings, and spouse abuse were found to increase following the storm.
MMWR, 198613
Hurricanes Elena & Gloria, 1985
Facility, ER visits
484
Lacerations (22%), abrasion or contusion (20%), sprain (14%) and fractures (12%).
89 records were visits related to the storm, 73 were injuries. 26 of 73 patients had lacerations and 11 had fractures.
Longmire, 198815
Hurricane Elena, 1985
Facility, ER visits
2623
Tables not legible
There was a significant increase in the number of patients treated for blunt trauma, chain saw injuries, and lacerations, following the storm.Top of FormBottom of Form
Lee, 199323
Hurricane Andrew, 1992
Facility, ER and outpatient
Not reported
Not reported
Injuries accounted for 15.7% and 23.7% of visits at civilian and military free care sites; among service members, injuries accounted for 36.2% of visits. During the 5 weeks after the hurricane, proportional morbidity from injury decreased.
Brewer, 199424
Hurricane Hugo, 1989
Facility, ER visits
1911
577 wounds (28%), 428 insect stings (21%) 279 sprains (12%), 241 contusions (12%), 177 fractures (8%), and 131 other injuries (6%), and 78 unknown (4%).
88% if hurricane diagnoses were injury related. Incidence of diagnoses varied by age, sex, race and care seeking location.
McNabb, 199525
Hurricane Andrew, 1992
Facility, ER visits
375
184 cuts/lacerations/puncture wounds (49%), 49 sprain/strain/ fracture (13%), 46 contusion/ impact (12%), 24 animal/insect bite (6%), 23 falls (6%), 23 rashes (6%), 15 crush injuries (4%), 10 burns (3%), 1 electrocution (<1%), and 62 other (17%).
Injuries accounted for 86% of non-fatal events. Injury rates were highest among middle age adults (30-39 yrs) and were concentrated geographically in three parishes.
MMWR, 199629
Hurricanes Marilyn and Opal, 1995
Facility, outpatient visits
234
80 lacerations/wounds (34%), 79 sprain/strain/fracture (34%), 37 motor-vehicle related injuries (16%), 38 other (16%).
Of 3265 facility visits, 1084 (33%) were storm-associated injuries involving minor wounds or musculoskeletal trauma.
Hendrickson, 199732
Hurricane Iniki, 1992
Facility, ER and inpatient
1584 post-storm
865 open wounds (55%), 196 sprains (13%) 148 contusions (9%), 122 superficial wounds (8%), 83 insect/animal bites (5%), 81 fractures (5%), 29 foreign bodies (2%), 23 burns (1%), 10 head injuries (1%), and 5 poisoning (<1%).
The relative risk for injury was 6.86 (95 CI: 5.98–7.87) in the two week period after the storm as compared to the two weeks prior to the event. Injury risk increased for all age and sex groups; open wounds and foreign objects injuries had the greatest increase post-storm.
MMWR, 200034
Hurricane Floyd, 1999
Facility, ER visits
~19780
Not reported
33% of ER visits (n=59,398) were injury related; soft tissue injuries accounted for 28% of ER visits (~16,631) and the majority of injuries.
Waring, 200237
Tropical Storm Allison, 2001
Population based post-disaster assessment
17 households
Not reported
Injury types included abrasion/cut/puncture and animal bites; no significant difference in injury was observed between individuals from flooded and non-flooded homes.
Keenan, 200438
Hurricane Hugo, 1999
Ecological
Not applicable
Not applicable
An increase in inflicted and non-inflicted traumatic brain injury was observed among young child in the 6 months following the storm.
Gagnon, 200540
Hurricane Isabel, 2003
Facility, ER visits
51 attributed to the storm
Most common injuries were lower extremity fractures (21%), abrasions/sprains (16%) and rib fractures (12%).
59% of injuries were tree related; most patients had severe and multiple injuries and one-third were admitted. Males age 50-60 had the highest incidence of injury.
MMWR, 200541
Hurricane Katrina, 2005
Facility, ER and outpatient
2018
716 unintentional injuries including cuts, blunt trauma, burns and environmental exposures (36%), 464 falls (23%), 311 bites/stings (15%), 145 vehicle crash injuries (7%), 42 intentional injuries (2%), 27 other toxic exposure (1%), 14 CO poision (1%) and 299 unknown (15%).
14% of visits were relief workers, 34% were residents, and 52% were unknown; relief workers were 5.8 (CI:5.0-6.8) times more like to be treated in nonhospital facilities than residents.
MMWR, 200542
4 Florida hurricanes in 2004
Telephone survey
1690
Not reported
Physical injuries caused by the hurricanes were reported by 4.6% of persons in the hurricane paths and 3.8% not in the hurricane paths.
Smith, 200543
Hurricane Isabel, 2003
Observational cohort, ER patients
Not reported
Not reported
Cases of major trauma decreased by 50% and minor trauma increased by 57% in the 5 day post-landfall period.
Waring, 200544
Tropical Storm Allison, 2001
GIS based post-disaster assessment
Not reported
Injuries were minor; the most common injury types reported were cuts/scrapes/scratches, animal/insect bites, and blunt trauma/bruising.
Persons in flooded homes were 4.8 (CI:1.9-12.8) times more likely to be injured than those living in non-flooded homes.
Brodie, 200645
Hurricane Katrina, 2005
Post-disaster survey in shelters
Not reported
Not reported
33% of evacuees with children and 29% without children were injured; 13% in each group reported serious injuries. Those who evacuated prior to the storm had a 26% injury rate as compared to 37% of those who did not evacuate.
MMWR, 2006 47
8 Florida hurricanes, 2004-05
Health facility
Not reported
Not reported
Increased number of CO poisonings and hydrocarbon fuel exposures were observed in the post-storm periods.
MMWR, 200650
Hurricane Katrina, 2005
Facility, ER and outpatient
10298
Not reported
Between Sept 5-11, there 4,391 visits for injuries, including 1,324 (30%) for tetanus vaccination with no further injury description. Between Sept 12-Oct 11 (after active surveillance) there were 5,907 visits for injuries including 497 (8%) major and 5,410 (92%) minor injuries.
MMWR, 200651
Hurricane Katrina, 2005
Facility, ER and outpatient
4579
2,411 unintentional injuries including cuts, blunt trauma, burns and environmental exposures (53%), 992 falls (22%), 416 vehicle crash injuries (9%), 339 animal/insect bites (7%), 89 intentional injuries (2%), 34 toxic exposure/poisoning (<1%), and 298 unknown (7%).
Residents had a higher proportion of falls and motor vehicle accidents and a lower proportion of unintentional injuries as compared to relief workers.
Sullivent, 200653
Hurricane Katrina, 2005
Facility, ER and outpatient
7543
Cut/pierce/stab (20%), fall (20%), struck by/against/ crushed (11%), bite/sting (9%), and motor-vehicle crash (8%).
The leading mechanisms of injury were falls and cut/stab/pierce sounds, with a greater proportion of residents being injured as compared to relief workers; clean-up was the most common activity at the time of injury for both groups.
Shen, 200962
Typhoon Saomei, China, 2006
Town census
136
71 cut/stabbed (55%), 41 blunt trauma (32%) 13 falls (10%), 3 crushed (2%) and 1 drowning (<1%).
Injury rate of 4.5%, including 7 deaths resulting from injury. Residences facing the sea, end units, non-reinforced windows/doors, and staying near a window/door or in a damaged room were associated with increased injury risk.
Uscher-Pines, 200963
Hurricane Katrina, 2005
Review of medicare claims (older adults)
3870 in the year following the storm
1678 sprains/strains (43%), 1026 other fractures (27%), 980 lacerations (25%), and 186 hip fractures (5%)
Prevalence of all injury types increased post-storm; displaced storm victims were at increased risk for hip (OR 1.53, CI: 1.10-2.13) and other (OR 1.24, CI: 1.07-1.44) fractures.
Kim, 201065
Cyclone Nargis, 2008
Outpatient medical record review
128
Not reported
5% of patients had trauma/injuries of which 29% were directly related to the cyclone
Norris, 201066
Hurricane Ike, 2008
Population based survey
37
Not reported
Injury rate of 3.8%; risk of injury increased with damage and decreased with evacuation.
Faul, 201179
Hurricane Katrina, 2005
Outpatient medical record review
1130
Injuries to the elbows/wrist/hand/finger (rate = 38.9; 95% CI = 28.3-52.2), face/trunk/shoulder/upper arm (rate = 31.8; 95% CI = 22.3-44.1), and leg/foot/toe (rate =151.2; 95% CI = 129.4-175.7).
Significantly more wound injuries to the lower extremities (rate = 13.7; 95% CI = 11.6-16) and upper limbs (rate = 6.5; 95% CI =5.1-8.2).
Discussion
Main Findings
In the 30 year period between 1977 and 2009, approximately 466 million people were affected by cyclones; 20.1 million left homeless, 412,000 people died and 290,000 were injured, excluding an estimated 28,000 to 114,000 unrecorded injuries. The mortality estimate presented in this study is consistent with recent estimates in other studies 67, but the numbers injured and displaced are likely gross underestimates given the low frequency with which these figures are reported. Findings from the historical event review are also consistent with previous observations that cyclone mortality varies by region, economic development level, and event severity.Cyclone impacts were concentrated in the Asia-Pacific region and the majority of fatalities occurred in developing nations. High mortality events, with death tolls in excess of 1000, occur in less than 2% of events and more than two-thirds of all cyclone deaths between 1980 and 2009 occurred in two events (Cyclone Gorky, Bangladesh 1991 and Cyclone Nargis, Myanmar 2008). The number of cyclones and deaths increased each decade but the average number of deaths per storm decreased. Human vulnerability to cyclones will increase in future years due to population growth, urbanization, increased coastal settlement, poverty, and changing weather patterns which is associated with an increase in the number of high intensity cyclones.
A significant disparity between cyclone mortality in developing and developed nations persists, though apart from simple casualty counts there is little information available on the epidemiology of cyclone morbidity and mortality in less developed countries. This indicates a need for additional research outside of the US. The United Nations Development Program (UNDP) identified 29 developing nations and four developed nations that are at risk for cyclones 67 but 42% and 27% of cyclone deaths in the past two centuries have occurred in Bangladesh and India, respectively 68. Additionally, the majority of high-fatality storms occurred in the latter half of the 20th century though no developed nation sustained more than 1000 deaths from a cyclone in this time period67,69. The leading explanations for regional differences in mortality is the size of the at risk population and the capacity for pre-event evacuation. Higher population densities in the Western Pacific and South East Asia where dense settlements in low lying areas are associated with increased risk of death in from storm surge 70,71. A higher economic development among the countries in the Americas is associated with lower regional mortality rates because of increased capacity to evacuate. Prior to the implementation of early warning, evacuation, and shelter systems an estimated 90% of cyclone mortality was attributed to storm surge drowning 72,73,74,75,76. Improvements in forecasting, and early warning systems and in evacuation and shelter procedures, particularly in developed countries, have reduced storm-surge related mortality and increased proportional morbidity and mortality in the post-impact period 16,19,69.
Comparison with Previous Reviews
Findings of this review were contrary to the conclusions of other recent reviews which concluded that most storm-related mortality in developed countries occurs in the post-impact period 69. In the systematic literature review, 79% of the 946 included deaths where storm phase was reported occurred during the impact period. Direct and indirect deaths, respectively, accounted for 56% and 44% of deaths (n=1450 deaths where cause was reported) and the primary causes of death were drowning (33%), direct injuries or trauma (21%), and indirect injuries or trauma (7%). Studies that included gender breakdown for cyclone-related deaths, most of which are accounts of cyclone events in the United States, consistently reported greater proportion of male as compared to female deaths; when aggregated, males accounted for 59% of reported US hurricane deaths. In less developed countries females face a greater mortality risk 21,22. An increased risk of death in younger 20,21,22, and older populations 22,57,58,60, was also observed which is consistent with broader natural disaster mortality trends. However, it is important to note that primary research on cause and timeframe of death as well as demographic and other factors associated with increased mortality risk is limited almost completely to the United States. Future studies on the human impacts of cyclones should be focused in Southeast Asia and the Western Pacific, the regions where the majority of cyclone impacts occur.
While minimal data on cyclone-related injuries and mortality is available from less developed settings, it can be presumed that developing nations also bear the burden of cyclone-attributable injury where the frequency and severity of injuries are inversely related to degree of physical protection 69. Minor trauma is common among the injured, including lacerations, abrasions and contusions, puncture wounds, and sprains and fractures 11,13,24,25,29,32,40,41,51,53,62,63. The majority of those injured in cyclones can be treated on an outpatient basis and do not require sophisticated surgical or inpatient care 5,77. Reported causes of death and injury in more developed countries during the post-impact phase include blunt trauma, vehicle accidents, carbon monoxide poisoning, burns and fires, electrocution, and chain-saw injuries. As compared to needs for food, water, shelter, and sanitation, injuries are not usually a major public health problem in the post-impact phase 78 This suggests and that mobile field hospitals and specialized surgical teams may be ineffective responses and that non-medical relief may be a more appropriate strategy for morbidity and mortality reduction in the aftermath of cyclones 5.
Limitations
The availability and quality of data has likely increased and improved over time, however, in many events deaths, injuries, and affected population size are unknown or unrecorded. For most events no data were reported for injured, displaced, and affected populations, contributing to underestimation of impacts. Inconsistencies and errors were common in data from different sources that called into question the reliability of available data. In some cases inclusion criteria and definitions were not ideal which created difficulties in reconciling event lists. Challenges were encountered when modeling cyclone mortality including a non-normal distribution, which necessitated analysis with a categorical outcome. Information on 2007-2009 GDP and 2009 GINI index were used for analysis regardless of the event year, but these values may have been different for events in the 1980s. Additionally, some countries did not exist or have merged with other nations since the 1980s and many of the smaller island countries in the Caribbean are territories of European countries which necessitated the use of GDP, GINI, and development levels which may not be representative of realities in the cyclone affected area and/or time period. When combined with uncertainty in the historical record and the relative paucity of primary research focusing on cyclone impacts in heavily affected Asian region, conclusions that can be drawn about cyclones impacts on human populations are limited. Other principal limitations of the literature review are 1) that an in-depth quality analysis of all reviewed articles was not undertaken, and 2) the fact that only English language publications were included which likely contributed to incomplete coverage of studies published in other languages originating from low and middle income countries.
Conclusions
Analysis of the impact of cyclones on human populations is challenging given the paucity of data from the most affected regions, the occasional occurrence of extreme high mortality events, and the reporting inconsistencies including both lack of standardized definitions and temporal changes in collection procedures, completeness and accuracy of data. However, even with this under-representation the impact of cyclones is huge, with 466 million people affected, 412,644 deaths and 290,654 injuries were reported as a result of cyclones between 1980 and 2009. The primary cause of cyclone-related mortality in both developed and less developed countries was storm surge drowning. In more developed countries an increased proportion of deaths and injuries were observed in the aftermath of cyclones as a result of improved early warning systems and evacuation. Male gender was associated with increased mortality risk in developed countries, whereas female gender was linked to higher mortality risk in less developed countries. Both older and younger population sub-groups also face an increased mortality risk.
Cyclones have significantly impacted populations in Southeast Asia, the Western Pacific, and the Americas regions over the past quarter of a century with less developed nations in Asia bearing the majority of the mortality and injury burden. Additional preparedness and mitigation strategies, particularly in less developed countries where the majority of cyclones occur, can lessen the impact of future events. In particular, improvements in forecasting, early warning systems, evacuation and shelter procedures, and public education on safety precautions and post-impact hazards could reduce cyclone-related morbidity and mortality in future decades.
Competing Interests
The authors have no competing interests to declare.
Correspondence
Shannon Doocy, Johns Hopkins Bloomberg School of Public Health, 615 N. Wolfe St, Suite E8132, Baltimore, MD 21230. Tel. 410-502-2628. Fax: 410-614-1419. Email: [email protected].
Acknowledgements
We are grateful to Sarah Bernot, Dennis Brophy, Georgina Calderon, Erica Chapin, Joy Crook, Anjali Dotson, Shayna Dooling, Charlotte Dolenz, Rachel Favero, Annie Fehrenbacher, Janka Flaska, Homaira Hanif, Sarah Henley-Shepard, Marissa Hildebrandt, Esther Johnston, Gifty Kwakye, Lindsay Mathieson, Siri Michel, Karen Milch, Sarah Murray, Catherine Packer, Evan Russell, Elena Semenova, Fatima Sharif, and Michelle Vanstone for their involvement in the systematic literature review and historical event review compilation. We would also like to thank John McGready for biostatistical support, Claire Twose assistance in designing and implementing the systematic literature review, and Hannah Tappis and Bhakti Hansoti for their support in the revision process.Appendix 1
PRISMA Checklist
References
- EM-DAT the International Disaster Database. (2011). Available at: https://www.emdat.be/disaster-profiles. Accessed March 4, 2011.
- Tropical Cyclone Introduction. National Weather Service: JetStream – Online School for Weather. September 1, 2009. Available at: https://www.srh.noaa.gov/srh/jetstream/tropics/tc.htm. Accessed November 29, 2009.
- Glossary of NHC Terms. National Weather Service: National Hurricane Center. June 17, 2009. Available at: https://www.nhc.noaa.gov/aboutgloss.shtml. Accessed November 29, 2009.
- Tropical Cyclone. American Meteorological Society: Glossary of Meteorology. Available at: https://amsglossary.allenpress.com/glossary/search?id=tropical-cyclone1. Accessed November 30, 2009.
- Noji, E. Public Health Issues in Disasters. Critical Care Medicine 2000;33(1)S29-S33:56-58.
- Dilley M, Chen R, Deichmann U et al. Natural disaster hotspots: a global risk analysis—synthesis report. Washington DC: The World Bank, 2005.
- Center for Research on the Epidemiology of Disasters Emergency Events Database (CRED EM-DAT). Available at URL: https://www.emdat.be/Database/terms.html. Originally accessed May 24, 2007 with subsequent update on September 4, 2009.
- The National Hurricane Center, NOAA. Available at URL: https://www.nhc.noaa.gov/pastall.shtml#tcr. Accessed September 2009 to February 2010 for abstraction of storm event data.
- StataCorp. (2009). Stata statistical software: release 11.0.
- UNDP. Human Development Report 2009. New York: UNDP, 2009.
- Mahajani AG. Darwin and cyclone Tracy. Christmas 1974. Ann R Coll Surg Engl. 1975;57(5):274-5.
- Longmire AW and Ten Eyck RP. Morbidity of Hurricane Fredric. Ann Emerg Med. 1984; 13(5):334-8
- Centers for Disease Control. Epidemiologic Notes and Reports Hurricanes and Hospital Emergency-Room Visits -- Mississippi, Rhode Island, Connecticut. MMWR Morb Mortal Wkly Rep. 1986;34(51-52):765-70.
- Siddique AK and Eusof A. Cyclone deaths in Bangladesh, May 1985: who was at risk. Trop Georg Med. 1987;39(1):3-8.
- Longmire AW, Burch J, Broom LA. Morbidity of Hurricane Elena. South Med J. 1988;81(11):1343-6.
- Centers for Disease Control. Medical examiner/corner reports of deaths associated with Hurricane Hugo—Puerto Rico. MMWR Morb Mortal Wkly Rep. 1989 38(42):718-20,725.
- Centers for Disease Control. Medical examiner/corner reports of deaths associated with Hurricane Hugo—South Carolina. MMWR Morb Mortal Wkly Rep. 1989 38(44):754, 759-62.
- Philen RL, Combs DL, Miller L, et al. Hurricane Hugo-related Deaths: South Carolina and Puerto Rico, 1989. Disasters. 1990. 16(1):53-59.
- Centers for Disease Control. Preliminary report: medical examiner reports of deaths associated with Hurricane Andrew—Florida, August 1992. MMWR Morb Mortal Wkly Rep. 1992 41(35):641-4.
- Rahman MO and Bennish M. Health related response to natural disasters: the case of the Bangladesh cyclone of 1991. Soc Sci Med. 1993; 36(7):903-14.
- Bern C, Sniezek J, Mathbor GM, et al. Risk factors for mortality in the Bangladesh cyclone of 1991. Bull World Health Organ. 1993; 71(1):73-8.
- Chowdury AM, Bhuyia AU, Choudhury AY, et al. The Bangladesh cyclone of 1991: why so many people died. Disasters. 1993:17(4):291-304.
- Lee LE, Fonseca V, Brett KM, et al. Active morbidity surveillance after Hurricane Andrew—Florida, 1992. JAMA. 1993; 270(5):591-4.
- Brewer RD, Morris PD, Cole TB. Hurricane-related emergency department visits in an inland area: an area of the public health impact of Hurricane Hugo in North Carolina. Ann Emerg Med. 1994; 23(4):731-6.
- McNabb SJ, Kelso KY, Wilson SA, et al. Hurricane Andrew-related injuries and illnesses, Louisiana, 1992. South Med J. 1995;88(6):615-8.
- Combs DL, Parish RG, McNabb SJ, et al. Deaths related to Hurricane Andrew in Florida and Louisiana, 1992. Int J Epidemiol. 1996;25(3):537-44.
- Hendrickson LA, Vogt RL. Mortality of Kauai residents in the 12-month period following Hurricane Iniki. Am J Epidemiol. 1996;144(2):188-91.
- Lew EO, Wetli CV. Mortality from Hurricane Andrew. J Forensic Sci. 1996;41(3):449-52.
- Centers for Disease Control. Surveillance for injuries and illnesses and rapid health-needs assessment following Hurricanes Marilyn and Opal, September-October, 1995. MMWR Morb Mortal Wkly Rep. 1996 45(4):81-5.
- Centers for Disease Control. Deaths associated with Hurricanes Marilyn and Opal—United States, September-October, 1995. MMWR Morb Mortal Wkly Rep. 1996 45(2):32-8.
- Smith SK, McCarty C. Demographic effects of natural disasters: a case study of Hurricane Andrew. Demography. 1996;33(2)265-75.
- Hendrickson LA, Vogt RL, Goebert D, et al. Morbidity on Kauai before and after Hurricane Iniki. Prev Med. 1997; 26(5 Pt 1):711-6.
- Centers for Disease Control. Deaths associated with Hurricane Georges—Puerto Rico, September 1998. MMWR Morb Mortal Wkly Rep. 1992 47(42):897-8.
- Centers for Disease Control. Morbidity and mortality associated with Hurricane Floyd—North Carolina, September-October 1999. MMWR Morb Mortal Wkly Rep. 2000 49(17):369-72.
- Guill CK, Shandera WX. The effects of Hurricane Mitch on a community in Northern Honduras. Prehosp Disaster Med. 2001;16(3):166-71.
- O’Hare G. Hurricane 07B in the Godavari Delta, Andhra Pradesh, India: vulnerability, mitigation and the spatial impact. The Geographical Journal. 2001;167: 23-38.
- Waring SC, Reynolds KM, D'Souza G, et al. Rapid assessment of household needs in the Houston area after Tropical Storm Allison. Disaster Manag Response. 2002 Sep:3-9.
- Keenan HT, Marshall SW, Nocera MA, et al. Increased incidence of inflicted traumatic injury in children after a natural disaster. Am J Prev Med. 2004;26(3):189-93.
- Centers for Disease Control. Preliminary medical examiner reports of mortality associated with Hurricane Charley—Florida 2004. MMWR Morb Mortal Wkly Rep. 2004;53(36):835-7.
- Gagnon EB, Aboutanos MB, Mathora AK et al. In the wake of Hurricane Isabel: a prospective study of postevent trauma and injury control strategies. Am Surg. 2005;71(3):194-7.
- Centers for Disease Control and Prevention. Surveillance for illness and injury after hurricane Katrina--New Orleans, Louisiana, September 8-25, 2005. MMWR Morb Mortal Wkly Rep. 2005;54(40):1018-21.
- Centers for Disease Control and Prevention. Epidemiologic assessment of the impact of four hurricanes--Florida, 2004. MMWR Morb Mortal Wkly Rep. 2005;54(28):693-7.
- Smith CM, Graffeo CS. Regional impact of Hurricane Isabel on emergency departments in coastal southeastern Virginia. Acad Emerg Med. 2005;12(12):1201-5.
- Waring S, Zakos-Feliberti A, Wood R, et al. The utility of geographic information systems (GIS) in rapid epidemiological assessments following weather-related disasters: methodological issues based on the Tropical Storm Allison Experience. Int J Hyg Environ Health. 2005;208(1-2):109-16.
- Brodie M, Weltzien E, Altman D, et al. Experiences of hurricane Katrina evacuees in Houston shelters: implications for future planning. Am J Public Health. 2006;96(8):1402-8.
- Jani AA, Fierro M, Kiser S, et al. Hurricane Isabel-related mortality—Virginia, 2003. J Public Health Manag Pract. 2006;12(1)97-102.
- Centers for Disease Control. Monitoring poison control center data to detect health hazards during hurricane season--Florida, 2003-2005. MMWR Morb Mortal Wkly Rep. 2006;55(15):426-8.
- Centers for Disease Control and Prevention. Mortality associated with Hurricane Katrina--Florida and Alabama, August-October 2005. MMWR Morb Mortal Wkly Rep. 2006;55(9):239-42.
- Centers for Disease Control and Prevention. Carbon monoxide poisoning after hurricane Katrina--Alabama, Louisiana, and Mississippi, August-September 2005. MMWR Morb Mortal Wkly Rep. 2005;54(39):996-8.
- Centers for Disease Control and Prevention. Surveillance for illness and injury after Hurricane Katrina--three counties, Mississippi, September 5-October 11, 2005. MMWR Morb Mortal Wkly Rep. 2006 Mar 10;55(9):231-4.
- Centers for Disease Control and Prevention. Injury and illness surveillance in hospitals and acute-care facilities after Hurricanes Katrina And Rita--New Orleans area, Louisiana, September 25-October 15, 2005.MMWR Morb Mortal Wkly Rep. 2006 Jan 20;55(2):35-8.
- Centers for Disease Control and Prevention. Rapid assessment of health needs and resettlement plans among Hurricane Katrina evacuees-San Antonio, Texas, September 2005. MMWR Morb Mortal Wkly Rep. 2006 Mar 10;55(9):242-4.
- Sullivent EE 3rd, West CA, Noe RS, et al. Nonfatal injuries following Hurricane Katrina—New Orleans, Louisiana, 2005. J Safety Res. 2006;37(2):213-7.
- Vest JR, Valadez AM. Health conditions and risk factors of sheltered persons displaced by Hurricane Katrina. Prehosp Disaster Med. 2006;21(2):55-8.
- DeSalvo KB, Hyre AD, Ompad DC, et al. Symptoms of posttraumatic stress disorder in a New Orleans workforce following Hurricane Katrina. J Urban Health. 2007;84(2):142-52.
- Ghosh TS, Patnaik JL, Vogt RL. Rapid needs assessment among Hurricane Katrina evacuees in metro-Denver. J Health Care Poor Underserved. 2007;18(2):362-8.
- Sharkey P. Survival and death in New Orleans: an empirical look at the human impact of Katrina. J Black Studies. 2007;37(4):482-501.
- Brunkard J, Namulanda M, and Ratard R. Hurricane Katrina Deaths, Louisiana, 2005. Disaster Med Public Health Prep 2008;2(4):215-23.
- Eavey J, Ratard R. Post-Katrina mortality in the greater New Orleans area, Louisiana. J La State Med Soc 2008;160(5):267-72.
- Ragan P, Schulte J, Nelson S et al. Mortality surveillance: 2004 to 2005 Florida hurricane-related deaths. Am J Forensic Med Pathol 2008;29(2):148-53.
- Das S and Vincent J. Mangrove protected villages and reduced death toll during Indian super cyclone. PNAS 2009;106(18):7357-7360.
- Shen J, Feng Z, Zeng G et al. Risk factors for injury during typhoon Saomei. Epidemiology 2009; 20(6):892-5.
- Uscher-Pines L, Vernick J, Curriero F. Disaster related injuries in the period of recovery: the effect of prolonged displacement on risk of injury in older adults. J Trauma 2009;67(4):834-40.
- Kanter R. Child mortality after hurricane Katrina. Disaster Med Public Health Prep 2010;(4)4:62-5.
- Kim H, Baik Han S, Kim J et al. Post-Nargis medical care: experience of a Korean disaster relief team in Myanmar after the cyclone. Eur J Emerg Med 2010;17:37-41.
- Norris F, Sherrieb K, and Galea S. Prevalence and consequences of disaster related illness and injury from hurricane Ike. Rehabilitation Psychology 2010;55(3):221-230.
- United Nations Development Programme. Reducing disaster risk: a challenge for development. New York, NY: John S. Swift Company, 2004.
- Nicholls RJN, Mimura N, Topping JC. Climate change in south and south-east Asia: some implications for coastal areas. J Glob Environ Eng. 1995;1:137–54.
- Shultz JM, Russel J, Espinel Z. Epidemiology of tropical cyclones: the dynamics of disaster, disease, and development. Epidemiologic Reviews. 2005; 27:21-35.
- Chowdhury M, Choudhury Y, Bhuiya A, et al. Cyclone aftermath: research and directions for the future. In: Hossain H, Dodge CP, Abed FH, eds. From crisis to development: coping with disasters in Bangladesh. Dhaka, Bangladesh: University Press, 1992:101–33.
- Diacon D. Typhoon resistant housing in the Philippines: the Core Shelter Project. Disasters. 1992;16:266–71.
- Malilay J. Tropical cyclones. In: Noji EK, ed. The public health consequences of disasters. New York, NY: Oxford University Press, 1997:207–27.
- Alexander D. Natural disasters. New York, NY: Chapman and Hall, Inc, 1993.
- Meredith JT, Bradley S. Hurricanes. In: Hogan DE, Burstein JL, eds. Disaster medicine. Philadelphia, PA: Lippincott Williams & Wilkins, 2002:179–86.
- Department of Regional Development and Environment, Organization of American States. Disasters, planning, and development: managing natural hazards to reduce loss. Washington, DC: Organization of American States, 1990.
- French JG. Hurricanes. In Gregg MB (ed) The Public Health Consequences of Disasters. Atlanta: Centers for Disease Control, 1989.
- Noji EK. Analysis of medical needs in disaster caused by tropical cyclones: the need for a uniform injury reporting scheme. Journal of Tropical Medicine and Hygiene. 1993;96:370-76.
- Noji EK. The Public Health Consequences of Disasters. New York and Oxford, Oxford University Press, 1997.
- Faul M, Weller N, Jones J .Injuries after hurricane Katrina among Gulf Coast evacuees sheltered in Houston, Texas. Journal of Emergency Nursing, 2011; 37:460-8.
- Zane D, Bayleyegn T, Hellsten J, Beal R, Beasley C, Haywood T, Wiltz-Beckham D, Wolkin A. Tracking Deaths Related to Hurricane Ike, Texas, 2008. Disaster Medicine and Public Health Preparedness. 2011; 5:23-28.
Leave a Comment
You must be logged in to post a comment.