
Abstract
Background: The El Niño/Southern Oscillation (ENSO) is a global climate phenomenon that impacts human infectious disease risk worldwide through droughts, floods, and other climate extremes. Throughout summer and fall 2014 and winter 2015, El Niño Watch, issued by the US National Oceanic and Atmospheric Administration, assessed likely El Niño development during the Northern Hemisphere fall and winter, persisting into spring 2015.
Methods: We identified geographic regions where environmental conditions may increase infectious disease transmission if the predicted El Niño occurs using El Niño indicators (Sea Surface Temperature [SST], Outgoing Longwave Radiation [OLR], and rainfall anomalies) and literature review of El Niño-infectious disease associations.
Results: SSTs in the equatorial Pacific and western Indian Oceans were anomalously elevated during August-October 2014, consistent with a developing weak El Niño event. Teleconnections with local climate is evident in global precipitation patterns, with positive OLR anomalies (drier than average conditions) across Indonesia and coastal southeast Asia, and negative anomalies across northern China, the western Indian Ocean, central Asia, north-central and northeast Africa, Mexico/Central America, the southwestern United States, and the northeastern and southwestern tropical Pacific. Persistence of these conditions could produce environmental settings conducive to increased transmission of cholera, dengue, malaria, Rift Valley fever, and other infectious diseases in regional hotspots as during previous El Niño events.
Discussion and Conclusions: The current development of weak El Niño conditions may have significant potential implications for global public health in winter 2014-spring 2015. Enhanced surveillance and other preparedness measures in predicted infectious disease hotspots could mitigate health impacts.
Funding Statement
This work was made possible by funding from the DoD Armed Forces Health Surveillance Center, Global Emerging Infections Surveillance and Response System (AFHSC/GEIS) under the Human Febrile and Vector–Borne Illnesses (FVBI) Program; the National Aeronautics and Space Administration, Goddard Space Flight Center; and US Department of Agriculture, Agricultural Research Service. No individuals employed or contracted by the funders (other than the named authors) played any role in study design, data collection and analysis, decision to publish, or preparation of the manuscript.Background
The El Niño/Southern Oscillation (ENSO) is a large-scale ocean-atmosphere phenomenon that involves a warming or cooling of sea surface temperature (SST) across the central and east-central equatorial Pacific Ocean. El Niño and La Niña, the warm and cold phases, respectively, of the ENSO cycle, impact human health across much of the world through increased risk of natural disasters, such as droughts, floods, and tropical cyclones. These in turn affect agricultural yields, cause air pollution due to landscape fires, and enable transmission of various infectious diseases1,2,3.
During the summer and fall of 2014 and winter of 2015, the US National Oceanic and Atmospheric Administration (NOAA) Climate Prediction Center (CPC) issued an El Niño Watch. The most recent estimate of January 8, 2015 assessed an approximately 50-60% chance of El Niño developing during the next 2 months (Northern Hemisphere winter) and persisting into spring 4. There are uncertainties about its evolution, but consensus favors a weak event.
Following a strong El Niño in 1997-1998, US Government organizations and international partners collaborated to initiate a climatological monitoring program as part of a global surveillance network for emerging infectious diseases5,6. This effort provided early warning of public health impacts associated with the 2006-2007 El Niño7,8,9, and issues monthly10 and ad hoc updates of ENSO assessments and possible ENSO-associated infectious disease risks. Here we draw on recent climatological data, and historical El Niño-health associations, to assess the likelihood of El Niño in coming months. We identify geographic regions where infectious disease transmission may increase if the predicted El Niño occurs.
Methods
Detailed descriptions of the El Niño indicators and other climatological data used in our program are available elsewhere7. We typically express measurements as anomalies, or deviations from the long-term, month-specific or seasonal (3-month) mean. Briefly, the indicators include:
To identify regions at risk for El Niño-associated infectious disease activity, we used the literature review of Kovats et al.1and replicated their search strategy in PubMed to identify subsequent publications (May 2002-November 2014). We supplemented these results with subjective assessments of possible El Niño impacts.
Results
SSTs in the NINO3.4 and WIO regions reached higher-than-normal temperatures in October 2014 (+0.49°C and +0.48°C, respectively, just below the +0.5°C threshold that must persist for an El Niño event to occur) after cooling during the summer.
The tongue-appearing pattern of the SST anomaly off the Peruvian coast, with SST anomalies ≈ +1.5°C along the equator, is typical of a developing El Niño event (Figure 1).
Above-normal SSTs persisted in the equatorial eastern Pacific Ocean along the equator (≈ +1.5°C) and in the equatorial Indian Ocean (≈ +0.5-1.0°C). The tongue-like structure of the SST anomaly off the Peruvian coast is typical of a developing El Nino event.
Fig. 1: Sea Surface Temperature (SST) Anomalies, October 2014.
WIO warming (anomalies ≈ +0.5°C to +1.0°C) off the east African coast also is consistent with previous El Niño events. Anomalous positive SST in the eastern Pacific Ocean drives tropical and extra-tropical convective activity influencing global rainfall and temperature patterns.
The SST anomalies during August-October 2014 are comparable to those preceding the 2006-2007 El Niño, with more extreme elevations in the WIO and less extreme but positive and rising NINO3.4 elevations (Table 1).
2006
2014
WIO
NINO3.4
WIO
NINO3.4
August
+0.17
+0.40
-0.00
+0.20
September
+0.09
+0.62
+0.09
+0.45
October
+0.17
+0.78
+0.48
+0.49
Some impacts from the current SST anomaly patterns can be observed in the pattern of global convective activity illustrated by the OLR anomaly patterns. During August through October 2014, large positive departures (>+35 watts per meter squared [W/m2]) in OLR across Indonesia and coastal southeast Asia indicate drier than average conditions, while large negative departures (<-40 W/m2) across northern China, the western Indian Ocean, central Asia, north-central and northeast Africa, Mexico/Central America, the southwestern United States, and the northeastern and southwestern tropical Pacific suggest wetter than normal conditions (Figure 2).
Used to infer tropical precipitation, current OLR anomalies show very dry conditions (brown to red colors) across Indonesia and most of southeast Asia and enhanced precipitation across northern China, the western Indian Ocean, central Asia, north-central and northeast Africa, Mexico/Central America, the southwestern United States, and the northeastern and southwestern tropical Pacific.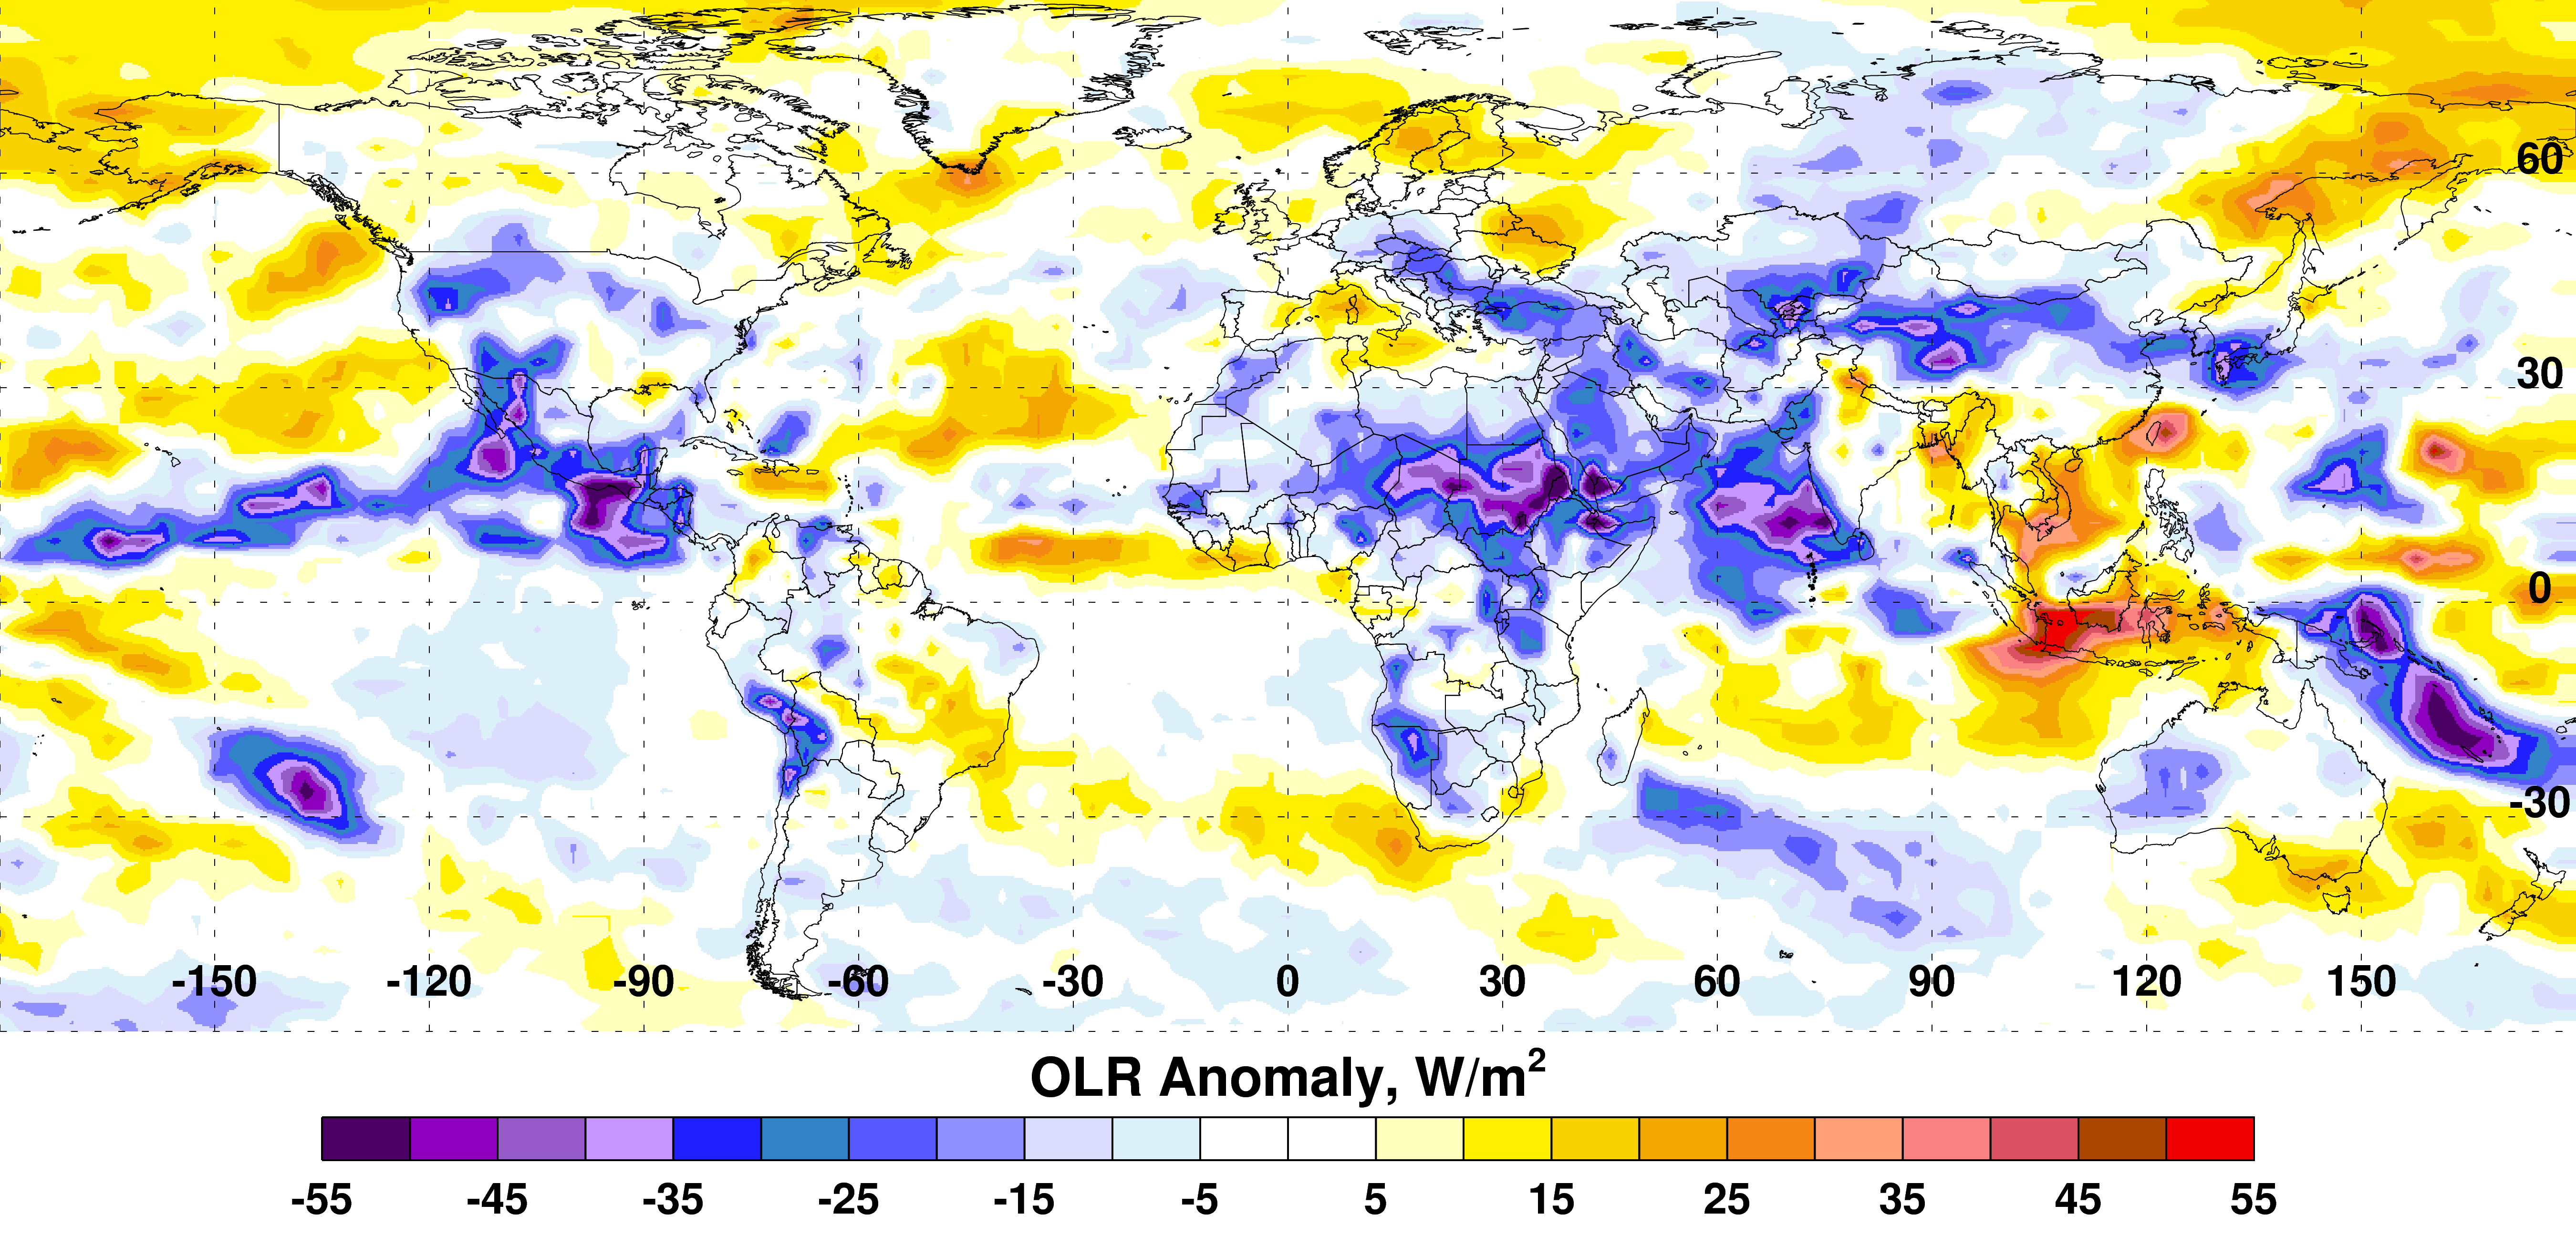
Fig. 2: Outgoing Longwave Radiation (OLR) Anomalies, August-October 2014.
Further details of current ENSO conditions are available on the Climate Prediction Center website4 and the Rift Valley fever (RVF) Monitor website10.
The dramatic shifts in large-scale convective centers around the global tropics during El Niño lead to extreme weather conditions, with above-normal rainfall and flooding in some regions and unusually high temperatures and drought conditions in others (Figure 3).
El Niño events are associated with extremes of elevated or depressed rainfall (blue/green or yellow/red, respectively).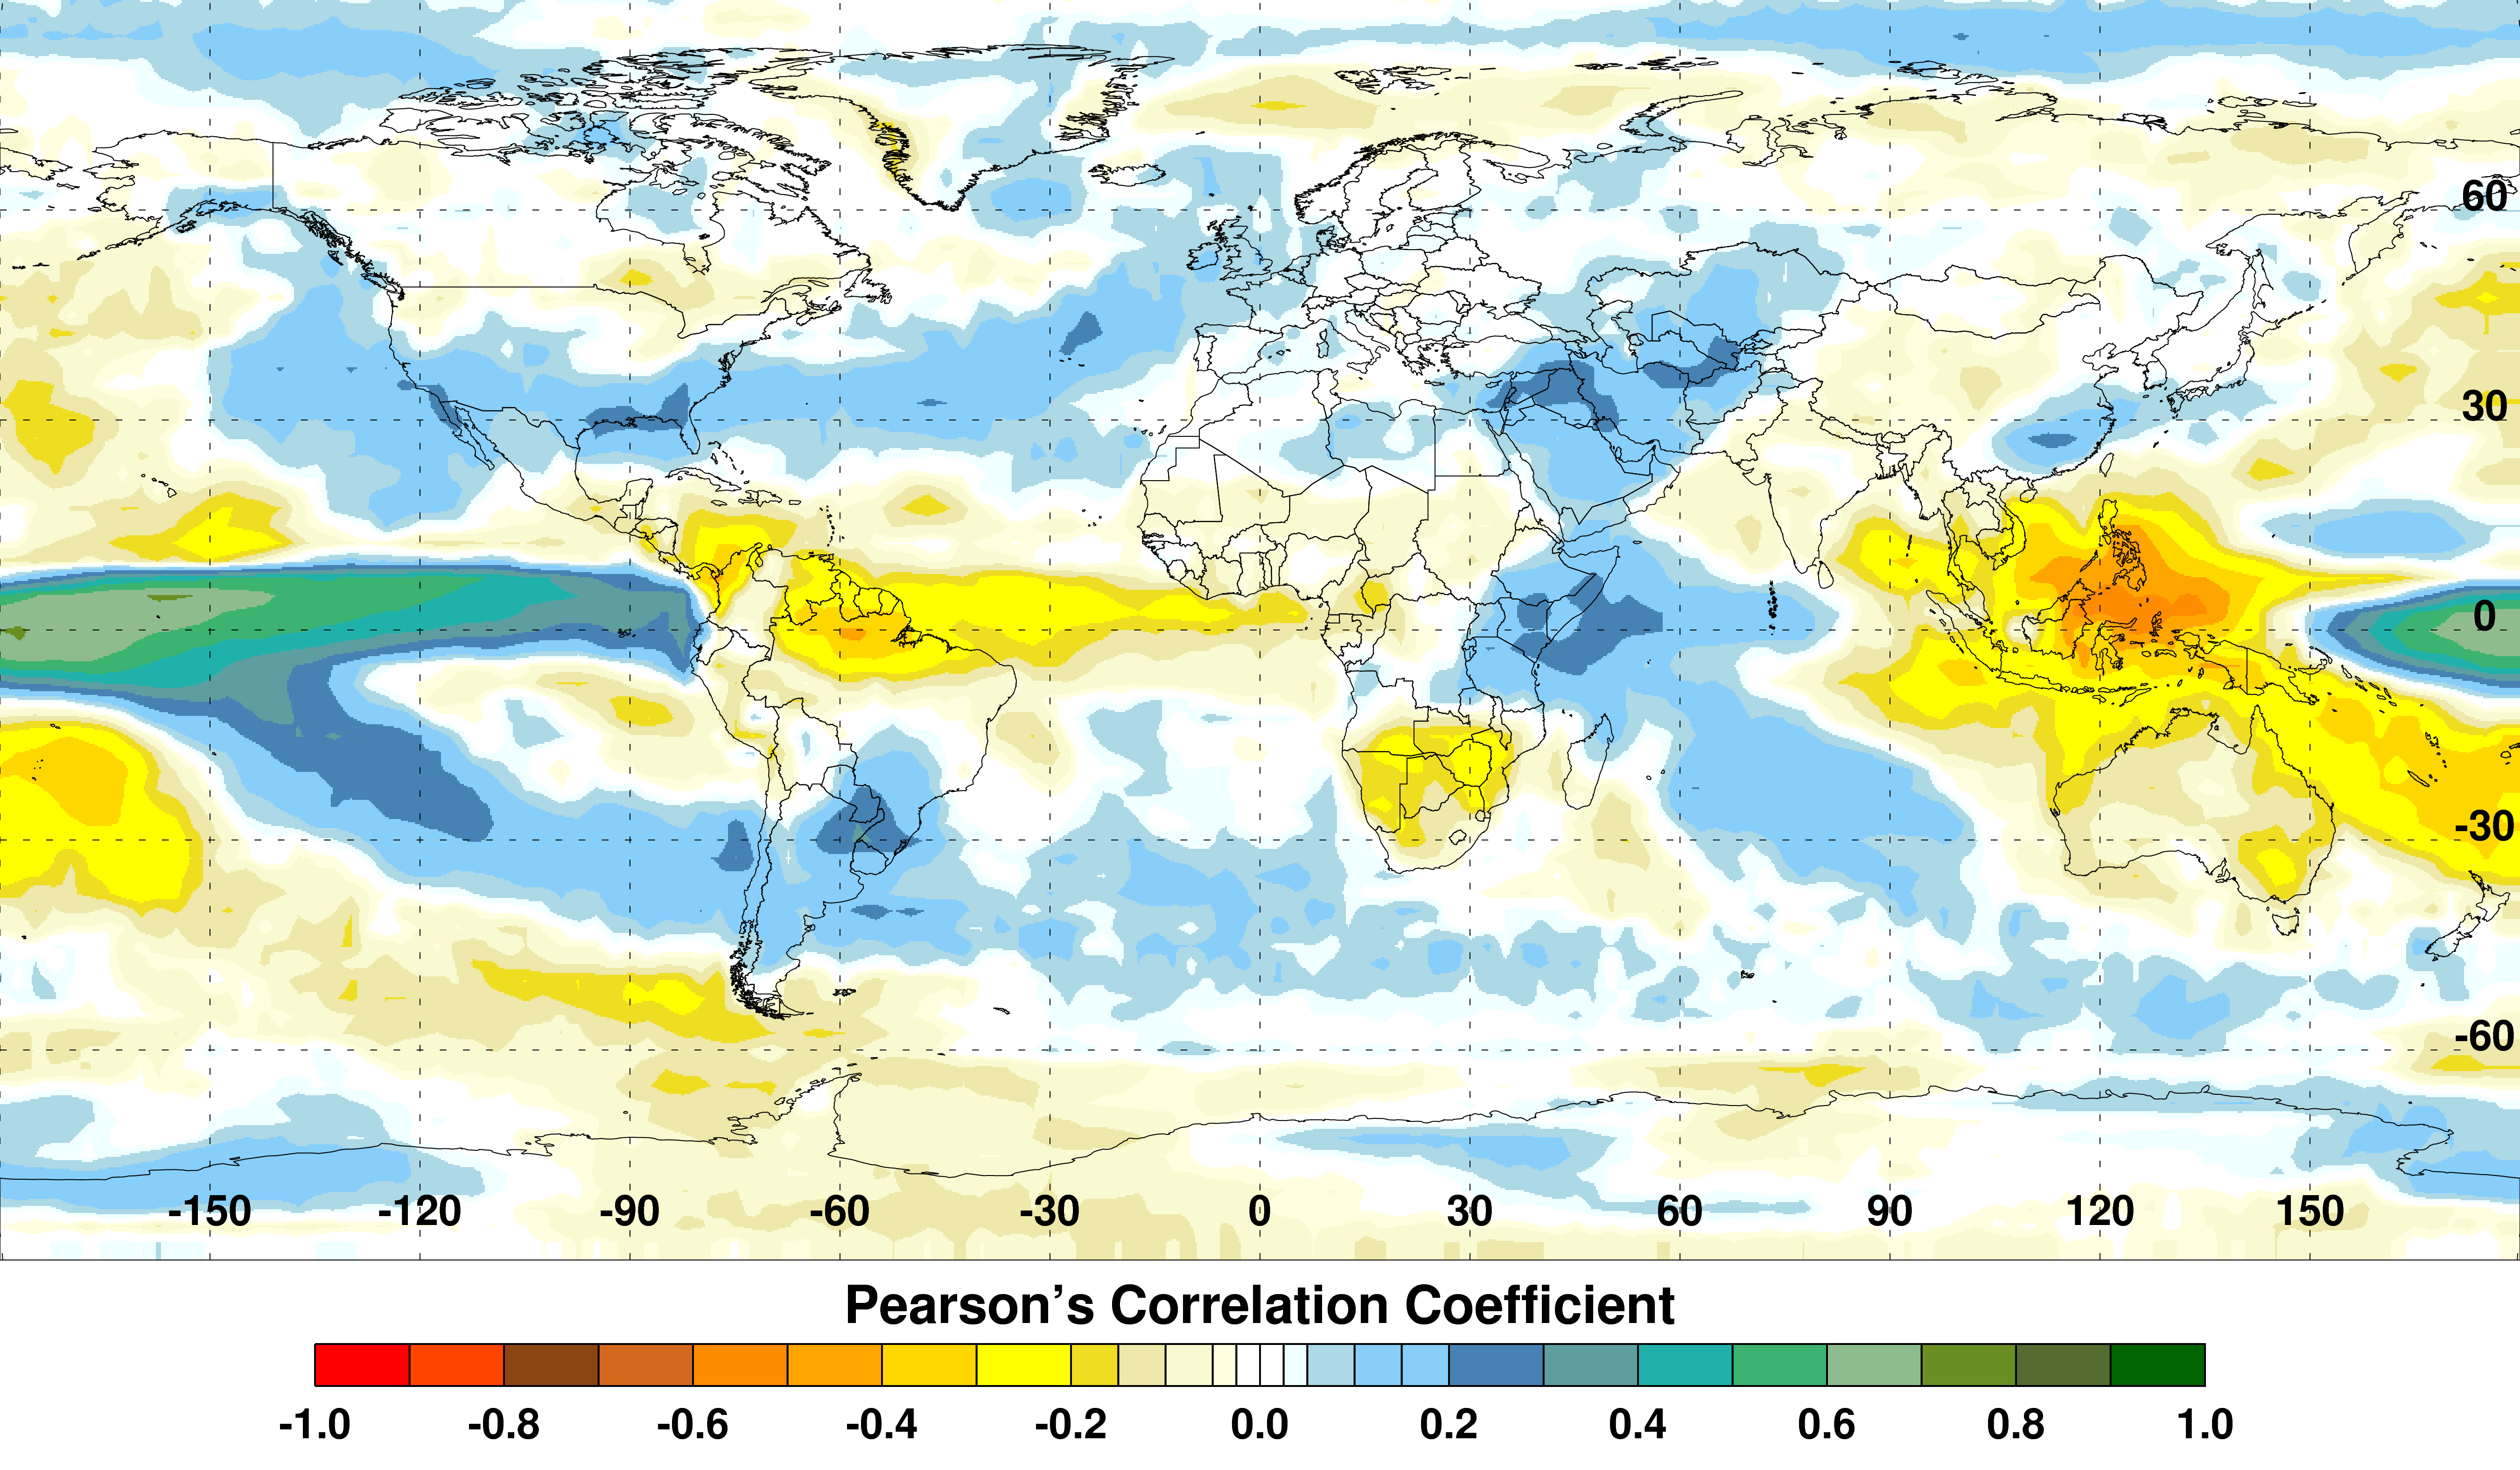
Fig. 3: Summary Correlation between Monthly NINO3.4 Sea Surface Temperature and Rainfall Anomalies, 1997-2008.
Currently, several regions show extreme departures in rainfall, including southeast Asia, northeast Africa, Mexico/Central America, and the southwestern United States (Figure 4).
Departures in average rainfall coincide with Outgoing Longwave Radiation anomalies (Fig. 2).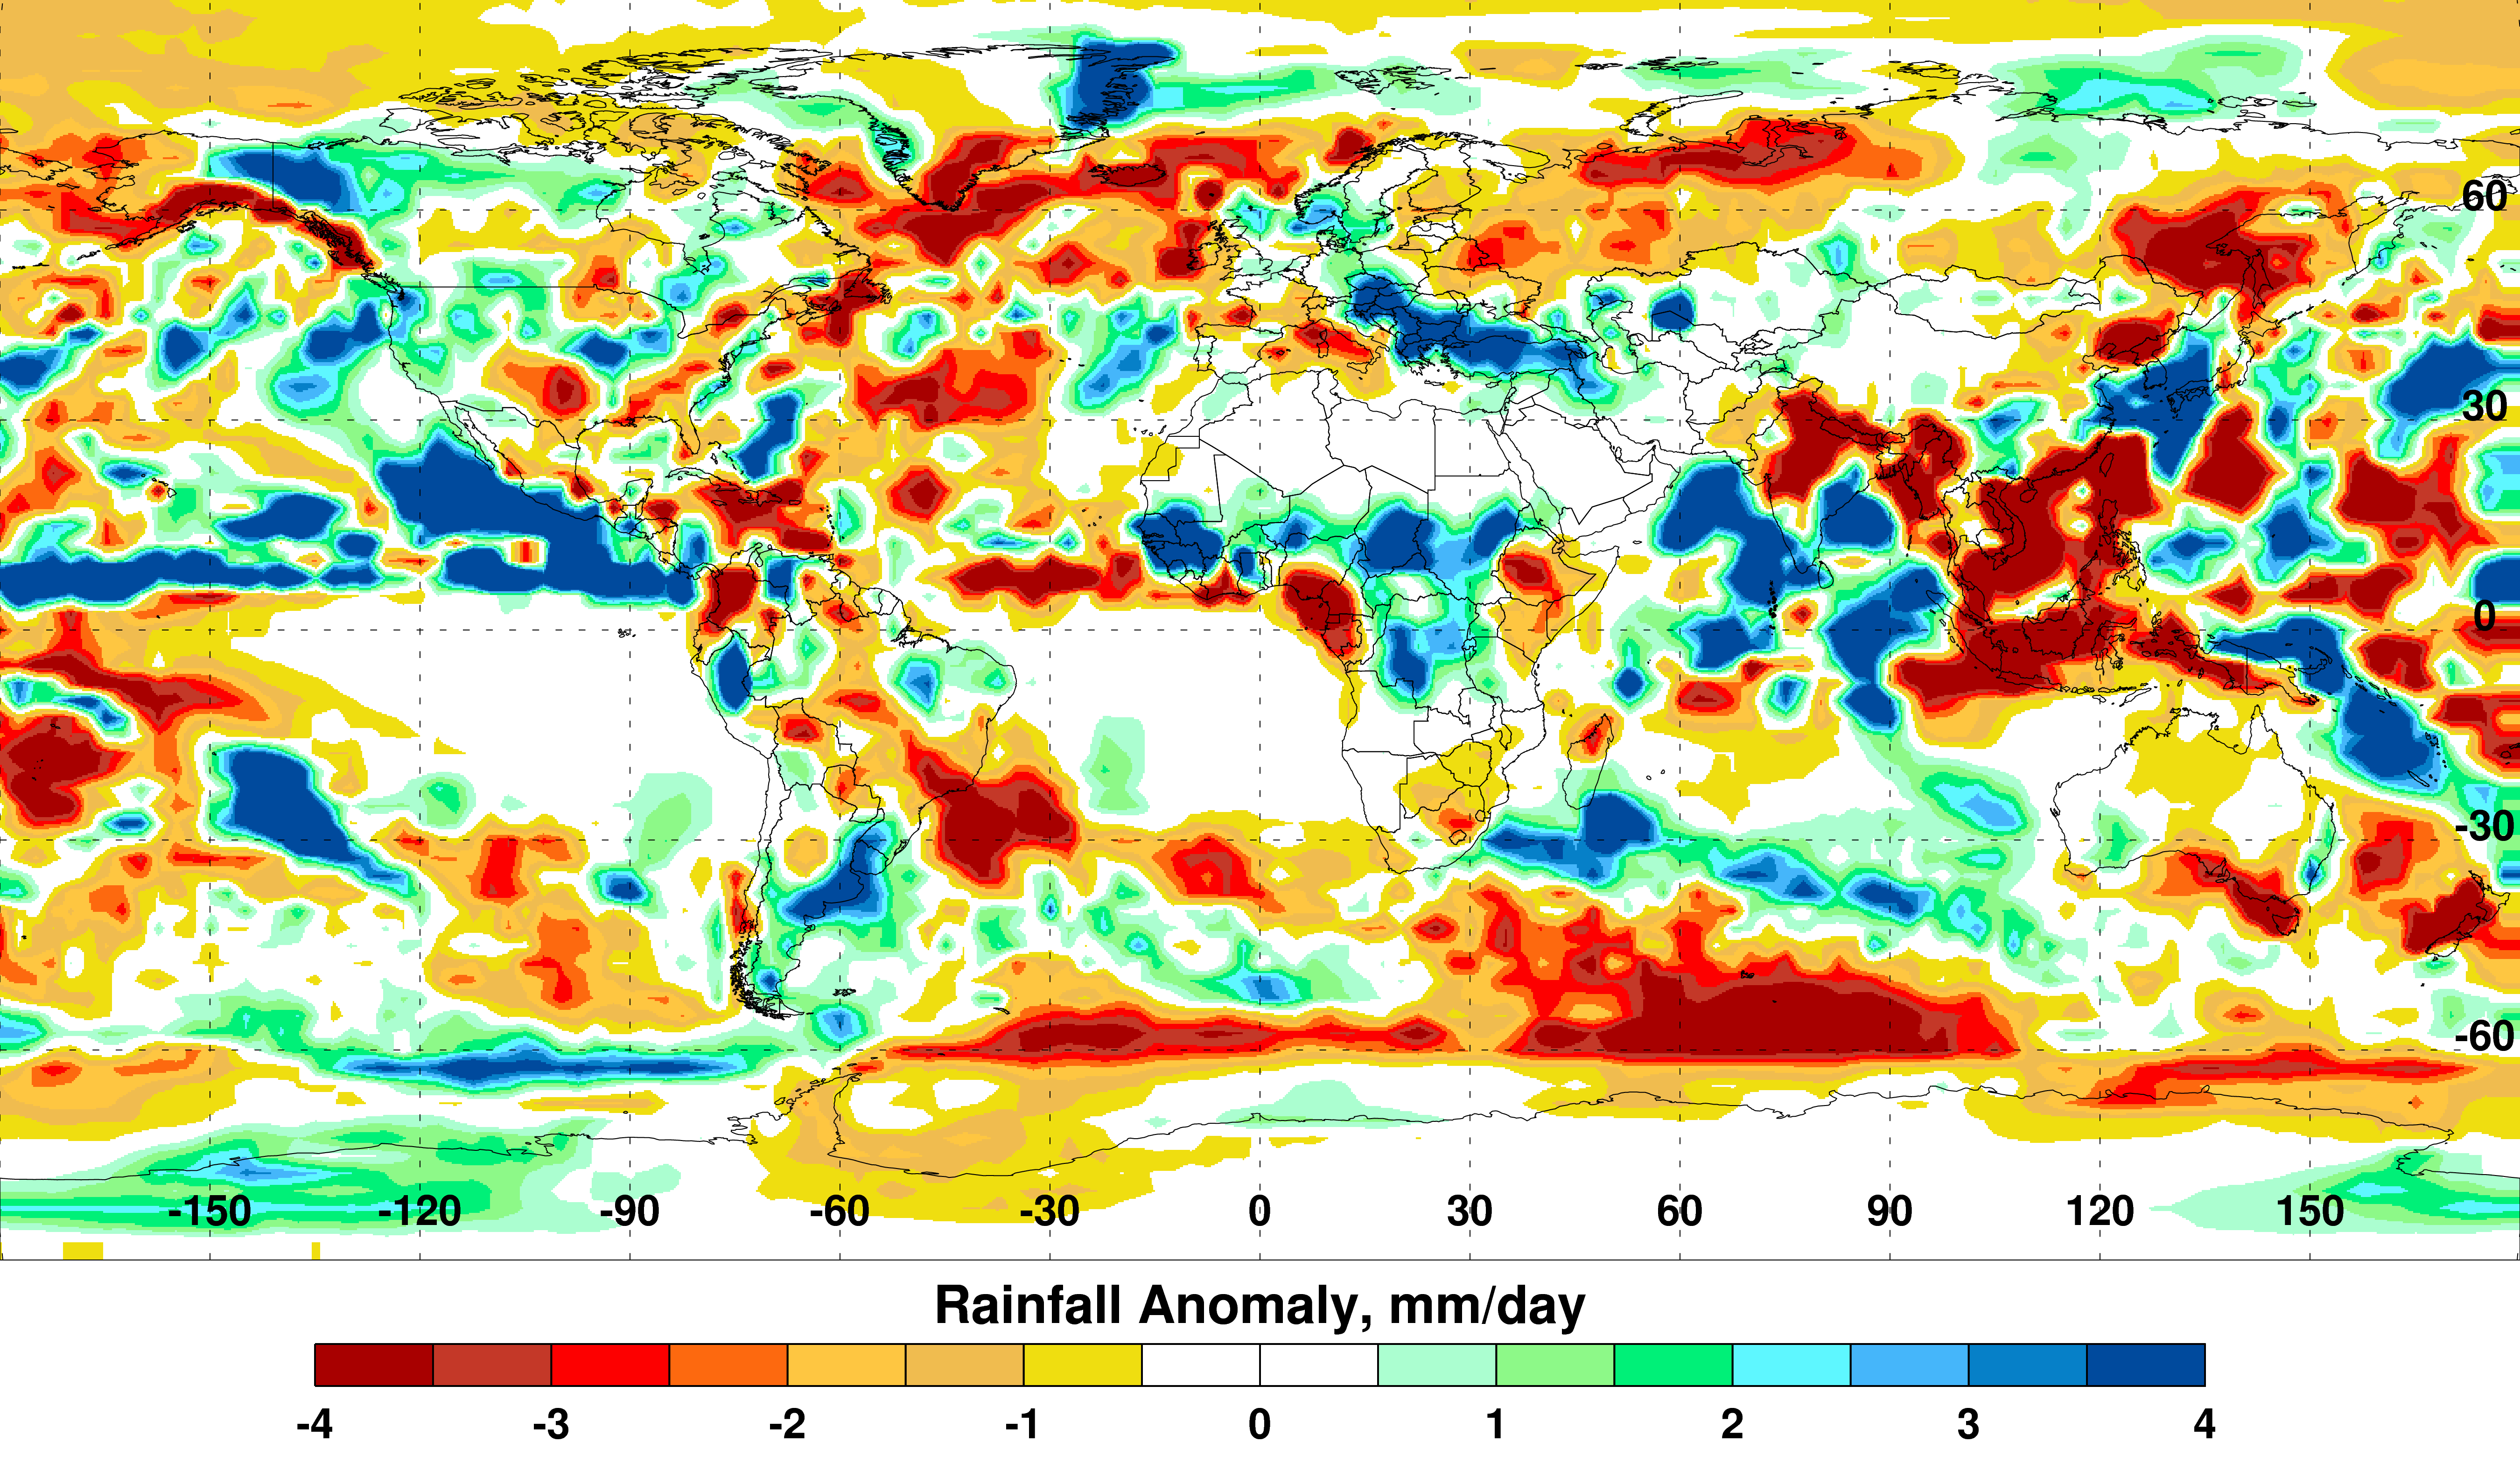
Fig. 4: Global Seasonal (August-October) Rainfall Anomalies.
Considering these typical El Niño effects on regional weather and the recent El Niño forecast, there is a high likelihood for drought conditions to prevail in southeast Asia, west-central and southern Africa, northeast Brazil, Ecuador, and Mexico during the next 5 to 8 months; as well as elevated rainfall and flooding in southwest Asia, eastern Africa, coastal Peru and Ecuador, much of the southern portion of South America, and the US southwest, including southern California.
The development of these conditions has important implications for global public health. For each of several diseases, including ones of high global health significance, multiple epidemiological studies have linked El Niño events with increased incidence in human populations (Table 2).
Disease
Region
Possible El Nino Effects on Disease Dynamics
Cholera
Africa11,12 : Great Lakes region; Asia1,18,19,20,21,22 : Bangladesh, India (coastal), Sri Lanka; South America45 : Peru
Warmer water temperatures promote bacteria proliferation; flooding causes contamination of water sources, and may increase susceptibility to infection via stress.
Dengue
Asia/Pacific1,13,14,15,16,17 : Indonesia, Thailand, Pacific Islands, Australia (Queensland); North America23,24,25 : Mexico, United States (southern); South America1,26 : Colombia, Ecuador (coastal), French Guiana, Suriname
Dry conditions: Peri-domestic water storage promotes Aedes aegypti mosquito vector breeding; elevated temperatures reduce the extrinsic incubation period in Ae. aegypti and Ae. albopictus vectors; warm, dry conditions may promote vegetation patterns favorable for vector development. Wet conditions: Elevated rainfall promotes Ae. aegypti and Ae. albopictus breeding.
Hantavirus infection
Asia27,28,29,30,31 : China (eastern; hemorrhagic fever with renal syndrome); North America32 : United States (southwestern; hantavirus pulmonary syndrome)
Elevated rainfall increases food availability for rodent reservoirs (vegetation), which expands rodent populations and may promote contact with humans.
Leishmaniasis
Central/South America1,33,34,35,36 : Brazil (eastern), Costa Rica, Colombia, French Guiana
Warmer temperatures or dry conditions may favor sand fly vectors or contribute to waning human immunity (e.g., via malnutrition or temporarily suppressing disease transmission).
Malaria
Asia1,37,38 : China (Anhui Province), India/Pakistan (Punjab), Sri Lanka; South America1,39,40,41 : Colombia, French Guiana, Guyana, Peru (coastal), Venezuela
Elevated rainfall promotes Anopheles mosquito vector breeding and survival, and vectorial capacity.
Plague
Africa43 : Madagascar; North America44 : United States (western)
Heavy rains increase food availability for populations of susceptible rodents; cooler temperatures may increase infectious flea abundance.
Rift Valley fever
Africa2,5 : East Africa
Flooding of dry mosquito vector habitats promotes hatching of (transovarially-) infected eggs, and vector breeding and survival.
Respiratory illness
Asia46,47 : Southeast Asia/Indonesia
Drought may contribute to forest fires, which cause air pollution that may increase risk of respiratory infection.
Ross River virus disease
Asia1,42 : Australia (Queensland/Murray-Darling River region)
Warm conditions may increase mosquito vector longevity, and thereby vectorial capacity.
El Niño may impact dynamics of other diseases related to ones with demonstrated El Niño associations. For example, chikungunya virus shares vectors with dengue virus (Aedes aegypti and Aedes albopictus mosquitoes) and often circulates in the same areas. Wet conditions linked to El Niño have been associated with increased dengue incidence on the Mexico-United States (Texas) border23 and could enhance chikungunya transmission in the region as well. Both countries have reported imported cases and local transmission since December 2013, when the first, and ongoing, chikungunya epidemic in the Americas began. Florida, the current US focus of local chikungunya and dengue transmission, and other US Gulf Coast states harbor winter populations of chikungunya and dengue virus mosquito vectors. They could experience increased or new transmission with prolonged wet conditions in late 2014 and early 2015. Conversely, warm, dry conditions may increase dengue and chikungunya transmission in other areas where both are endemic (Table 2).
Based on these findings and considerations, we recommend enhanced surveillance and preparedness for specific geographic regions that may be at risk for El Niño-linked infectious disease activity during late 2014 through spring 2015 (Figure 5).
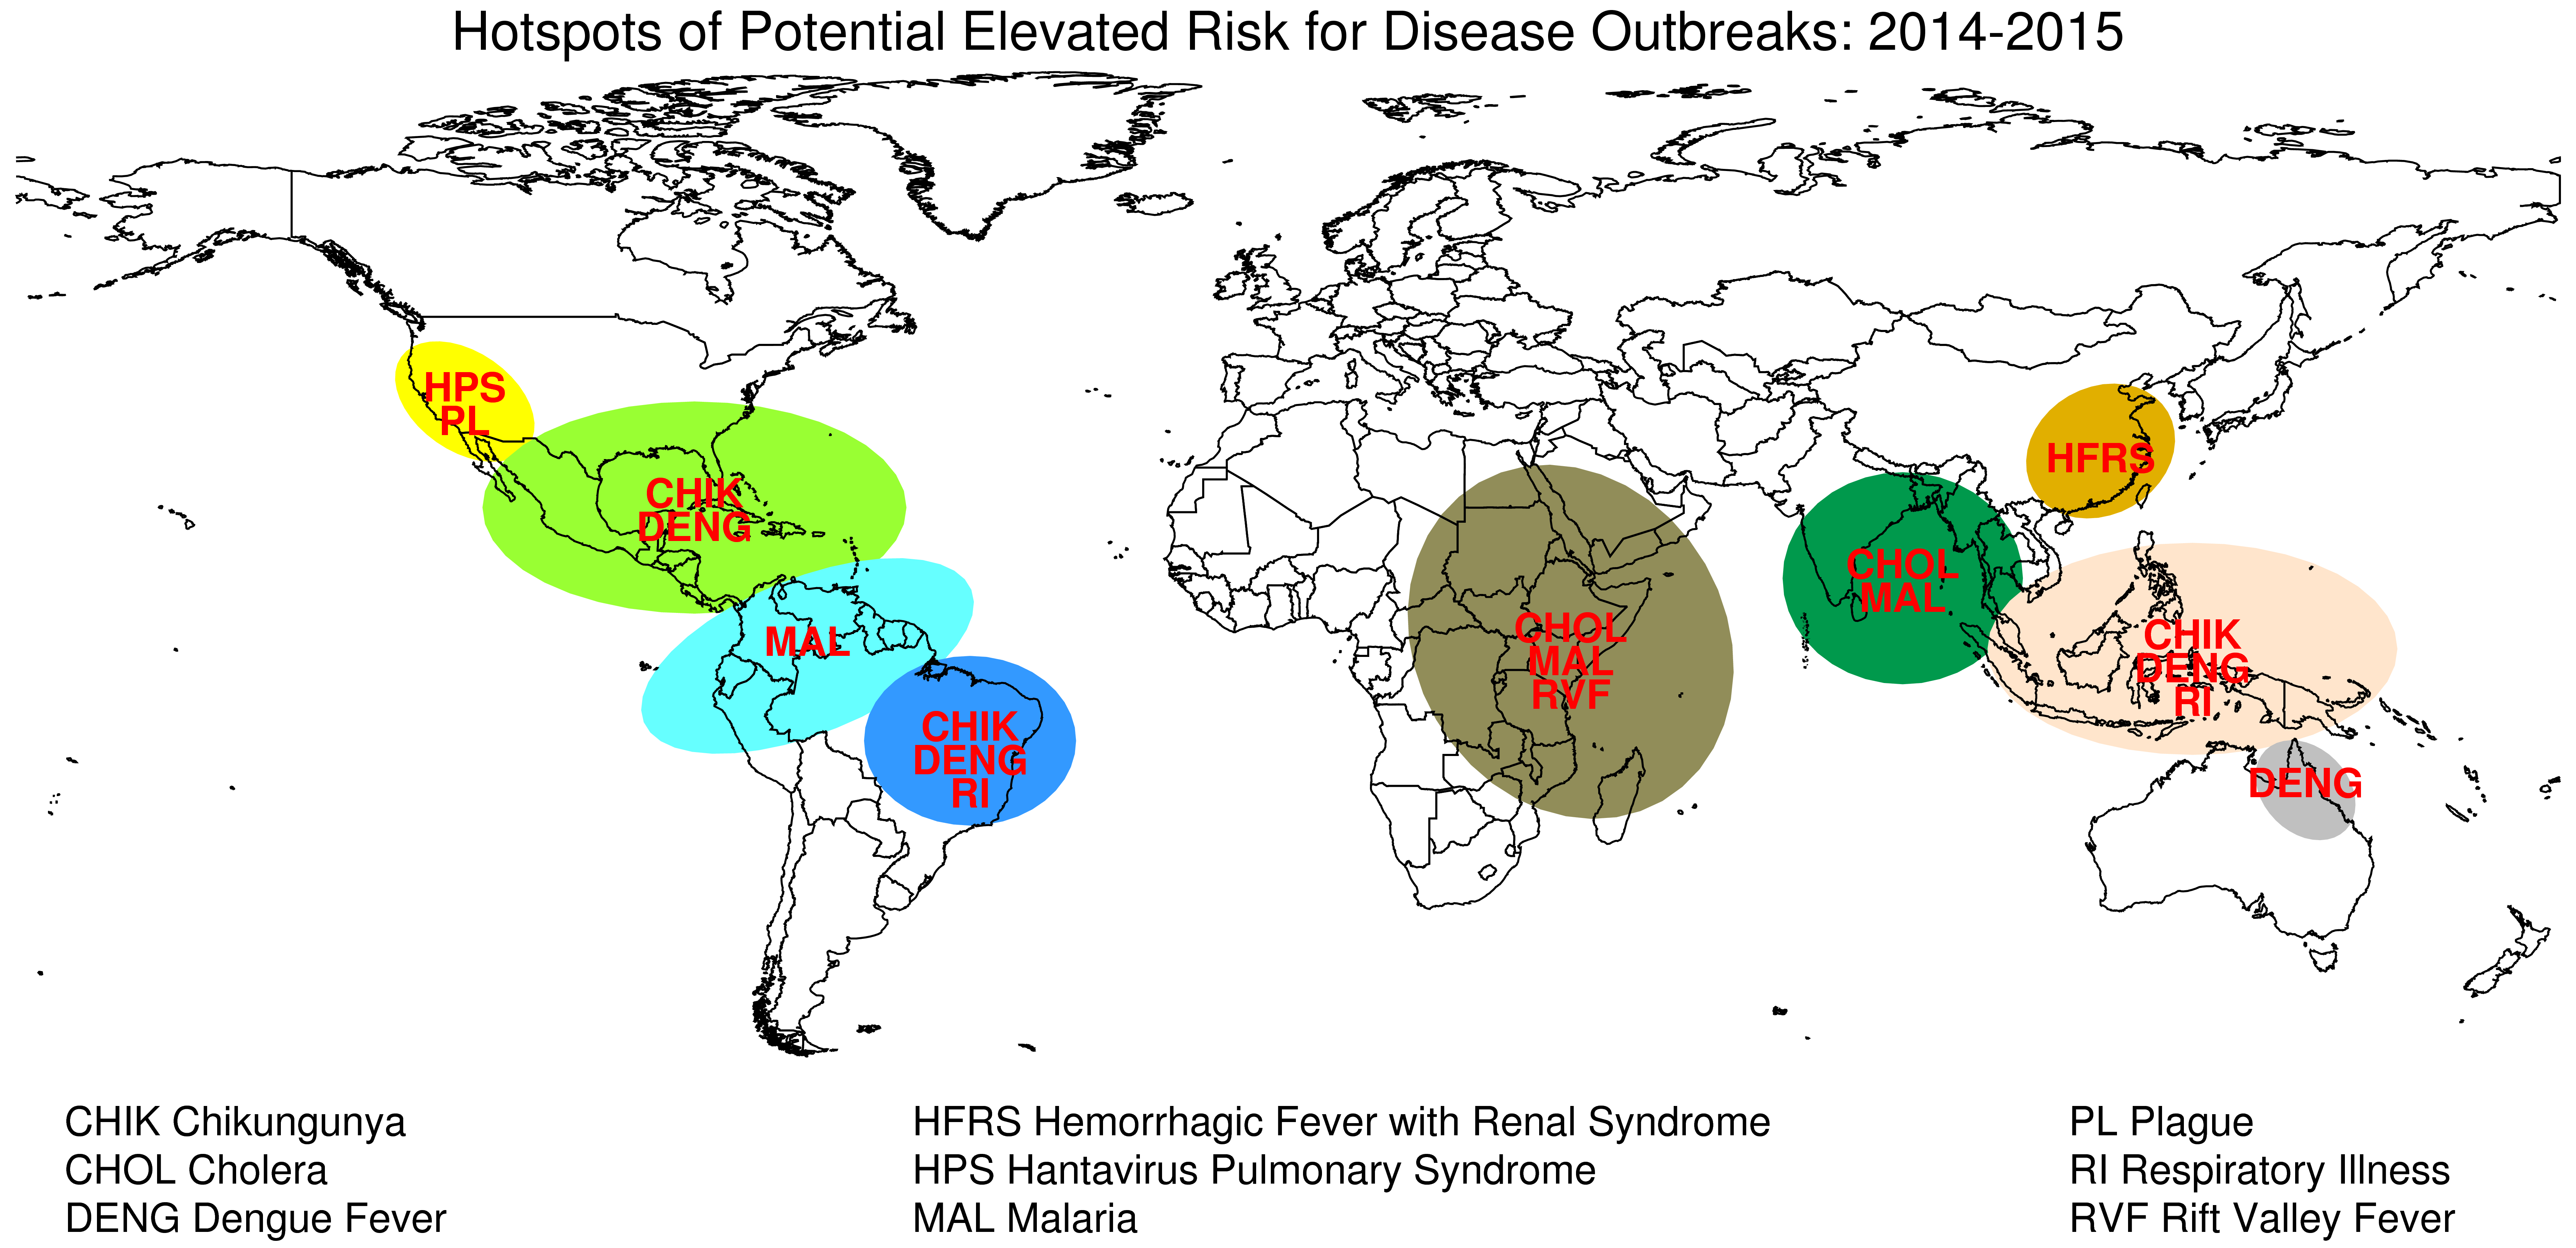
Fig. 5: Potential Infectious Disease Risks Associated with El Nino in 2014-2015.
Discussion and Conclusions
Based on current global climate anomaly conditions and forecasts, El Niño is likely to develop during late 2014 and persist into early 2015. The expected effects on regional weather patterns include persistent high temperatures and drought in some areas, and heavy rainfall and flooding in others. This may enhance populations of particular vectors and the transmission of various infectious diseases in human and animal populations.
Although local weather conditions mediate part of ENSO’s influence on infectious disease transmission (“teleconnections”), incorporating ENSO indicators into disease risk predictions offers advantages. ENSO forecasts typically can anticipate local weather effects several months before they manifest, providing lead-time for public health risk communication, enhancement of disease and vector surveillance programs, provisioning of clinical resources (for example, vaccines and diagnostics), and other preparedness measures. Also, a large-scale climate phenomenon such as ENSO may predict ecological processes better than weather-based models by integrating the effects of multiple weather variables that interact in complex ways53.
Our El Niño-based infectious disease risk assessment for coming months requires some caveats. The development of El Niño events cannot be predicted with complete certainty. However, we expect predictability to be higher for this near-term forecast (versus, for example, a 1-year-ahead forecast). Predictability even at longer lead-times has been favorable without a high false-alarm rate during 1857-200354. Additionally, in September 2013 a model distinct from NOAA’s predicted a 75% chance that El Niño would develop in late 201455.
A limitation to ENSO-based infectious disease predictions is the complex relationship between ENSO the and dynamics of certain diseases. The relationship has been strong and consistent for some diseases, such as RVF in East Africa5,7. However, nuanced analytical approaches applied to long epidemiological time series have identified inconsistent ENSO associations with incidence of cholera in Bangladesh22 and dengue in Thailand17; found no systematic relationship between ENSO and dengue incidence in Mexico, Puerto Rico, or Thailand56; and uncovered a previously undetected association with plague in the western United States44. Factors that could modify ENSO’s impacts include local or other large-scale climatological processes, as well as unrelated phenomena that influence disease dynamics, such as waning or persisting human immunity.
Our observations do not attempt to predict disease outbreaks or even elevated transmission risk, but instead highlight the occurrence of current and future ENSO conditions that might influence environmental conditions that influence the dynamics of certain diseases (Table 2, Figure 5). The linkages we describe between climate and disease transmission are based on many years of observations of teleconnections between specific persistent weather/climate anomalies and specific vector-borne and water-borne disease outbreaks in specific regions.
We encourage public health organizations to take steps to mitigate El Niño impacts, such as increased incidence of infectious disease, in areas likely to be affected. While some measures are specific to certain diseases, preparations should include risk communication to the public and relevant sectors; vector and public health surveillance to detect increased disease activity; and planning for surge capacity to respond to increased disease activity. In particular, we emphasize the need for public health monitoring as El Niño develops to improve understanding of regional health effects and facilitate development of early warning systems.
Competing Interests
The authors have declared that no competing interests exist.
Acknowledgements
We thank Drs. Rohit A. Chitale, Joel C. Gaydos, and Kevin L. Russell for supporting this effort. We also thank Dr. Robert Adler and Mathew Sapiano of the Cooperative Institute for Climate and Satellites (CICS), University of Maryland for providing the interim Global Precipitation Climatology Project (GPCP) rainfall data used in the manuscript. The views expressed are those of the authors and do not necessarily reflect those of any part of the US Government.References
- Kovats RS, Bouma MJ, Hajat S, Worrall E, Haines A. El Niño and health. Lancet 2003;362(9394):1481-1489. doi:10.1016/S0140-6736(03)14695-8.
- Anyamba A, Linthicum KJ, Small JL, et al. Climate teleconnections and recent patterns of human and animal disease outbreaks. PLoS Negl. Trop. Dis. 2012;6(1):e1465. doi:10.1371/journal.pntd.0001465.
- Anyamba A, Small JL, Britch SC, et al. Recent weather extremes and impacts on agricultural production and vector-borne disease outbreak patterns. PloS One 2014;9(3):e92538. doi:10.1371/journal.pone.0092538.
- National Oceanic and Atmospheric Administration. National Weather Service. Climate Prediction Center. El Nino/Southern Oscillation diagnostic discussion. January 8, 2015.
Reference Link - Linthicum KJ, Anyamba A, Tucker CJ, Kelley PW, Myers MF, Peters CJ. Climate and satellite indicators to forecast Rift Valley fever epidemics in Kenya. Science 1999;285(5426):397-400.
- Witt CJ, Richards AL, Masuoka PM, et al. The AFHSC-Division of GEIS Operations Predictive Surveillance Program: a multidisciplinary approach for the early detection and response to disease outbreaks. BMC Public Health 2011;11 Suppl 2:S10. doi:10.1186/1471-2458-11-S2-S10.
- Anyamba A, Chretien J-P, Small J, et al. Prediction of a Rift Valley fever outbreak. Proc. Natl. Acad. Sci. U. S. A. 2009;106(3):955-959. doi:10.1073/pnas.0806490106.
- Anyamba A, Linthicum KJ, Small J, et al. Prediction, assessment of the Rift Valley fever activity in East and Southern Africa 2006-2008 and possible vector control strategies. Am. J. Trop. Med. Hyg. 2010;83(2 Suppl):43-51. doi:10.4269/ajtmh.2010.09-0289.
- Anyamba A, Chretien J-P, Small J, Tucker CJ, Linthicum KJ. Developing global climate anomalies suggest potential disease risks for 2006-2007. Int. J. Health Geogr. 2006;5:60. doi:10.1186/1476-072X-5-60.
- United States Department of Agriculture. Agricultural Research Service. Rift Valley fever monitor.
Reference Link - Bompangue Nkoko D, Giraudoux P, Plisnier P-D, et al. Dynamics of cholera outbreaks in Great Lakes region of Africa, 1978-2008. Emerg. Infect. Dis. 2011;17(11):2026-2034. doi:10.3201/eid1711.110170.
- Olago D, Marshall M, Wandiga SO, et al. Climatic, socio-economic, and health factors affecting human vulnerability to cholera in the Lake Victoria basin, East Africa. Ambio 2007;36(4):350-358.
- Azad S, Lio P. Emerging trends of malaria-dengue geographical coupling in the Southeast Asia region. J. Vector Borne Dis. 2014;51(3):165-171.
- Earnest A, Tan SB, Wilder-Smith A. Meteorological factors and El Niño Southern Oscillation are independently associated with dengue infections. Epidemiol. Infect. 2012;140(7):1244-1251. doi:10.1017/S095026881100183X.
- Hu W, Clements A, Williams G, Tong S. Dengue fever and El Nino/Southern Oscillation in Queensland, Australia: a time series predictive model. Occup. Environ. Med. 2010;67(5):307-311. doi:10.1136/oem.2008.044966.
- Tipayamongkholgul M, Fang C-T, Klinchan S, Liu C-M, King C-C. Effects of the El Niño-southern oscillation on dengue epidemics in Thailand, 1996-2005. BMC Public Health 2009;9:422. doi:10.1186/1471-2458-9-422.
- Cazelles B, Chavez M, McMichael AJ, Hales S. Nonstationary influence of El Niño on the synchronous dengue epidemics in Thailand. PLoS Med. 2005;2(4):e106. doi:10.1371/journal.pmed.0020106.
- Cash BA, Rodó X, Emch M, Yunus M, Faruque ASG, Pascual M. Cholera and shigellosis: different epidemiology but similar responses to climate variability. PloS One 2014;9(9):e107223. doi:10.1371/journal.pone.0107223.
- Hashizume M, Chaves LF, Faruque ASG, Yunus M, Streatfield K, Moji K. A differential effect of Indian ocean dipole and El Niño on cholera dynamics in Bangladesh. PloS One 2013;8(3):e60001. doi:10.1371/journal.pone.0060001.
- Hashizume M, Faruque ASG, Terao T, et al. The Indian Ocean dipole and cholera incidence in Bangladesh: a time-series analysis. Environ. Health Perspect. 2011;119(2):239-244. doi:10.1289/ehp.1002302.
- Ohtomo K, Kobayashi N, Sumi A, Ohtomo N. Relationship of cholera incidence to El Niño and solar activity elucidated by time-series analysis. Epidemiol. Infect. 2010;138(1):99-107. doi:10.1017/S0950268809990203.
- Rodo X, Pascual M, Fuchs G, Faruque ASG. ENSO and cholera: a nonstationary link related to climate change? Proc. Natl. Acad. Sci. U. S. A. 2002;99(20):12901-12906. doi:10.1073/pnas.182203999.
- Brunkard JM, Cifuentes E, Rothenberg SJ. Assessing the roles of temperature, precipitation, and ENSO in dengue re-emergence on the Texas-Mexico border region. Salud Pública México 2008;50(3):227-234.
- Hurtado-Díaz M, Riojas-Rodríguez H, Rothenberg SJ, Gomez-Dantés H, Cifuentes E. Short communication: impact of climate variability on the incidence of dengue in Mexico. Trop. Med. Int. Health 2007;12(11):1327-1337. doi:10.1111/j.1365-3156.2007.01930.x.
- Colón-González FJ, Lake IR, Bentham G. Climate variability and dengue fever in warm and humid Mexico. Am. J. Trop. Med. Hyg. 2011;84(5):757-763. doi:10.4269/ajtmh.2011.10-0609.
- Stewart-Ibarra AM, Lowe R. Climate and non-climate drivers of dengue epidemics in southern coastal ecuador. Am. J. Trop. Med. Hyg. 2013;88(5):971-981. doi:10.4269/ajtmh.12-0478.
- Xiao H, Tian H-Y, Cazelles B, et al. Atmospheric moisture variability and transmission of hemorrhagic fever with renal syndrome in Changsha City, Mainland China, 1991-2010. PLoS Negl. Trop. Dis. 2013;7(6):e2260. doi:10.1371/journal.pntd.0002260.
- Xiao H, Gao LD, Li XJ, et al. Environmental variability and the transmission of haemorrhagic fever with renal syndrome in Changsha, People’s Republic of China. Epidemiol. Infect. 2013;141(9):1867-1875. doi:10.1017/S0950268812002555.
- Zhang W-Y, Guo W-D, Fang L-Q, et al. Climate variability and hemorrhagic fever with renal syndrome transmission in Northeastern China. Environ. Health Perspect. 2010;118(7):915-920. doi:10.1289/ehp.0901504.
- Bi P, Parton KA, Tong S. El Nino-Southern Oscillation and vector-borne diseases in Anhui, China. Vector Borne Zoonotic Dis. Larchmt. N 2005;5(2):95-100. doi:10.1089/vbz.2005.5.95.
- Bi P, Parton KA. El Niño and incidence of hemorrhagic fever with renal syndrome in China. JAMA 2003;289(2):176-177.
- Hjelle B, Glass GE. Outbreak of hantavirus infection in the Four Corners region of the United States in the wake of the 1997-1998 El Nino-southern oscillation. J. Infect. Dis. 2000;181(5):1569-1573. doi:10.1086/315467.
- Roger A, Nacher M, Hanf M, et al. Climate and leishmaniasis in French Guiana. Am. J. Trop. Med. Hyg. 2013;89(3):564-569. doi:10.4269/ajtmh.12-0771.
- Cardenas R, Sandoval CM, Rodriguez-Morales AJ, Vivas P. Zoonoses and climate variability. Ann. N. Y. Acad. Sci. 2008;1149:326-330. doi:10.1196/annals.1428.094.
- Cardenas R, Sandoval CM, Rodríguez-Morales AJ, Franco-Paredes C. Impact of climate variability in the occurrence of leishmaniasis in northeastern Colombia. Am. J. Trop. Med. Hyg. 2006;75(2):273-277.
- Chaves LF, Pascual M. Climate cycles and forecasts of cutaneous leishmaniasis, a nonstationary vector-borne disease. PLoS Med. 2006;3(8):e295. doi:10.1371/journal.pmed.0030295.
- Gao H-W, Wang L-P, Liang S, et al. Change in rainfall drives malaria re-emergence in Anhui Province, China. PloS One 2012;7(8):e43686. doi:10.1371/journal.pone.0043686.
- Zubair L, Galappaththy GN, Yang H, et al. Epochal changes in the association between malaria epidemics and El Niño in Sri Lanka. Malar. J. 2008;7:140. doi:10.1186/1475-2875-7-140.
- Delgado-Petrocelli L, Córdova K, Camardiel A, Aguilar VH, Hernández D, Ramos S. Analysis of the El Niño/La Niña-Southern Oscillation variability and malaria in the Estado Sucre, Venezuela. Geospatial Health 2012;6(3):S51-57.
- Hanf M, Adenis A, Nacher M, Carme B. The role of El Niño Southern Oscillation (ENSO) on variations of monthly Plasmodium falciparum malaria cases at the Cayenne General Hospital, 1996-2009, French Guiana. Malar. J. 2011;10:100. doi:10.1186/1475-2875-10-100.
- Mantilla G, Oliveros H, Barnston AG. The role of ENSO in understanding changes in Colombia’s annual malaria burden by region, 1960-2006. Malar. J. 2009;8:6. doi:10.1186/1475-2875-8-6.
- Kelly-Hope LA, Purdie DM, Kay BH. El Niño Southern Oscillation and Ross River virus outbreaks in Australia. Vector Borne Zoonotic Dis. Larchmt. N 2004;4(3):210-213.
- Kreppel KS, Caminade C, Telfer S, et al. A Non-Stationary Relationship between Global Climate Phenomena and Human Plague Incidence in Madagascar. PLoS Negl. Trop. Dis. 2014;8(10):e3155. doi:10.1371/journal.pntd.0003155.
- Ari TB, Gershunov A, Tristan R, Cazelles B, Gage K, Stenseth NC. Interannual variability of human plague occurrence in the Western United States explained by tropical and North Pacific Ocean climate variability. Am. J. Trop. Med. Hyg. 2010;83(3):624-632. doi:10.4269/ajtmh.2010.09-0775.
- Gil AI, Louis VR, Rivera ING, et al. Occurrence and distribution of Vibrio cholerae in the coastal environment of Peru. Environ. Microbiol. 2004;6(7):699-706. doi:10.1111/j.1462-2920.2004.00601.x.
- Field RD, van der Werf GR, Shen SSP. Human amplification of drought-induced biomass burning in Indonesia since 1960. Nat. Geosci. 2009;2(3):185-188. doi:10.1038/ngeo443.
- Siegert F, Ruecker G, Hinrichs A, Hoffmann AA. Increased damage from fires in logged forests during droughts caused by El Niño. Nature 2001;414(6862):437-440. doi:10.1038/35106547.
- Hu W, McMichael AJ, Tong S. El Niño Southern Oscillation and the transmission of hepatitis A virus in Australia. Med. J. Aust. 2004;180(9):487-488.
- Zhang Y, Bi P, Wang G, Hiller JE. El Niño Southern Oscillation (ENSO) and dysentery in Shandong province, China. Environ. Res. 2007;103(1):117-120. doi:10.1016/j.envres.2006.03.005.
- Chinga-Alayo E, Huarcaya E, Nasarre C, del Aguila R, Llanos-Cuentas A. The influence of climate on the epidemiology of bartonellosis in Ancash, Peru. Trans. R. Soc. Trop. Med. Hyg. 2004;98(2):116-124.
- Gutierrez EL, Galarza C, Ramos W, Mendoza M, Smith ME, Ortega-Loayza AG. Influence of climatic factors on the medical attentions of dermatologic diseases in a hospital of Lima, Peru. An. Bras. Dermatol. 2010;85(4):461-468.
- Martinez-Urtaza J, Huapaya B, Gavilan RG, et al. Emergence of Asiatic Vibrio diseases in South America in phase with El Niño. Epidemiol. Camb. Mass 2008;19(6):829-837. doi:10.1097/EDE.0b013e3181883d43.
- Hallett TB, Coulson T, Pilkington JG, Clutton-Brock TH, Pemberton JM, Grenfell BT. Why large-scale climate indices seem to predict ecological processes better than local weather. Nature 2004;430(6995):71-75. doi:10.1038/nature02708.
- Chen D, Cane MA, Kaplan A, Zebiak SE, Huang D. Predictability of El Niño over the past 148 years. Nature 2004;428(6984):733-736. doi:10.1038/nature02439.
- Ludescher J, Gozolchiani A, Bogachev MI, Bunde A, Havlin S, Schellnhuber HJ. Very early warning of next El Niño. Proc. Natl. Acad. Sci. U. S. A. 2014;111(6):2064-2066. doi:10.1073/pnas.1323058111.
- Johansson MA, Cummings DAT, Glass GE. Multiyear climate variability and dengue--El Niño southern oscillation, weather, and dengue incidence in Puerto Rico, Mexico, and Thailand: a longitudinal data analysis. PLoS Med. 2009;6(11):e1000168. doi:10.1371/journal.pmed.1000168.
Leave a Comment
You must be logged in to post a comment.