Abstract
The key challenge during food-borne disease outbreaks, e.g. the 2011 EHEC/HUS outbreak in Germany, is the design of efficient mitigation strategies based on a timely identification of the outbreak’s spatial origin. Standard public health procedures typically use case-control studies and tracings along food shipping chains. These methods are time-consuming and suffer from biased data collected slowly in patient interviews. Here we apply a recently developed, network-theoretical method to identify the spatial origin of food-borne disease outbreaks. Thereby, the network captures the transportation routes of contaminated foods. The technique only requires spatial information on case reports regularly collected by public health institutions and a model for the underlying food distribution network. The approach is based on the idea of replacing the conventional geographic distance with an effective distance that is derived from the topological structure of the underlying food distribution network. We show that this approach can efficiently identify most probable epicenters of food-borne disease outbreaks. We assess and discuss the method in the context of the 2011 EHEC epidemic. Based on plausible assumptions on the structure of the national food distribution network, the approach can correctly localize the origin of the 2011 German EHEC/HUS outbreak.
Funding Statement
This work was supported by the Deutsche Forschungsgemeinschaft (DFG) research training group ‘Scaling Problems in Statistics’ (RTG 1644, www.uni-goettingen.de/en/156579.html) and the Volkswagen Foundation and inspired by FutureICT (www.futurict.eu). The funders had no role in study design, data collection and analysis, decision to publish, or preparation of the manuscript. The authors have declared that no competing interests exist.Introduction
Due to intensified mass production, facilitated world-wide shipping and novel food manufacturing methods, food-borne disease outbreaks occur more frequently with increasing impacts on society, public health institutions, the economy, and food industry1. An estimated 60% of annual gastrointestinal illnesses for each adult in the general population of the United States is caused by food-borne diseases2. Moreover, diarrhoea is the second leading cause of morbidity and mortality among children under five years worldwide3. food-borne diseases impose enormous financial burden on health care services, routine surveillance and public health investigations, and trigger substantial productivity impacts and product recalls by the food industry. For seven food-borne pathogens an annual burden of $6.5-$34.5 billion in the United States alone was estimated4.
One of the most substantial challenges in this context is determining the spatial origin of the contaminated food vehicle, which causes the epidemic, for earlier and more effective disease containment. Several factors make detection of the food-borne disease outbreak origin challenging, e.g. population growth, changing eating habits, globalization of food supply chains, production and processing innovations, and microbiological adaptation1,5. Furthermore, public health institutes have limited resources to solve issues such as underreporting and low specificity in the association between aetiology and food vehicle6. Origin reconstruction is a complex problem because the effects of contaminated food typically occur with a significant time lag and incidence patterns are geographically incoherent. Additionally, specific transport pathways are generally not monitored. More importantly, food distribution networks are multi-scale, spanning length-scale of hundreds to thousands of kilometers, delivering to and within spatially heterogeneous populations. Consequently, it is generically impossible to estimate the geographic origin of the phenomenon based on geometric aspects of the spatial distribution of reported cases. Only for 66% of the outbreaks, public health investigations identified evidence concerning the infection source7.
These practical difficulties were particularly striking during the German 2011 EHEC (enterohemorrhagic Escherichia coli) outbreak, which affected 3,842 people with unusually high rates of severe HUS (hemolytic-uremic syndrome) cases and mortality. The EHEC/HUS outbreak raised the awareness of timely and efficient origin reconstruction methods and their importance to society, public health institutions, risk assessment authorities and the food industry 2. There is no general procedure for food-borne disease outbreak investigations, that fits a particular event perfectly. However, the World Health Organization (WHO)8 provides practical standard guidelines for the investigation and control of food-borne disease outbreaks as a multi-disciplinary task which requires information from many sources.First, an unusual accumulation of disease reports has to be detected and defined as an outbreak. After pathogen specification, initial cases are investigated with regard to common factors and clinical and food specimens are sampled. The corresponding microbiological ‘fingerprinting’ of strains may also identify case relatedness and/or potential sources of contamination.From associated food and environmental samples, backward tracings are initiated to determine the origin. Furthermore, a case definition can be established to identify outbreak related cases and to collect their information on a standardized questionnaire.Using this data, analytical investigations, such as case-control and cohort studies, are performed to test hypotheses about the transmission vehicle and origin. The outbreak source is determined by combining all collected information, otherwise further analytical studies are required.Finally, the potential origin and transmission routes are controlled using forward tracings from contamination to the outbreak cases. Several attempts to improve traceability of food products to their geographical origin have been developed including technical innovations9, microbiological advances10, or food forensics11. However, detection of outbreak origin remains time-consuming and cost-intensive.
Network theory and network models have become the most important tools for understanding and predicting epidemics in general12,13,14. The majority of studies focuses on spatial disease dynamic systems in which networks quantify the coupling strength or transportation fluxes between spatially distributed populations. Almost all studies aim at understanding and forecasting the future time course of an epidemic based on the topological connectivity of the underlying transport networks15,16. Furthermore, most studies focus on human-to-human transmissible diseases. Little work has been done, however, on the inverse problem, also known as the ‘zero patient’ problem in epidemics. Shah and Zaman 17,18 developed a universal source detection maximum likelihood estimate, which assumes virus spread in a general graph along a breadth-first-search tree and derive theoretical thresholds for the detection probability. Pinto at al. 19 extended this estimate for partially observed transmission trees. Alternative origin reconstruction methods are based on shortest paths or consequent diameter from transmission trees 20,21. Prakash et al. 22 and Fioriti and Chinnici 23 developed methods based on spectral techniques to identify a (set of) origin nodes on a transmission network. They utilize a close relationship of source estimation and node centrality as shown by Comin and da Fontoura Costa 24. However, these methods require comprehensive knowledge of the transmission network, which is rarely the case.
Here we apply a recently developed network-geometric approach for epicenter reconstruction25 to food-borne diseases. This approach is based on a plausible redefinition of spatial separation and the introduction of an effective distance derived from the underlying food distribution network in combination with viewing the contagion process from the perspective of a specific node in the network. Using the effective distance method, complex spreading patterns can be mapped onto simple, regular wave propagation patterns if and only if the actual outbreak origin is chosen as the reference node. This way, the method can determine the correct outbreak origin based on the degree of regularity of the measured prevalence distribution when viewed in the effective distance perspective. This reconstruction is successful without the knowledge of the detailed infection hierarchy. Here, the underlying network captures the underlying transportation of the contaminated food rather than the mobility pattern of humans.
German EHEC O104:H4/HUS outbreak 2011
Regarding the number of severe HUS cases, the 2011 EHEC/HUS outbreak in Germany, has been the largest E. coli outbreak reported worldwide. Between May 2 and July 26, 2011, 3,842 outbreak associated EHEC cases were reported to the Robert Koch-Institute (RKI), the German Federal Public Health and Surveillance Institute. This included 855 severe HUS cases (22.3%) and 53 patients (1.4%) died. The outbreak was caused by a rare serotype O104:H4 which infected predominantly adults (median age, 43 years), particularly women (68%), and resulted in high HUS and mortality rates 26. In the previous years, between 925 and 1,283 cases were reported annually, mostly in children. The majority of the infection cases was observed in Northern Germany, which resulted in a higher incidence (number of cases per 100,000 inhabitants) for the corresponding districts than the overall one for Germany (see Fig. 1). Extensive investigations were conducted by the Task Force EHEC, which included a matched case-control study, a recipe-based restaurant cohort study, and backward-/forward-tracings 27. The entire process was complicated, resource demanding and time-consuming. All investigations required a large amount of data that are typically biased, incomplete, erroneous, and sometimes contradictory. The tracings require a large amount of trained personnel and their success depends on the results of epidemiological studies.Only the combination of several study designs finally lead to the determination of sprouts as the transmission vehicle and the identification of their origin, a farm in Bienenbüttel located in the district Uelzen, Lower Saxony. On June 10, 38 days after outbreak onset, the public was informed to avoid sprout consumption and the responsible production farm was closed.
(A) Each panel depicts a different outbreak week (May 30th until June 20th, 2011). Color intensity quantifies infection counts in for each of the German districts (Data source: 28, Map source: 29). The alleged origin of outbreak (district Uelzen) is marked in blue. (B) Time course of E. coli incidence for selected districts. For reference, the overall German incidence per district is shown in black.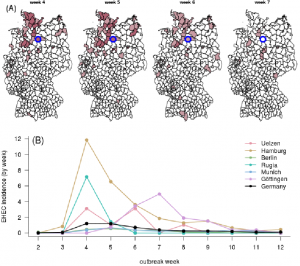
Fig. 1: E. coli incidence in Germany during 2011 EHEC/HUS outbreak.
The severe impact of the disease on the population and industry, the fast and wide spread due to mass production and optimized food shipping, and the large public attention emphasize the need for fast and efficient outbreak origin localization.
Network-theoretic origin detection
We consider a model network for spatial food distribution, where nodes (1) represent administrative districts in Germany. Links
quantify the amount of goods that are shipped from node
to
per unit time. Note that in the following, we let
. For what follows, only relative flux fractions
can be interpreted as an effective coupling between districts
and
that is induced by the food distribution between these districts. We consider the quantities
as a proxy from which spreading propensities between
and
can be derived.
Because precise measurements of food distribution pathways are not available, we consider an established, approximate heuristic from the social sciences, economics and transportation theory known as the gravity model 30,31. This approach accounts for the observation that traffic flow increases monotonically with the population size between locations and decreases algebraically with distance, leading to the relationship
(2) (3) (4),
, and
quantify the population size of origin
, destination
, and their geographic distance, respectively. The non-negative exponents
and distance scale
are parameters of the gravity model 32,33. Plausible choices for these parameters can be found in the following way: First, we assume that the coupling strength between two locations
and
increase with the number of connections (
) that can be formed between elements of the populations. This implies that
. Additionally, the coupling strength should be proportional to a mean value of the origin and destination population sizes, while leverage by large population nodes should be attenuated. Accounting for this, we choose the geometric average
decrease with distance. The corresponding tail exponent is consistent with the quantitative assessments of human mobility and transportation networks 34,35, i.e.
(in km) in Eq. (2) to be of the order of the average linear extent of a district. With these assumptions, the parameters in the gravity model are
and
km. Although we choose these parameter values as base values, we also investigate the robustness of our results against variations in exponents and found that our results are quite robust.
The gravity model generates a fully connected network with strongly heterogeneous weights, contrasting realistic mobility or transportation networks that possess a sparse topology. In order to obtain a more realistic model for food distribution that exhibits topological sparseness of connections, we follow a procedure recently introduced by Serrano et al. 36. The idea of this approach is that only links are retained that are statistically significant with respect to a random null model, in which traffic is distributed uniformly among links of a node. Following this idea, we first compute the flux fraction
(5) (6). If at each node, traffic was randomly distributed among the remaining
other nodes, a null model would produce
. Thus, we only retain links that possess a flux fraction larger than
, i.e. if
(A) A map of German districts; hues correspond to the regional network modules obtained by modularity maximization 37; color intensity quantifies population density. The origin of the 2011 EHEC/HUS outbreak is marked by a white circle in Bienenbüttel located in the district Uelzen. (B) German food shipping network constructed from a gravity model with parameters 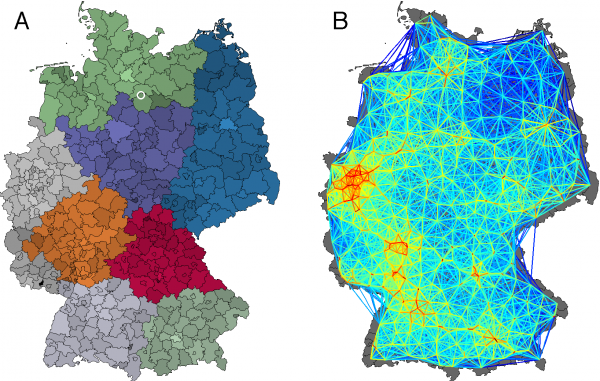
Fig. 2: Multiscale Food Distribution in Germany
, and
km. Each district is represented by a network node, coloring corresponds to the link strength. The network has a connectivity of 18.1%.
One of the characteristic features of transportation networks in general, which is also captured by the above gravity model, is its multiscale structure. Although short-range links are usually strongest, the algebraic tail in Eq. (2) yields long-range connections that can dominate spreading phenomena evolving on these networks. Qualitatively, this is illustrated in Fig. 3A which depicts an simple planar quasi-lattice network, in which every node is connected only to its spatially adjacent nodes. Additionally, a few long-range, random connections are added. Because of long-range connections in the network, an initially localized spreading process quickly attains a spatially incoherent structure. As a consequence of this, it is no longer possible to predict with ordinary diffusion when a spreading process will arrive at a given location in the network. More importantly, it is difficult to reconstruct the outbreak origin from a snapshot (or a sequence of snapshots) of the spatio-temporal pattern of spread alone based on conventional planar distance measures and two-dimensional geometry.
Effectively, two nodes that are connected by a long-range link in a multiscale network system are more adjacent than their spatial distance would suggest. Based on this basic and intuitive insight, a recent study 25 introduced the concept of effective distance to network-driven contagion or spreading phenomena. The most important result of this study is that spatio-temporally complex patterns of spreading can be mapped onto simple, regular wave front patterns when conventional distance is replaced by a suitably chosen effective distance. This not only permits calculations of arrival times at any node in the network but, more importantly, the identification of outbreak origins as will be explained in more detail below. The effective distance approach has been shown to work in the context of infectious disease dynamics on a global scale, for instance, the worldwide spread of SARS in 2003 and pandemic influenza H1N1 in 2009.
The effective distance method assumes that, irrespective of the details of the local dynamics of a spreading process, the proliferation of the contagion throughout the network is determined by the coupling between nodes, and that this coupling is quantified by the flux matrix elements (7). Given an initial outbreak location
, a contagion process can take a multitude of paths to any other node in the network. Each path
is taken with probability
. Consider a path that starts at
and ends at
with a sequence of intermediate steps at nodes
such that
The probability of the contagion process taking this path is assumed to be given by the product of probabilities of each step
(8) (9) (10) (11) (12) is the probability that a contaminated food at
is moved to
. The fundamental assumption in Brockmann and Helbing 25 is that the single step probability
is identified with the flux fraction
that is determined by the underlying transportation network:
by
is the number of links composing the path and
the corresponding path probability. For the sake of motivation and interpretation, we can decompose the path length into contributions by direct links of this formula:
is given by
to
decreases with increasing probability
. That is, for large values of
, the effective length is small and for vanishing transition probability the effective length diverges. (ii) The effective length of a multi-step path
as defined in Eq. (7) is the sum of the effective lengths of each segment in the path. (iii) Given two paths that occur with certainty (e.g. with
for each link), but have a different number of segments, the path that has more segments also has a larger effective length.
Generically, transportation networks are strongly heterogeneous such that, in an ensemble of paths with origin (13) and destination
, the dynamics are dominated by the most probable path and therefore the path of minimum effective length 25. The effective distance
is defined as the minimum effective length of a path
from origin
to destination
:
, one can compute the shortest path tree
, which is the collection of shortest effective paths to all other nodes in the network. This shortest path tree is equivalent to the most probable contagion hierarchy that a spreading process will take through the network.
(A) Each panel depicts a temporal snapshot (from left to right at equidistant time intervals) in a simple contagion process in which infected nodes (red) deliver the infection to connected nodes at a fixed rate before they recover at a another rate (SIR dynamics 38). The network consists of 512 nodes on a quasi-triangular, random lattice. Each node is connected to its nearest local neighbors. In addition to the local lattice structure, 128 long range links exist between randomly chosen pairs of nodes. The origin of the outbreak is marked in green. Because of long range connectivity the pattern quickly loses spatial structure and becomes chaotic such that it is difficult to predict from metric cues alone when the contagion arrives at a given node. More importantly, long range connectivity leads to a loss of spatial coherence and it becomes impossible to determine the origin of outbreak. (B) The same pattern as in (A) is shown in the effective distance perspective from the outbreak origin. The depicted tree is the shortest path tree, i.e. the most probable spreading path of the contagion process. Radial distance is proportional to effective distance as defined in the text. In this alternative representation the complex pattern in the conventional view is mapped onto a simple propagating wave front and arrival times are easily computed. (C) The regularity of the pattern is only present from the perspective of the actual outbreak origin. When the contagion process is viewed from any other node (here the node depicted in blue), the pattern lacks regularity.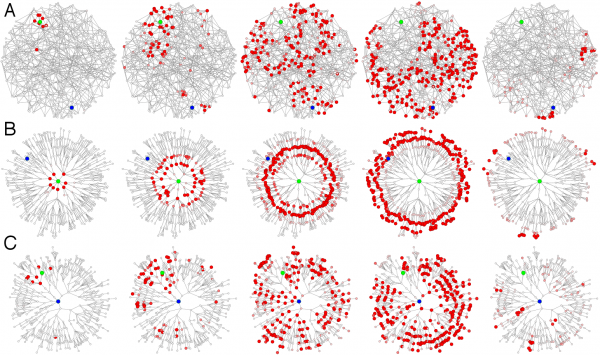
Fig. 3: Effective distance and outbreak origin reconstruction in multi-scale network contagion processes.
Fig. 3B illustrates the advantages of this approach in an artificial multi-scale network. From the perspective of the outbreak origin, the shortest path tree of the root node is shown, and the radial distance in the new map corresponds to the effective distance from the root node to the remaining nodes in the network. The same spreading process that appears to be spatio-temporally complex in the conventional metric layout is equivalent to a regular, constant-speed spreading wave in the effective distance representation. Consequently, one can calculate arrival times based on effective distance alone. In fact, in Brockmann and Helbing 25 it was shown that effective distance from the outbreak origin and arrival time strongly correlate in real scenarios, e.g. the 2003 SARS epidemic and the 2009 H1N1 pandemic influenza outbreak.
The most relevant consequence of the effective distance approach is that, only from the perspective of the actual outbreak origin, the pattern exhibits a regular concentric wave front structure. From the perspective of any other node in the network, the pattern exhibits a more or less disordered structure. Fig. 3C illustrates this. The panels depict the same dynamics as in the other panels from a randomly chosen reference node. Clearly, any spatial regularity is absent. One can now make use of this observation, i.e. the fact that the spreading pattern is regular only from the perspective of the actual outbreak location, to reconstruct the outbreak origin. Given a snapshot of the disease spread, e.g. the disease incidence at every node, one computes the effective distance perspective for each node in the network and quantifies, from which node the pattern appears to be most regular. The node with maximum regularity is considered to be the most likely outbreak origin. In the following we apply this approach to the 2011 EHEC/HUS outbreak in Germany.
Each column depicts the shortest path tree 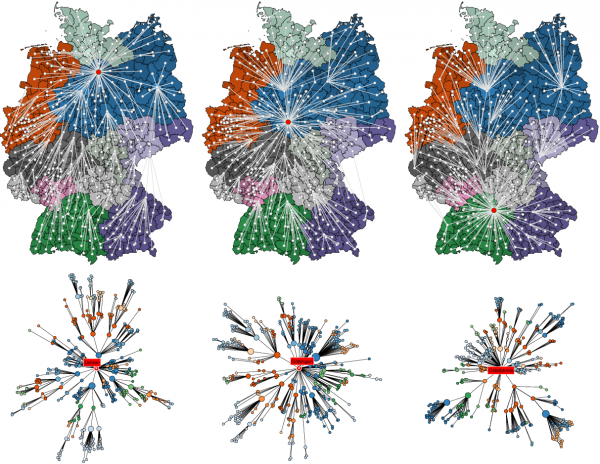
Fig. 4: Shortest path trees and effective distance among districts in Germany.
for a sample root node (red), from left to right districts Uelzen, Göttingen, and Oberalbkreis. The top row depicts embedded in the conventional geographic representation, the bottom illustrates the shortest path tree in a layout such that the radial distance is proportional to the effective distance from the root node in the same way as in Fig. 3. The shortest path tree
represents the most probable path that a contagion process takes with initial outbreak in node
.
Detection of the German EHEC/HUS outbreak origin
Given the gravity model network for food transportation, we first compute the shortest path tree (14) for every potential root node
, see Fig. 4 for examples. Next, a temporal snapshot of the EHEC incidence pattern is analyzed in each of the shortest path tree representations, i.e. from the perspective of all network nodes as potential candidate origins of outbreak. The incidence pattern typically consists of a subset
of nodes with non-zero incidence. From the perspective of the actual outbreak origin, the effective distance to these affected nodes, should be small and exhibit a small variance, a consequence of the concentricity of the spreading pattern in the effective distance representation. Therefore, in order to quantify the regularity of the incidence pattern from every potential outbreak origin, we compute the average
and standard deviation
of effective distances to nodes with nonzero incidence (the subset of nodes
) 25.
Each panel depicts a scatterplot of mean 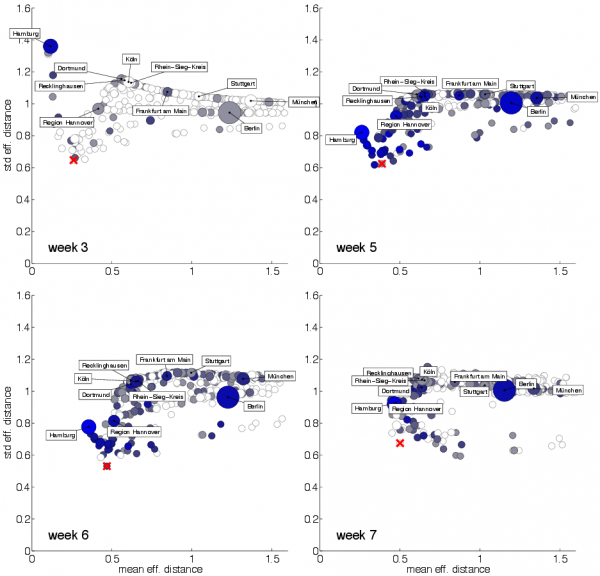
Fig. 5: EHEC/HUS outbreak origin reconstruction
and standard deviation
(see Eqs. (14)) of effective distances from candidate nodes
to the subset
of nodes that have nonzero incidence for weeks
after outbreak onset. All districts are considered as potential candidates as outbreak origin. Symbol size quantifies population size of each district, blueness quantifies incidence in the respective week. A few large district are labeled. The district with combined minimal mean and variance (closest to the origin) has a high likelihood of being the actual 2011 EHEC/HUS outbreak origin. The actual outbreak origin Uelzen in marked by a red cross.
We used the public available E. coli case count data with report date between calendar weeks 18 and 26 of 2011 28. According to the Task Force EHEC, this corresponds to the entire outbreak duration from May 2nd until July 4th, 2011 26. Fig. 5 shows the results of origin detection when the effective distance approach in combination with a gravity model for food distribution is applied to the EHEC incidence data. Since an E. coli infection clustering was noticed at May 19th, 2011 (outbreak week 3), we computed the mean and standard deviation
pair for weeks
and every node in the network treating every node
as a potential outbreak origin. When both quantities are small, the resulting spreading patterns is most concentric in the effective distance perspective. Fig. 5 shows that already in week 3 of the event, district Uelzen is identified as the potential origin of the outbreak, this is also true for weeks 6 and 7. In week 5 the method incorrectly identifies district Lüneburg as the likely outbreak origin and Uelzen ranks third in the epicenter reconstruction. Note that the geographic center of district Lüneburg is as close to Bienenbüttel (the alleged location of contaminated sprouts) as the geographic center of Uelzen (ca. 20km). Note also, that the overall distribution of pairs
differs considerably for each temporal snapshot of EHEC incidence districts close to the actual outbreak location exhibit combined small values of
. Table in Fig. 6 ranks the candidate outbreak locations for weeks 2 to 8. The ranks were computed by comparing the effective distance to the origin in the
scatter plot. For all time windows except weeks 4 and 8 the correct district ranks among the top candidates for EHEC outbreak origin. Note that other potential outbreak origins are typically districts that are in close geographic proximity to the actual outbreak location. This implies that even if the origin cannot be identified on the scale of a single district, potential candidates according to the effective distance methods are confined to a small region in the vicinity of the actual outbreak location, for instance the set of neighboring districts.
For each week 2-9 relative to the beginning of the EHEC/HUS outbreak and for each node 
Fig. 6: EHEC/HUS outbreak origin reconstruction
in the network a rank was computed based on minimization of a concentricity score
. District Uelzen, the actual outbreak district is robustly ranked among the top ranked districts, in weeks 3, 6 and 7, Uelzen is ranked first. We considered all 412 districts. For each district the distance provided in parenthesis represents the approximate distance to the actual outbreak location Bienenbüttel in district Uelzen.
For each district as a potential outbreak origin, we computed the correlation coefficient of arrival time 
Fig. 7: Correlation of effective distance and arrival time during the German EHEC/HUS outbreak, 2011.
at every other node
and effective distance from
to
. The magnitude of the correlation coefficient is color-coded from blue to red, corresponding to low and high correlation, respectively. High correlation, corresponding to high likelihood of being the outbreak origin is observed in a spatially coherent region in Northern Germany.
The effective distance method provides an alternative method for outbreak origin reconstruction. An important result presented in Ref. 25 is that arrival times of a network-driven contagion process correlate strongly with effective distance. In fact, the arrival time of the process at a node
with initial outbreak at node
increases linearly with effective distance
. Again, arrival time and effective distance only correlate strongly when the actual outbreak origin is chosen as the reference node. To supplement the above analysis we computed the correlation coefficient
of arrival times (i.e. the week of reported first case of EHEC/HUS in a given district) with effective distance, considering each node
of the 412 districts as the potential outbreak origin. We then ranked these correlation coefficients. Fig. 7 depicts the magnitude of
in a map of all German districts. Clearly, this method identifies a well-defined region in Northern Germany as containing the likely outbreak location. Note that, in contrast to the incidence patterns, the correlation coefficient varies smoothly with distance from the epicenter somewhere in Northern Germany. When correlation coefficients are ranked according to magnitude, the correct origin district Uelzen only ranks 30 out of 412 districts. However, the difference in correlation coefficients is small among the top-ranked districts, see Table in Fig. 8. The reason for the comparatively low performance of the correlation-based outbreak reconstruction could be that the temporal resolution of the data is too coarse and fluctuations dominate the signal. For instance, travel-related cases could warp the infection pattern. We conclude that outbreak origin reconstruction based on the topological features of the wave front in effective distance, as presented in Fig. 5 and Table in Fig. 6, is a more reliable technique for the detection of the outbreak origin than the correlation approach. Also, for the topological rather than the correlation-based approach only single temporal snapshots of incidence are required, which is an additional advantage.
For each potential district 
Fig. 8: Effective distance and arrival time analysis
as outbreak origin we computed the Pearson correlation of arrival time
and effective distance
and ranked all districts with respect to correlation magnitude. The actual outbreak origin Uelzen is ranked at position 30. High correlation districts all lie in Northern Germany.
Discussion and conclusion
We introduced a fast and efficient approach for the identification of the origin during food-borne disease outbreaks and evaluated the approach in the context of the 2011 EHEC/HUS outbreak in Germany. A clear advantage of the method is the robust performance on the basis of limited case report data and plausible topological assumptions concerning the underlying food distribution network. When applied to the 2011 EHEC/HUS outbreak in Germany, our method was able to identify an outbreak origin in close proximity to the actual outbreak location (Uelzen, Lower Saxony). Already three days (May 22nd, 2011) after spatial infection clustering, the effective distance approach was able to reconstruct the actual origin. This is particularly promising, as in the context of EHEC/HUS, conventional outbreak investigations, including case-control- and cohort-studies as well as sample testings and tracings along the food-shipping chain,wrongly suggested tomatoes, leafy salads and cucumbers as contaminated foods. When specific suspicions arose that cucumbers imported in Hamburg would be the infection source, our method classifies Hamburg to be a very unlikely origin. The consideration of such contradictory information could have lead to more spatially targeted sample testing, and, therefore could have improved the efficiency of the outbreak investigations.
We believe that this method can complement conventional methods of origin localization of food-borne diseases and consequently facilitate a more timely success which is vital for the development of containment strategies. The underlying network definition by the gravity model is very flexible, so that the transmission vehicle does not has to be known. Basically, the network could also capture a combination of food transportation routes as well as human mobility pattern. As our method is structurally quite general and just derived from topological features of the underlying distribution networks, we believe that our approach may be adapted and applied to a variety of contagion phenomena, human-to-human transmissible diseases, and disease dynamics on individual based contact networks and human-mediated bioinvasion processes.
References
- Newell DG, Koopmans M, Verhoef L, Duizer E, Aidara-Kane A, Sprong H, Opsteegh M, Langelaar M, Threfall J, Scheutz F, van der Giessen J, Kruse H. Food-borne diseases - the challenges of 20 years ago still persist while new ones continue to emerge. Int J Food Microbiol. 2010 May 30;139 Suppl 1:S3-15. PubMed PMID:20153070.
- Jones TF, McMillian MB, Scallan E, Frenzen PD, Cronquist AB, Thomas S, Angulo FJ. A population-based estimate of the substantial burden of diarrhoeal disease in the United States; FoodNet, 1996-2003. Epidemiol Infect. 2007 Feb;135(2):293-301. PubMed PMID:17291364.
- Bryce J, Boschi-Pinto C, Shibuya K, Black RE, the WHO Child Health Epidemiology Reference Group. WHO estimates of the causes of death in children; The Lancet, 26 March–1 April 2005; 365(9465):1147-1152.
- Buzby JC, Roberts T. Economic costs and trade impacts of microbial foodborne illness. World Health Stat Q. 1997;50(1-2):57-66. PubMed PMID:9282387.
- Altekruse SF, Cohen ML, Swerdlow DL. Emerging foodborne diseases. Emerg Infect Dis. 1997 Jul-Sep;3(3):285-93. PubMed PMID:9284372.
- Greig JD, Ravel A. Analysis of foodborne outbreak data reported internationally for source attribution. Int J Food Microbiol. 31 March 2009;130(2):77-87.
- O'Brien SJ, Gillespie IA, Sivanesan MA, Elson R, Hughes C, Adak GK. Publication bias in foodborne outbreaks of infectious intestinal disease and its implications for evidence-based food policy. England and Wales 1992-2003. Epidemiol Infect. 2006 Aug;134(4):667-74. PubMed PMID:16420723.
- World Health Organization, ed. Foodborne disease outbreaks: guidelines for investigation and control. World Health Organization, 2008.
- Regattieri A, Gamberi M, Manzini R. Traceability of food products: General framework and experimental evidence. J Food Engineering. July 2007;81(2):347-356,
- Schwägele F. Traceability from a European perspective. Meat Science. September 2005;71(1):164-173.
- Kelly S, Heaton K, Hoogewerff J. Tracing the geographical origin of food: The application of multi-element and multi-isotope analysis. Trends in Food Science & Technology. December 2005;16(12):555-567.
- Keeling MJ, Eames KT. Networks and epidemic models. J R Soc Interface. 2005 Sep 22;2(4):295-307. PubMed PMID:16849187.
- Brockmann D, David V, Gallardo AM. Human mobility and spatial disease dynamics. Reviews of Nonlinear Dynamics and Complexity. 2009;2:1-24.
- Riley S. Large-Scale Spatial-Transmission Models of Infectious Disease. Science. 1 June 2007;316(5829):1298-1301.
- Hufnagel L, Brockmann D, Geisel T. Forecast and control of epidemics in a globalized world. Proc Natl Acad Sci U S A. 2004 Oct 19;101(42):15124-9. PubMed PMID:15477600.
- Pérez-Reche FJ, Neri FM, Taraskin SN, Gilligan CA. Prediction of invasion from the early stage of an epidemic. J R Soc Interface. 2012 Sep 7;9(74):2085-96. PubMed PMID:22513723.
- Shah D, Zaman T. Detecting sources of computer viruses in networks: theory and experiment. In: Proceedings of the ACM SIGMETRICS'10. 201:203-214.
- Shah D, Zaman T. Rumor centrality: A Universal Source Detector. In: Proceedings of the ACM SIGMETRICS'12. 199-210.
- Pinto PC, Thiran P, Vetterli M. Locating the Source of Diffusion in Large-Scale Networks. Phys Rev Lett. August 2012;109(6):068702.
- Lappas T, Terzi E, Gunopulos D, Mannila H. Finding effectors in social networks. In: Proceedings of the ACM SIGKDD'10. 1059-1068.
- Milling C, Caramanis C, Mannor S, Shakkottai S. On identifying the causative network of an epidemic. In: Proceedings of Communication, Control, and Computing Annual Allerton Conference. October 2012:909-914.
- Prakash BA, Vreeken J, Faloutsos C. Spotting Culprits in Epidemics: How Many and Which Ones? In: Proceedings of 12th International Conference on Data Mining. 2012:11-20.
- V. Fioriti and M. Chinnici. Predicting the sources of an outbreak with a spectral technique, 2012.
Reference Link - Comin, CH, da Fontoura Costa L. Identifying the starting point of a spreading process in complex networks. Phys Rev E. 2011;84(5):056105-1--11.
- Brockmann D, Helbing D. The Hidden Geometry of Complex, Network-Driven Contagion Phenomena. Science. December 2013;342(6164):1337-1342.
- Frank C, Werber D, Cramer JP, Askar M, Faber M, an der Heiden M, et al. Epidemic Profile of Shiga-Toxin Pro- ducing Escherichia coli O104:H4 Outbreak in Germany. New England Journal of Medicine. 2011;365(19):1771– 1780.
- Buchholz U, Bernard H, Werber D, B ̈ hmer MM, Remschmidt C, Wilking H, et al. German Outbreak of Es- o cherichia coli O104:H4 Associated with Sprouts. New England Journal of Medicine. 2011;365(19):1763–1770.
- Robert Koch-Institute. [email protected]; 2012.
Reference Link - Bundesamt für Kartographie und Geodäsie. GEO84
Verwaltungsgrenzen; 2010.
Reference Link - Anderson J. A Theoretical Foundation for the Gravity Equation. American Economic Review. 1979;69:106–116.
- Haag G, Weidlich W. A Stochastic Theory of Interregional Migration. Geographical Analysis. 2010 Sep;16(4):331–357.
- Kaluza P, Kölzsch A, Gastner MT, Blasius B. The complex network of global cargo ship movements. J R Soc Interface. 2010 Jul 6;7(48):1093-103. PubMed PMID:20086053.
- Min Y, Chang J, Jin X, Zhong Y, Ge Y. The role of vegetables trade network in global epidemics; 2011.
Reference Link - Brockmann D, Hufnagel L, Geisel T. The scaling laws of human travel. Nature. 2006;439(7075):462–465.
- Gonzalez MC, Barabasi AL. Understanding individual human mobility patterns. Nature. 2008;453(7196):779- 782.
- Serrano MA, Boguñá M, Vespignani A. Extracting the multiscale backbone of complex weighted networks. Proc Natl Acad Sci U S A. 2009 Apr 21;106(16):6483-8. PubMed PMID:19357301.
- Woolley-Meza O, Thiemann C, Grady D, Lee JJ, Seebens H, Blasius B, et al. Complexity in human transporta-
tion networks: a comparative analysis of worldwide air transportation and global cargo-ship movements. The
European Physical Journal B. 2011 Dec;84(4):589–600.
Reference Link - Anderson RM, May RM. Infectious diseases of humans : dynamics and control. Oxford New York: Oxford University Press; 1991.

Leave a Comment
You must be logged in to post a comment.